

 PDF
PDF ePub
ePub Citation
 Print
Print


INTRODUCTION
Accounting for 90% of cases of diabetes, type 2 diabetes mellitus (T2DM) is a chronic metabolic disorder that is characterized by insulin resistance and high blood glucose levels (hyperglycemia) [12]. The number of cases of T2DM has almost quadrupled since 1980 and it has been become a major global health challenge [3]. The chronic hyperglycemia of T2DM is associated with long-term complications, including the damage, dysfunction, and failure of heart, kidneys, blood vessels, and other organs [4]. Pre-diabetes can precede T2DM by 10 to 20 years [256], and research suggests that T2DM could be largely preventable through dietary and lifestyle changes [78].
Tea is the second most commonly consumed beverage in the world aside from water [9]. In comparison to black tea and oolong tea, green tea (GT) contains greater quantities of catechins, which are strong antioxidants in vitro and in vivo. The most abundant catechin found in GT is epigallocatechin gallate (EGCG), which is thought to have many health benefits including a role in body weight control and diabetes prevention [10]. Experimental animal studies have shown that green tea extract (GTE) can increase insulin sensitivity and lower blood glucose levels in diabetic (db/db) mice [1112], whilst in humans, epidemiological studies suggest that long-term consumption of GT may be associated with a reduction of the incidence of diabetes [1314]. A number of randomized controlled trials (RCTs) have reported that daily consumption of GTE may enhance oral glucose tolerance in healthy people as well as reduce fasting plasma glucose and glycosylated hemoglobin (HbA1c) levels in people at risk of diabetes [1516171819]. Therefore, GT or GTE may have a role to play in reducing insulin resistance and improving glycemic control in people with T2DM.
However, systematic reviews and meta-analyses investigating the relationship between GT consumption and insulin resistance and glycemic control have reported mixed findings. Whilst one meta-analysis has concluded that GT consumption is effective in decreasing fasting glucose and glycemic control (HbA1c concentration) in both healthy subjects and patients with obesity or metabolic syndrome [20]. Wang et al. [21] found no effect of GT consumption on fasting glucose, insulin, glycemic control or insulin resistance in participants both with, and at risk of, T2DM. In order to clarify the potential of GT in improving metabolic health in people with T2DM, further evaluation of the evidence for this health beneficial effect of GT on people with a clinical diagnosis of T2DM or pre-diabetes are needed. The objectives of this study are thus: (1) to collate and evaluate the evidence for the effect of GT or GTE on insulin resistance and glycemic control in people with prediabetes or T2DM; (2) conduct a meta-analysis to assess the standardised mean difference (SMD) in biomarkers of insulin resistance and glycemic control between GT/GTE and placebo group.
Go to : 
METHODS
Search strategy
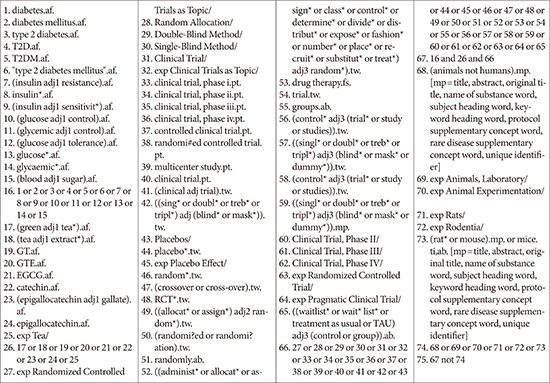
The following electronic databases were searched from their inception upto April 2017: Ovid MEDLINE (1946 to present), Ovid Embase (1974 to April 2017), AMED (1985 to April 2017), the Web of Science (Core Collection), The Cochrane Library (2017). Search terms were: ‘green tea,’ ‘GTE,’ ‘EGCG,’ ‘epigallocatechin,’ ‘epigallocatechin,’ ‘epicatechin,’ ‘random,’ ‘RCT,’ ‘insulin resistance,’ ‘glycemic control,’ ‘diabetes,’ and ‘T2DM’ (Appendix 1 for electronic search strategy). The reference list from all selected articles were hand-searched for further relevant studies. The first 20 pages of Google Scholar were hand-searched for additional studies.
Selection criteria
Criteria for considering studies for this review were: (1) randomised controlled trials; (2) participants were people with pre-diabetes (fasting blood glucose 110 to 125 mg/dL [6.1 to 6.9 mM/L]) or T2DM; (3) the interventions were GT bags, GTEs or aqueous beverages where the chemical composition was provided; and (4) comparable measures for insulin resistance and glycemic control were provided. In addition, studies that used a cross-over design were only included if the results of the period before the cross-over were presented separately, in which data from the first phase were analysed.
Excluded studies
Studies were excluded if they were: (1) animal trials; (2) observational studies; (3) review articles; (4) the experimental beverage contains other kinds of tea in addition to GT; (5) the preparation of GT contained ingredients in addition to GT or its natural constituents of catechins and caffeine; (6) the intervention or treatment included a combination of GT and physical activity; and (7) the participants' clinical state was not specified.
Data extraction and management
Data were extracted independently by two reviewers (J.Y. and A.R.C.) and confirmed by a third reviewer (P.S.) using a form adapted from Cochrane Data Extraction Form for Intervention Review. Specific information, including the study design, the characteristics of participants, and study outcomes, were extracted and recorded. A summary of the characteristic s of the studies and the results are presented in Table 1. Any discrepancies were resolved through discussion between the reviewers.
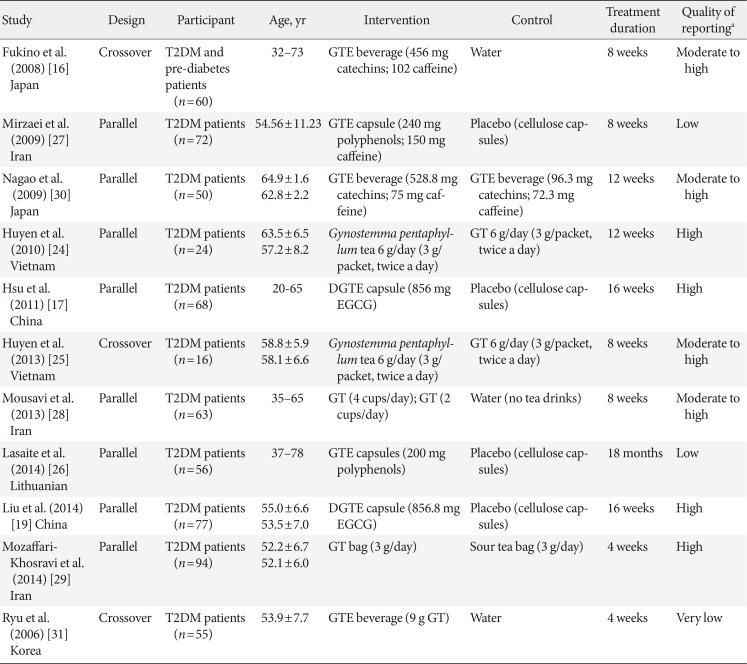
Table 1
Characteristics of the included studies
| Study | Design | Participant | Age, yr | Intervention | Control | Treatment duration | Quality of reportinga |
|---|---|---|---|---|---|---|---|
|
Fukino et al. (2008) [16] Japan |
Crossover |
T2DM and pre-diabetes patients (n=60) |
32–73 | GTE beverage (456 mg catechins; 102 caffeine) | Water | 8 weeks | Moderate to high |
|
Mirzaei et al. (2009) [27] Iran |
Parallel | T2DM patients (n=72) | 54.56±11.23 | GTE capsule (240 mg polyphenols; 150 mg caffeine) | Placebo (cellulose capsules) | 8 weeks | Low |
|
Nagao et al. (2009) [30] Japan |
Parallel | T2DM patients (n=50) |
64.9±1.6 62.8±2.2 |
GTE beverage (528.8 mg catechins; 75 mg caffeine) | GTE beverage (96.3 mg catechins; 72.3 mg caffeine) | 12 weeks | Moderate to high |
|
Huyen et al. (2010) [24] Vietnam |
Parallel | T2DM patients (n=24) |
63.5±6.5 57.2±8.2 |
Gynostemma pentaphyllum tea 6 g/day (3 g/packet, twice a day) | GT 6 g/day (3 g/packet, twice a day) | 12 weeks | High |
|
Hsu et al. (2011) [17] China |
Parallel | T2DM patients (n=68) | 20-65 | DGTE capsule (856 mg EGCG) | Placebo (cellulose capsules) | 16 weeks | High |
|
Huyen et al. (2013) [25] Vietnam |
Crossover | T2DM patients (n=16) |
58.8±5.9 58.1±6.6 |
Gynostemma pentaphyllum tea 6 g/day (3 g/packet, twice a day) | GT 6 g/day (3 g/packet, twice a day) | 8 weeks | Moderate to high |
|
Mousavi et al. (2013) [28] Iran |
Parallel | T2DM patients (n=63) | 35–65 | GT (4 cups/day); GT (2 cups/day) | Water (no tea drinks) | 8 weeks | Moderate to high |
|
Lasaite et al. (2014) [26] Lithuanian |
Parallel | T2DM patients (n=56) | 37–78 | GTE capsules (200 mg polyphenols) | Placebo (cellulose capsules) | 18 months | Low |
| Liu et al. (2014) [19] China | Parallel | T2DM patients (n=77) |
55.0±6.6 53.5±7.0 |
DGTE capsule (856.8 mg EGCG) | Placebo (cellulose capsules) | 16 weeks | High |
|
Mozaffari-Khosravi et al. (2014) [29] Iran |
Parallel | T2DM patients (n=94) |
52.2±6.7 52.1±6.0 |
GT bag (3 g/day) | Sour tea bag (3 g/day) | 4 weeks | High |
|
Ryu et al. (2006) [31] Korea |
Crossover | T2DM patients (n=55) | 53.9±7.7 | GTE beverage (9 g GT) | Water | 4 weeks | Very low |
Values are presented as range or mean±standard deviation.
T2DM, type 2 diabetes mellitus; GTE, green tea extract; GT, green tea; DGTE, decaffeinated green tea extract; EGCG, epigallocatechin gallate.
aAssessed by the CONSORT (CONsolidated Standards of Reporting Trials) checklist for randomized controlled trials.
![]()
All extracted data were entered into the RevMan 5.3 (Cochrane, London, UK) for further analysis.
Methodological quality and risk of bias assessment
Assessment of the reporting quality of the included studies was based on the CONSORT (CONsolidated Standards of Reporting Trials) 2010 checklist [22]. Studies were categorized as (1) high quality, with more than 75% compliance to the checklist; (2) moderate quality, with 50% to 75% compliance to the checklist; (3) low quality, with less than 50% compliance to the checklist; and (4) very low quality, with no more than 30% compliance to the checklist.
The risk of bias of each included study was assessed under the criteria in the ‘risk of bias assessment tool’ [23]. For each entry, the risk of bias was assessed as ‘low risk,’ ‘high risk,’ or ‘unclear risk.’ The assessment process was conducted by J.Y. and A.R.C. independently. A meeting was organized to discuss any disagreements.
Data analysis
The SMD was calculated based on the standard equation to combine trials which measured the same outcome using different methods [23]. The pooled estimates of SMD were calculated using a random-effects model with 95% confidence interval (CI) and inverse variance weights. The statistical heterogeneity was examined and measured using the I2 statistic, and subgroup analysis was considered when two or more trials contributed data. The pre-specified subgroup analysis was for decaffeinated GTE versus GT beverage/extract. Dealing with the missing data was based on the technique given by Cochrane handbook with the following principles [23]: (1) obtaining the missing data from the other available data provided in the trial; (2) substituting the missing data with replacement values; and (3) analysing only the available data.
Ethical approval
The study was approved by the Human Research Ethics Committee of the Centre for Exercise, Nutrition and Health Sciences, University of Bristol (Ethics Approval Number: 013-15).
Go to :
RESULTS
Results of the search
A description of the selection process is outlined in Fig. 1 in the form of the PRISMA (Preferred Reporting Items for Systematic Reviews and Meta-Analyses) flowchart (Appendix 1, search strategy MEDLINE). In total, 829 references were identified from the research of which eleven of the 23 full-text studies that were examined were included in this review [1617192425262728293031]. The characteristics of the included studies are provided in Tables 1 and 2. The 12 excluded studies [323334353637383940414243] with the reason for exclusion were recorded in Table 3.

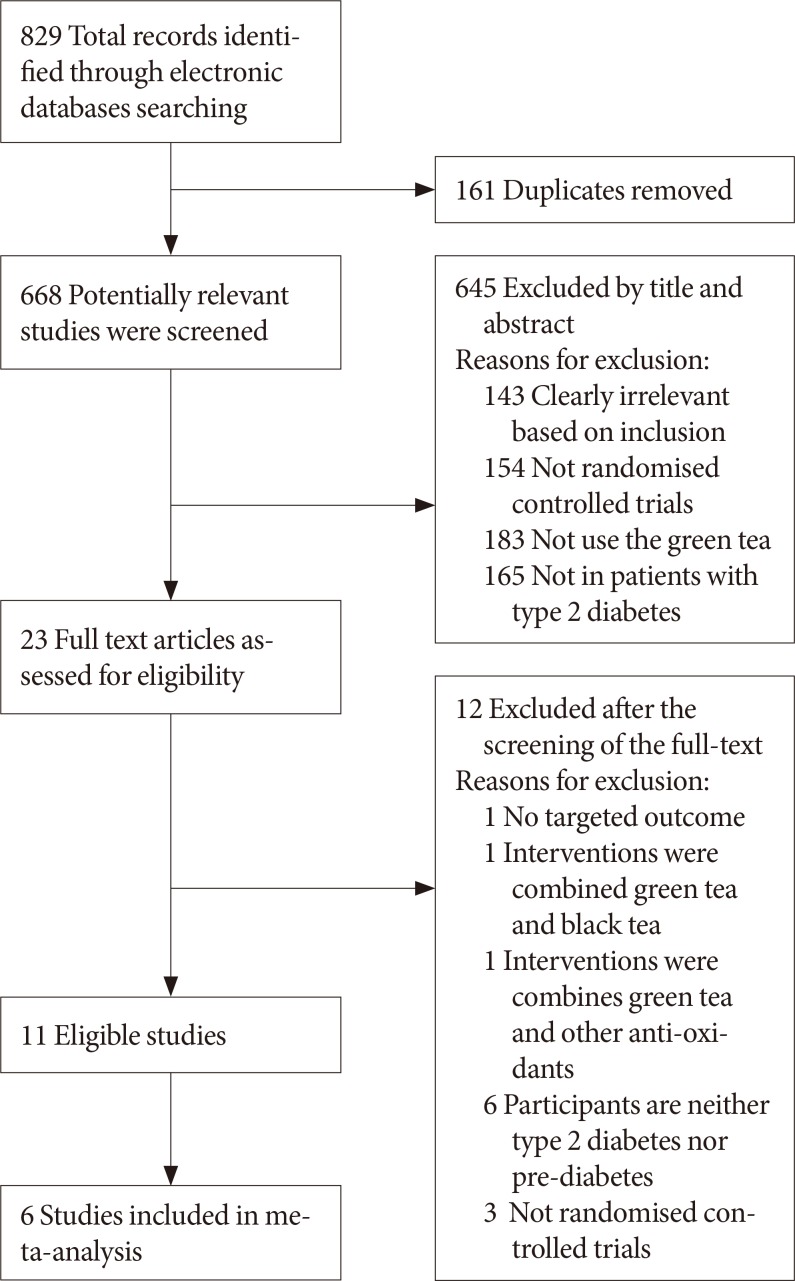 | Fig. 1Flow-chart of study selection and exclusion in details.Adapted from www.mdpi.com/link.
|
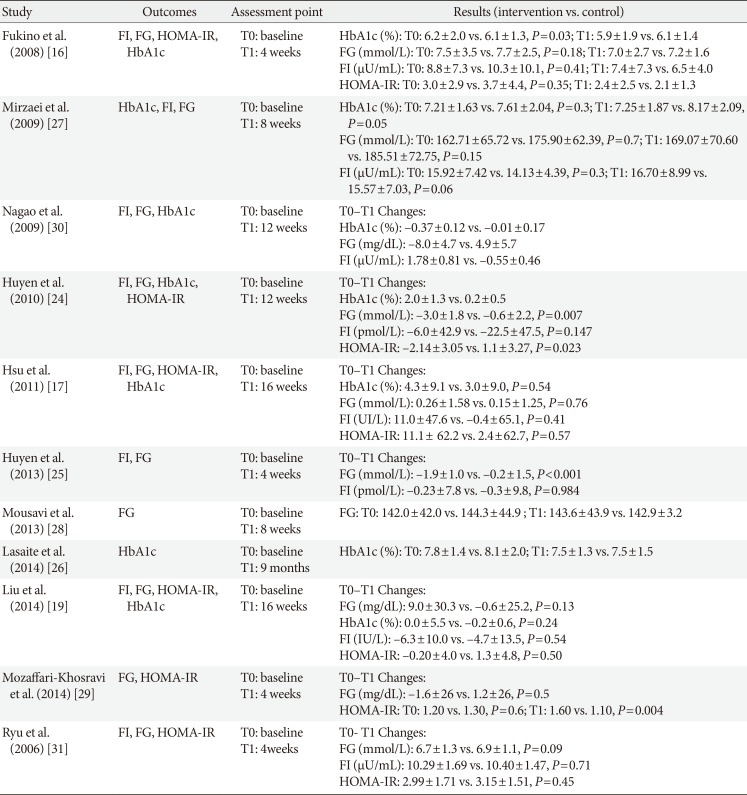
Table 2
Outcomes and results of the included studies
| Study | Outcomes | Assessment point | Results (intervention vs. control) |
|---|---|---|---|
| Fukino et al. (2008) [16] | FI, FG, HOMA-IR, HbA1c |
T0: baseline T1: 4 weeks |
HbA1c (%): T0: 6.2±2.0 vs. 6.1±1.3, P=0.03; T1: 5.9±1.9 vs. 6.1±1.4 FG (mmol/L): T0: 7.5±3.5 vs. 7.7±2.5, P=0.18; T1: 7.0±2.7 vs. 7.2±1.6 FI (µU/mL): T0: 8.8±7.3 vs. 10.3±10.1, P=0.41; T1: 7.4±7.3 vs. 6.5±4.0 HOMA-IR: T0: 3.0±2.9 vs. 3.7±4.4, P=0.35; T1: 2.4±2.5 vs. 2.1±1.3 |
| Mirzaei et al. (2009) [27] | HbA1c, FI, FG |
T0: baseline T1: 8 weeks |
HbA1c (%): T0: 7.21±1.63 vs. 7.61±2.04, P=0.3; T1: 7.25±1.87 vs. 8.17±2.09, P=0.05 FG (mmol/L): T0: 162.71±65.72 vs. 175.90±62.39, P=0.7; T1: 169.07±70.60 vs. 185.51±72.75, P=0.15 FI (µU/mL): T0: 15.92±7.42 vs. 14.13±4.39, P=0.3; T1: 16.70±8.99 vs. 15.57±7.03, P=0.06 |
| Nagao et al. (2009) [30] | FI, FG, HbA1c |
T0: baseline T1: 12 weeks |
T0–T1 Changes: HbA1c (%): –0.37±0.12 vs. –0.01±0.17 FG (mg/dL): –8.0±4.7 vs. 4.9±5.7 FI (µU/mL): 1.78±0.81 vs. –0.55±0.46 |
| Huyen et al. (2010) [24] | FI, FG, HbA1c, HOMA-IR |
T0: baseline T1: 12 weeks |
T0–T1 Changes: HbA1c (%): 2.0±1.3 vs. 0.2±0.5 FG (mmol/L): –3.0±1.8 vs. –0.6±2.2, P=0.007 FI (pmol/L): –6.0±42.9 vs. –22.5±47.5, P=0.147 HOMA-IR: –2.14±3.05 vs. 1.1±3.27, P=0.023 |
| Hsu et al. (2011) [17] | FI, FG, HOMA-IR, HbA1c |
T0: baseline T1: 16 weeks |
T0–T1 Changes: HbA1c (%): 4.3±9.1 vs. 3.0±9.0, P=0.54 FG (mmol/L): 0.26±1.58 vs. 0.15±1.25, P=0.76 FI (UI/L): 11.0±47.6 vs. –0.4±65.1, P=0.41 HOMA-IR: 11.1± 62.2 vs. 2.4±62.7, P=0.57 |
| Huyen et al. (2013) [25] | FI, FG |
T0: baseline T1: 4 weeks |
T0–T1 Changes: FG (mmol/L): –1.9±1.0 vs. –0.2±1.5, P<0.001 FI (pmol/L): –0.23±7.8 vs. –0.3±9.8, P=0.984 |
| Mousavi et al. (2013) [28] | FG |
T0: baseline T1: 8 weeks |
FG: T0: 142.0±42.0 vs. 144.3±44.9 ; T1: 143.6±43.9 vs. 142.9±3.2 |
| Lasaite et al. (2014) [26] | HbA1c |
T0: baseline T1: 9 months |
HbA1c (%): T0: 7.8±1.4 vs. 8.1±2.0; T1: 7.5±1.3 vs. 7.5±1.5 |
| Liu et al. (2014) [19] | FI, FG, HOMA-IR, HbA1c |
T0: baseline T1: 16 weeks |
T0–T1 Changes: FG (mg/dL): 9.0±30.3 vs. –0.6±25.2, P=0.13 HbA1c (%): 0.0±5.5 vs. –0.2±0.6, P=0.24 FI (IU/L): –6.3±10.0 vs. –4.7±13.5, P=0.54 HOMA-IR: –0.20±4.0 vs. 1.3±4.8, P=0.50 |
| Mozaffari-Khosravi et al. (2014) [29] | FG, HOMA-IR |
T0: baseline T1: 4 weeks |
T0–T1 Changes: FG (mg/dL): –1.6±26 vs. 1.2±26, P=0.5 HOMA-IR: T0: 1.20 vs. 1.30, P=0.6; T1: 1.60 vs. 1.10, P=0.004 |
| Ryu et al. (2006) [31] | FI, FG, HOMA-IR |
T0: baseline T1: 4weeks |
T0- T1 Changes: FG (mmol/L): 6.7±1.3 vs. 6.9±1.1, P=0.09 FI (µU/mL): 10.29±1.69 vs. 10.40±1.47, P=0.71 HOMA-IR: 2.99±1.71 vs. 3.15±1.51, P=0.45 |
![]()
Table 3
Excluded studies after screening of the full text
| Excluded study | Reasons for exclusion |
|---|---|
| MacKenzie et al. (2007) [32] | Intervention are combined green tea and black tea |
| Fenercioglu et al. (2010) [33] | Intervention are combined green tea and pomegranate extract |
| Stote et al. (2012) [34] | Participants are neither T2DM or pre-diabetes patients |
| Vieira Senger et al. (2012) [35] | Participants are neither T2DM or pre-diabetes patients |
| Huang et al. (2013) [36] | Not RCT |
| Pham et al. (2014) [37] | Participants are neither T2DM or pre-diabetes patients |
| Takahash et al. (2014) [38] | No targeted outcomes reported |
| Keske et al. (2015) [39] | Not RCT |
| Dower et al. (2015) [40] | Participants are neither T2DM or pre-diabetes patients |
| Peristiowati et al. (2015) [41] | Not RCT |
| Dostal et al. (2016) [42] | Participants are neither T2DM or pre-diabetes patients |
| Lu et al. (2016) [43] | Participants are neither T2DM or pre-diabetes patients |
![]()
Trial characteristics
Trial characteristics for all the included studies are illustrated in Table 1. Participants of 10 studies were T2DM patients (n=635) between the age of 20 to 78 years [17192425262728293031] while one study enrolled the patients with T2DM and pre-diabetes [16]. Additionally, 10 of the studies were conducted in Asian countries, including China [1719], Japan [1630], Iran [272829], Korea [31], and Vietnam [2425], and one study was conducted in Lithuania [26]. The type of the GT or GTE used in the 11 studies included GTE beverage [163031], four of the studies used GT bags [24252829], two studies used GTE capsules [2627], and two studies used decaffeinated GTE capsules [1719]. As the most common test for glucose control, the HbA1c (%) was measured in seven studies [16171924262730] while the fasting blood glucose (FG) was been measured in 10 studies [16171924252728293031]. Eight studies provided data for the change of fasting insulin (FI) [1617192425273031] and six studies measured the homeostatic model assessment for insulin resistance (HOMA-IR) [161719242931].
Quality of reporting
Overall, four studies were judged as being of high reporting quality [17192429], four studies were of moderate to high quality [16252830], and two were of low quality [2627]. One of the study was of very low quality [31], in which only 30% of items met the assessment criteria. Thus, this study was excluded from further data analysis.
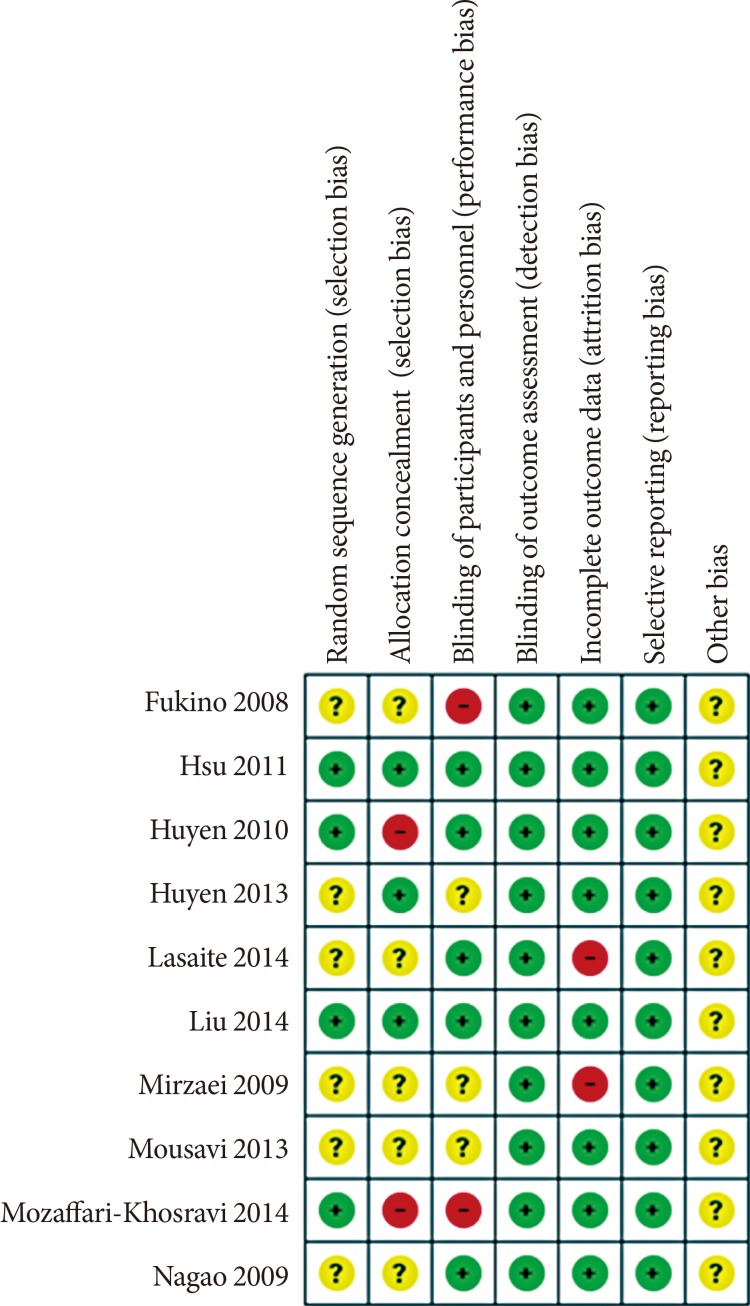
For the risk of bias assessment (Fig. 2), the majority of studies were rated as low risk of bias on most assessed items. Most of the information from the studies was categorized as having an unclear bias for key elements of randomization. Two studies [1629] were classified as high risk of performance bias without blinding. Two studies were judged to be at high risk of bias for the allocation concealment, in which the participants were matched by gender through the allocation process [2429]. High attrition bias was found in two studies [2627].
Meta-analysis
In total, data from six studies [161719262728] that compared GT supplements with placebos were included in these meta-analyses. Four studies were excluded from the meta-analyses since the beverages in these studies included sour tea [29], Gynostemma pentaphyllum tea [2425], and lower dose of GT [30], which might be less comparative. One study was excluded due to the very low report quality [26]. Diet and physical activities were controlled in each arm of the six included RCTs. These studies were excluded post hoc as we had not anticipated this variation prior to extraction. Forest plots depicting the results of meta-analysis are shown in Fig. 3.
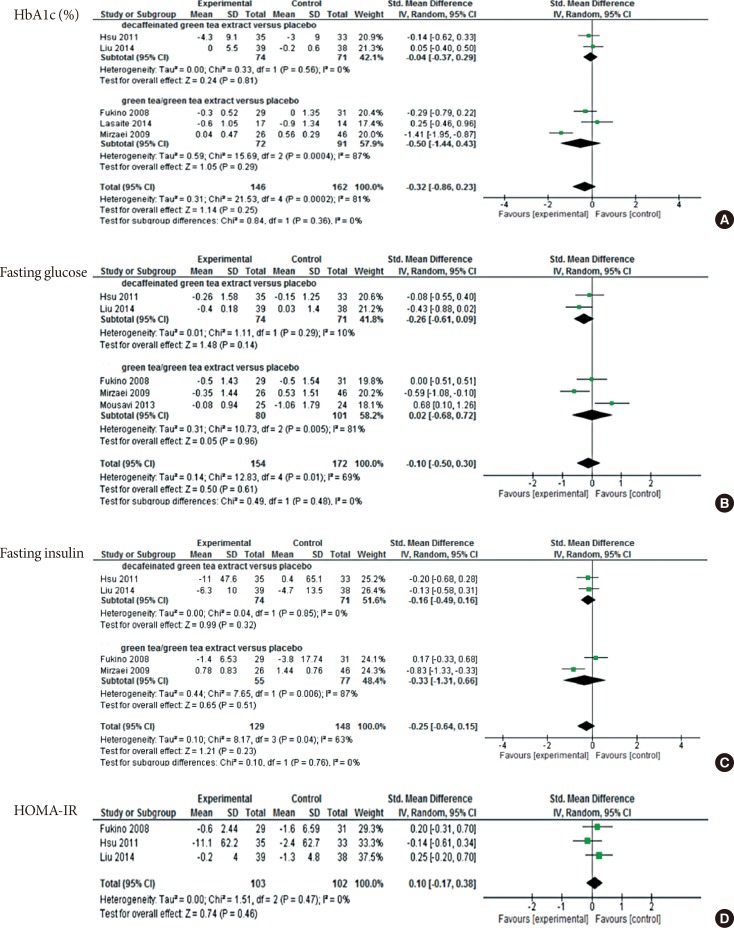 | Fig. 3Meta-analysis results for each assessed outcome. (A) Comparison between decaffeinated green tea extract and placebo, outcome: glycosylated hemoglobin (HbA1c, %). (B) Comparison between decaffeinated green tea extract and green tea extract, outcome: fasting glucose. (C) Comparison between decaffeinated green tea extract and green tea extract, outcome: fasting insulin. (D) Comparison between decaffeinated green tea extract and green tea extract versus placebo, outcome: homeostatic model assessment for insulin resistance (HOMA-IR). SD, standard deviation; IV, independent variable; CI, confidence interval.
|
HbA1c
Five studies involving 308 participants provided data for HbA1c concentration before and after the intervention (Fig. 3A) [1617192627]. There was no overall difference between the treatment and control arms (SMD, −0.32; 95% CI, −0.86 to 0.23; P=0.25) for all studies. Considerable heterogeneity was found in the subgroups of GT/GTE (I2=87%), while the decaffeinated GTE group showed consistent results (I2=0%). For the subgroup analysis, there was no effect for GT/GTE (SMD, −0.50; 95% CI, −1.44 to 0.43; P=0.29) or decaffeinated GTE (SMD, −0.04; 95% CI, −0.37 to 0.29; P=0.81) on HbA1c.
Fasting glucose
Five studies with 326 participants provided information for the analysis of fasting glucose at baseline and after the intervention (Fig. 3B) [1617192728]. No evidence was found that GT/GTE affects FG levels in comparison to the placebo group (SMD, −0.10; 95% CI, −0.50 to 0.30; P=0.61). The heterogeneity within the subgroup of GT/GTE was considerable (I2=81%); comparatively, the decaffeinated GTE group showed a low level of heterogeneity (I2=10%). Findings from subgroup analysis showed no effect of the test beverage in both the decaffeinated GTE and the GT/GTE groups (SMD, −0.26; 95% CI, −0.61 to 0.09; P=0.14) (SMD, 95% CI, 0.02; −0.68 to 0.72; P= 0.96, respectively).
Fasting insulin
Data from four studies were pooled in to the FI analysis, from which a total of 277 participants were included (Fig. 3C) [16171927]. The overall heterogeneity was substantial (I2=63%) among these four studies and considerable for the subgroup of GT/GTE (I2=87%). No intervention effect on FI was seen overall (SMD, −0.25; 95% CI, −0.64 to 0.15, P=0.23) or in subgroup analyses (decaffeinated GTE: SMD, −0.16; 95% CI, −0.49 to 0.16; P=0.32) (GT/GTE: SMD, −0.33; 95% CI, −1.31 to 0.66; P=0.51).
HOMA-IR
Three studies involving 205 participants were included in the HOMA-IR analysis (Fig. 3D); two studies using decaffeinated GTE [1719] and one [16] using GT beverage as the intervention arm. There was no evidence that either intervention was effective in improving HOMA-IR (SMD, 0.10; 95% CI, −0.17 to 0.38; P=0.46). However, due to the insufficient amount of studies and the relatively small sample size, this analysis result may not be reliable.
Go to :
DISCUSSION
In total, 11 studies were identified in this systematic review. Of these, six studies were included in the meta-analysis. We found no evidence of differences between GT/GTE/decaffeinated GTE and the placebo for any analyzed outcomes. Within the subgroup analyses we found considerable heterogeneity between studies which may reflect the limited number of studies in this field. The general reporting quality of the included studies was moderate to high. Moreover, eight of the studies included in this review were conducted in developing countries, where the prevalence rates of T2DM are higher than in developed nations. Additionally, the types of GT provided in studies by [17192627] were capsules, which may be more convenient and acceptable for the T2DM participants than a GT beverage, since the drop-out participants cited the unacceptable taste of GT as their reason for leaving. However, the cost-effective factors for using the capsules or the GT bags were not mentioned in these studies. It should also be noted that no information for this review is available from large-scale programmatic effectiveness trials. Instead, most of the information obtained was from small-scale studies using targeted fortification. In addition, the majority of the studies were carried out in Asian countries (n=10), since GT consumption appeared to be more acceptable in these countries [21].
This systematic review and meta-analysis comprehensively evaluated the effect of GT/GTE on insulin and glycemic parameters in people with T2DM or pre-diabetes. Studies included in this review had been updated from Wang et al. [21], in which the findings show no effects of the GT/GTE on HbA1c, FG, FI, and HOMA-IR in people at risk of T2DM. Compared to the current study, the latest studies included in Wang et al. [21] were published in 2011 [1517]. Moreover, the population in Wang et al. [21] included people with T2DM, prediabetes, obesity, or metabolic syndrome, where the subgroup analysis included only four studies of people with T2DM or prediabetes patients. Additionally, it might be criticized that the dependent variable in one of the studies in Wang et al. [21] did not focus on the T2DM, but on the cardiovascular disease (CVD). Thus, we updated the literature search up to April 2017 to expand the evidence base for individuals with T2DM or prediabetes. In this review, six studies on T2DM or prediabetes people were pooled into meta-analysis and results show consensus evidence with Wang et al. [21]. Although these results suggested no effects of GT/GTE in the reduction of insulin resistance and the maintenance of glycemic, several findings provide evidence for further exploration. For one aspect, findings of Nagao et al. [30] in 2009 indicated a reduction of HbA1c and fasting glucose levels. For another, in the results of a registered trial by Mozaffari-Khosravi et al. [29], GT had showed a positive effect on reducing the HOMA-IR level in people with T2DM. These two studies were excluded from the meta-analysis, since the comparison arm in both studies was neither a placebo nor the water, which might be less comparative. However, they provided evidence for the potential effects of GT on improving the insulin function. Future studies with complete comparisons between GT/GTE and placebo/water are required for improving the strength of this evidence.
In recent years, an increasing amount of research has suggested that GT may favorably modulate insulin sensitivity and glucose homeostasis and therefore inhibit the development of T2DM [944]. A review of experimental studies demonstrate that GT plays a role in enhancing insulin sensitivity by improving the absorption of glucose into skeletal muscle in healthy subjects [9]. Evidence from animal studies indicates that the GTE could lower blood glucose levels and alleviate insulin resistance in diabetic mice by increasing the expression of glucose transporter IV and improving muscular β-oxidation [1245]. An animal study reported that the increased insulin concentrations were found in rats with 23 g GTE feeding per day; this study suggested that a higher consumption of GT were beneficial for T2DM prevention [46]. Further, a meta-analyses included 17 RCTs found that GT/GTE consumptions are associated with improved glycemic control and reduced FI concentration in healthy subjects as well as in people with obesity, CVD, cancer, and T2DM [20]. Comparatively, different findings were found in another meta-analyses, which included nine cohort studies to explore the consumption of tea and the risk of T2DM [47]. Although results from this meta-analyses show no association between the tea consumption and the reduced T2DM risk (risk ratio [RR], 0.96; 95% CI, 0.92 to 1.01), stratified analyses of this study indicated that >4 cups per day tea consumption might related to the prevention of T2DM (RR, 0.8; 95% CI, 0.7 to 0.93). Recently, another meta-analysis included 10 studies identified that the consumptions of tea could alleviate the decrease of fasting blood insulin (1.30 U/L; 95% CI, 0.36 to 2.24) in T2DM subjects whereas no differences found in homeostasis model of insulin resistance 0.38 (95% CI, 0.18 to 0.95) and fasting blood glucose 0.05 mmol/L (95% CI, 0.51 to 0.40) [48]. The test tea in both meta-analyses included black tea, oolong tea, GT, and a combination of the tea extracts.
This review has several limitations that should be acknowledged. First, only a small number of studies met the inclusion criteria. Second, due to the small number of studies included we were unable to repeat our analyses excluding studies of low methodological quality, which may have biased our results. Moreover, the methodological qualities of some of the included studies are relatively low. Finally, the random-effects model used in these meta-analyses may achieve better estimates when a greater number of studies are included [23]. Thus, since these results are inconsistent, further RCTs with larger sample sizes and longer duration are needed in the future, in order to have a better estimation of the effects of GT/GTE in retarding the development of T2DM or its clinical consequences in people with T2DM or pre-diabetes.
As suggested by Bauer et al. [49], the prevention of T2DM is a ‘whole-of-life’ task requiring an integrated approach operating from the origin of the disease. As one of the most popular beverages worldwide, tea had been examined in both epidemiological and experimental studies as a possible food supplements for the prevention of T2DM [846]. Therefore, any discovery of specific anti-diabetic effects in GT on insulin resistance and glycemic control might ultimately lead to therapeutic modalities that can retard the development of T2DM.
Based on the present meta-analysis results, in people with T2DM, no reductions on the levels of HbA1c, fasting glucose, FI, and HOMA-IR were found in GT or GTE treatment groups, in comparison with the placebo groups. However, findings from the meta-analyses may be limited due to the small number of eligible studies. Results may also be affected by the limited duration of intervention, varied reporting quality of the included studies. Therefore, further investigations in this field are necessary. Particularly, adequately powered RCTs with longer duration of follow-up are needed.
Go to :
 XML Download