

 PDF
PDF ePub
ePub Citation
 Print
Print


INTRODUCTION
Dyslipidemia is an important clinical abnormality seen in patients with diabetes mellitus. The characteristic features of diabetic dyslipidemia are high plasma triglycerides (TG) concentration, low high density lipoprotein cholesterol (HDL-C) concentration and increased concentration of small, dense, low density lipoprotein (sdLDL) particles. Insulin resistance leads to mobilization of free fatty acid from adipose tissue to liver, which causes increased TG production. Dysfunction of lipoprotein lipase due to long-standing diabetes would further increase TG level causing accumulation of large TG-rich very low density lipoprotein particles, which in turn generate sdLDL particles [1]. Thus, even when low density lipoprotein cholesterol (LDL-C) level in type 2 diabetes mellitus (T2DM) patients is not elevated, they still have a preponderance of atherogenic sdLDL particles [2].
Diabetic nephropathy is one of the major complications of diabetes, characterized by proteinuria and renal insufficiency. It is also an established risk factor for cardiovascular events as well as mortality [3]. Lipoprotein abnormalities are known to occur among patients with diabetic nephropathy, and majority of such patients die of cardiovascular events before their renal dysfunction progresses to end stage renal disease [45]. Diabetic nephropathy causes quantitative as well as compositional abnormalities in lipids. An increased presence of atherogenic sdLDL particles is observed even among diabetic nephropathy patients with normal total cholesterol (TC) and TG concentration [4].
Moreover, dyslipidemia is shown to accelerate the rate of renal damage. Clinical and experimental studies have reported that dyslipidemia leads to progressive loss of renal function among diabetic patients [6]. The mechanism behind this action is not been fully elucidated, but it has been proposed that lipids may damage vascular, mesangial, and tubular cells of kidneys [7]. Underlying dysglycemia among diabetic patients further accelerates the renal damage induced by dyslipidemia [8]. Thus, dyslipidemia and nephropathy act synergistically in worsening the clinical condition and increase the risk of renal or cardiovascular consequences among diabetic patients.
There are studies from India that have assessed lipid abnormalities in subjects with chronic renal failure [910], but studies on diabetic nephropathy per se are few. We conducted a retrospective analysis comparing the extent of dyslipidemia among diabetic nephropathy patients and also evaluated the risk factors associated with nephropathy among them.
METHODS
Subjects
This retrospective study was conducted at a tertiary care diabetes specialty hospital in South India after obtaining necessary ethical clearance. Case sheets of randomly selected subjects with established T2DM were screened for the study. Subjects with urinary tract infection, hematuria, established coronary artery disease, thyroid dysfunction, and end stage renal disease were excluded from the study. Subjects with irregular follow-up, missing data or who underwent blood investigations in external labs were also excluded from the study. The case sheets were reviewed and subjects without nephropathy were included in control group (group 1) and with overt nephropathy were included in study group (group 2). The inclusion/exclusion criteria were as follows: Group 1 included subjects with T2DM, but without history of albuminuria or proteinuria, as indicated by <30 mg of albumin per gram of creatinine on a spot urine sample, in the three most recent lab reports. Group 2 included subjects with overt nephropathy. Subjects with persistent proteinuria, defined as albumin/creatinine ratio of >300 mg of albumin per gram of creatinine on a spot urine sample, in at least two of the three most recent urine analysis, were considered to have overt nephropathy in this study. Onset of diabetes should have preceded the onset of nephropathy among the patients of this group. We screened 439 case sheets, and finally enrolled 92 subjects in control group (group 1) and 89 in diabetic nephropathy group (group 2). The two groups were matched for age and duration of diabetes. Anthropometric details such as height, weight, and body mass index (BMI) were recorded from the case sheets. Details regarding their medications, diet and lifestyle habits were also collected.
Laboratory analysis
TC, TG, HDL-C, LDL-C, urea, and creatinine had been measured in serum using kits from Roche (Roche Diagnostics, Mannheim, Germany) on BS-400 Mindray Chemistry analyzer. HbA1c had been estimated by High Performance Liquid Chromatography on Bio-Rad D-10 system using kits from Bio-Rad (Bio-Rad Laboratories Inc., Hercules, CA, USA). These analytical procedures had been standardized and conducted routinely in the clinical laboratory of the hospital. TG/HDL-C ratio was calculated as a surrogate marker for the presence of sdLDL. Estimated glomerular filtration rate (eGFR) was calculated from serum creatinine values for the study subjects using Chronic Kidney Disease Epidemiology Collaboration (CKD-EPI) equation, traceable to isotope dilution mass spectrometry.
Statistical analysis
Data was analyzed using SPSS version 16.0 (SPSS Inc., Chicago, IL, USA). The categorical variables were represented as percentages and measurable variables as mean±standard deviation. Chi-square test was performed for comparing categorical variables, t-test was done to compare the continuous variables between the two groups and a P≤0.05 was considered to be statistically significant. Mann-Whitney U test was conducted for continuous variables with high standard deviations and P≤0.05 was considered to be statistically significant here also. Pearson correlation analysis was done to find out the association between lipid parameters and indicators of kidney function. Multiple regression analysis was done to identify the factors independently associated with eGFR.
RESULTS
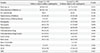
The mean age was 54.28±9.26 and 55.72±10.33 years and mean duration of diabetes was 10.76±7.61 and 12.27±7.04 for controls and nephropathy subjects, respectively. The male:female ratio was 70:22 and 61:28 respectively for these groups. Approximately 50% (n=97) of the subjects in the study had a positive family history of diabetes among their first degree relatives. Among group two subjects, 8.99% (n=8) had a positive family history of kidney disease, compared to 5.43% (n=5) among group 1. The percentage of subjects whose family history of kidney disease could not be ascertained from case sheets was 6.52% (n=6) in group 1 and 12.36% (n=11) in group 2. The prevalence of neuropathy, a diabetes related complication was higher among nephropathy patients compared to controls (P=0.05). But the prevalence of hypertension and retinopathy were not significantly different between the two groups (P=0.499 and P=0.185 respectively) (Table 1).
Among the total study participants, 67.96% (n=123) were on oral hypoglycemic agents, 23.2% (n=42) were on a combination therapy of insulin and oral hypoglycemic agents and 8.84% (n=16) were exclusively on insulin. On comparing the two groups, it was observed that the percentage of subjects on oral hypoglycemic agents or oral hypoglycemic agents+insulin or insulin alone were not significantly different between the two groups (P=0.588, P=0.537, and P=0.389 respectively) (Table 1). Among the total study participants, 42.54% (n=77) were on statins alone, 4.42% (n=8) were on a combination of statin and fibrate and 0.55% (n=1) were on statin+ezetimibe therapy. When the two groups were compared, the percentage of statin users were found to be significantly higher among subjects with nephropathy (31.52% vs. 53.93% [n=29 vs. n=48], P=0.0001). The percentage of subjects on angiotensin converting enzyme inhibitors (ACEi) or angiotensin II receptor blockers (ARB) did not differ significantly between the non-nephropathy and nephropathy groups (ACEi: 42.39% vs. 41.57% [n=39 vs. n=37], P=1.0; ARB: 6.52% vs. 12.36% [n=6 vs. n=11], P=0.491) (Table 1).
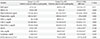
The results of anthropometric and biochemical assessments of the two groups of subjects are given in Table 2. BMI did not differ significantly between the two groups (P=0.15). TC was significantly higher for group with diabetic nephropathy (P<0.001), so was TG and LDL-C (P=0.016 and P=0.002, respectively). Serum urea was higher among nephropathy subjects (P=0.067). Though serum creatinine was not significantly different, mean eGFR value was significantly lower among nephropathy patients (P=0.002) (Table 2).
The percentage of subjects with one or other form of dyslipidemia (TC ≥200 mg/dL or TG ≥150 mg/dL or HDL-C ≤35 mg/dL [for men] and ≤40 mg/dL [for women] or LDL-C ≥100 mg/dL or a combination of these conditions) was 56.52% (n=52) among non-nephropathy group and 75.28% (n=67) among nephropathy group (P=0.012). The percentage of subjects with atherogenic dyslipidemia was 14.13% (n=13) among controls and 14.61% (n=13) among nephropathy subjects. Atherogenic dyslipidemia in this study is defined as TG ≥150 mg/dL+HDL-C ≤35 mg/dL (for men) and ≤40 mg/dL (for women)+TG/HDL-C ratio ≥3. Higher TG/HDL-C ratio (≥3), which is used as a surrogate marker for sdLDL was found among 70.33% (n=65) of non-nephropathy group and 75.28% (n=67) of nephropathy group (Table 3).
The percentage of subjects with dyslipidemia was lower among statin users compared to those not on statin therapy in the nephropathy group (38.46% vs. 64.86% [n=20/52 vs. n=24/37], P=0.014). On the contrary, the percentage of subjects with dyslipidemia did not differ significantly between statin and non-statin subgroups in the control group (32.35% vs. 36.21% [n=11/34 vs. n=21/58], P=0.59). The occurrence of dyslipidemia did not differ when subjects on ACEi or ARB were compared to those not on ACEi or ARB in both groups (53.33% vs. 48.94% [n=24/45 vs. n=23/47], P=0.673 for controls; 62.5% vs. 58.54% [n=30/48 vs. n=24/41], P=0.703 for nephropathy group).
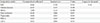
TC, TG, LDL-C, and sdLDL were found to have mild positive correlation with serum urea (r=0.276, r=0.241, r=0.248, and r=0.326, respectively) and serum creatinine (r=0.287, r=0.239, r=0.26, and r=0.226, respectively) and inverse correlation with eGFR (r=−0.29, r=−0.236, r=−0.255, and r=−0.198, respectively). Multiple regression analysis was conducted by considering eGFR, an established indicator for nephropathy as dependent variable and TC, TG, HDL-C, LDL-C, BMI, duration of diabetes, and HbA1c as independent variables. eGFR was identified as the dependent variable as some patients may demonstrate “non-proteinuric diabetic nephropathy.” It was found that TC (P=0.007) and HDL-C (P=0.06) were associated with eGFR among the study subjects (Table 4).
DISCUSSION
According to Kidney Disease: Improving Global Outcomes (KDIGO) clinical practice guidelines for lipid management in chronic kidney disease, adults with recently identified kidney disease should be evaluated for dyslipidemia, as this condition, though not universal, is commonly present among people with nephropathy [11]. The percentage of subjects with dyslipidemia was significantly higher in nephropathy group in this study. Proteinuria, which is the hallmark of diabetic nephropathy, causes an increase in LDL-C fraction, whereas in advanced renal dysfunction, a reduction of HDL-C levels is also noted [12]. Post hoc analysis of large scale trials such as the Diabetes Control and Complications Trial (DCCT) revealed that albuminuria is associated with higher levels of TC, TG, and LDL-C [13]. The results of our study show that TC, TG, and LDL-C levels were significantly higher among the nephropathy patients. A study among related South Indian population has also shown that TC, TG, HDL-C, and LDL-C were significantly different between diabetic and diabetic nephropathy patients [14]. A study conducted even in a different ethnic population has observed results similar to the present study [15]. Another study showed that dyslipidemia associated with diabetic nephropathy is not limited to T2DM subjects, but is present among type 1 patients as well [16]. The mean HbA1c% of the subjects of both groups in our study highlights their poor glycemic status (9.54±1.86 and 9.4±2.4 for controls and nephropathy subjects, respectively). Since sustained hyperglycemia has profound effects on lipid metabolism, dyslipidemia among subjects of this study might be related to their poor glycemic control also.
The percentage of subjects with sdLDL, indicated by TG/HDL-C ratio, was high among both groups in this study population, though the percentage did not differ significantly between the two groups. On the contrary, a study among diabetic Japanese subjects had shown that LDL particle size was significantly lower in nephropathy patients compared to subjects without nephropathy [17]. Atherogenic dyslipidemia, i.e., co-existence of high TG, low HDL-C and presence of sdLDL particles was found among approximately 14% of subjects of both groups. The presence of atherogenic dyslipidemia or sdLDL particles could increase their risk for adverse cardiac events. The correlation between lipid parameters and kidney function parameters in the current study implies that dyslipidemia is associated with renal insufficiency in this population. Various prospective studies have shown that there is significant correlation between renal outcome and dyslipidemia [18]. Therapeutic intervention using statins to reduce cholesterol level has been recognized to reduce the risk for adverse cardiovascular events among subjects with kidney disease [19]. There are data available which show that the treatment of dyslipidemia with statins can improve renal outcomes, though this is not proven conclusively [11]. Though subjects on statin therapy had lower incidence of dyslipidemia compared to non-statin subjects in the nephropathy group in the present study, the occurrence of dyslipidemia even among statin users in both groups is a major cause of concern. This could indicate the need for a more aggressive hypocholesterolemic therapy among them to attain favorable cardiac as well as renal outcomes.
Among lipid parameters, TC and HDL-C were observed to be associated with nephropathy in this study. Previous studies have shown that TC level was associated with a higher risk of mortality in patients with chronic renal failure [2021]. Chen et al. [22] in a more recent large-scale study among 3,303 patients with chronic kidney disease stages 3 to 5, observed that the association between TC and mortality is different among patients with different levels of proteinuria. Though Pearson correlation analysis did not demonstrate any significant correlation between HDL-C and eGFR, HDL-C was identified to be associated with declining eGFR in our study, on regression analysis. A community-based, cross sectional survey concluded that HDL-C is independently associated with eGFR after adjustment for multiple covariates in the general population [23]. Physicians Health Study had demonstrated that the risk for deterioration of renal function was significant among subjects with elevated cholesterol or low HDL-C, even at mildly elevated serum creatinine values [24]. It should be noted that small number of patients, unadjusted clinical parameters, and retrospective study method might have influenced the results of regression analysis in the present study.
While assessing for associated microvascular complications, it was found that the prevalence of neuropathy was significantly higher among patients with nephropathy in this study. The co-existence of microvascular complications in Indian population has been identified by an earlier study [25]. United Kingdom Prospective Diabetes Study (UKPDS) showed that proper glycemic control can significantly reduce the incidence of these complications [26]. It should be noted that the prevalence of hypertension was also high among the subjects of this study. Rigorous control of blood pressure is shown to have beneficial effects on reducing the incidence or progression of microvascular complications [27].
Thus, the observations from this study show that nephropathy patients had poor glycemic as well as lipid control and that comorbidities such as hypertension and neuropathy were highly prevalent among them. This warrants early screening and stringent therapeutic intervention for optimal regulation of these conditions among them.
Despite being a retrospective analysis of small sample size, the study has been able to obtain useful data on the prevalence of dyslipidemia among diabetic nephropathy patients. Though the role of therapeutic intervention such as statin treatment in the regulation of blood cholesterol is undisputed, prospective studies are needed to inconclusively prove their effect in reducing mortality due to cardiovascular events among nephropathy patients.
In conclusion, our study results indicate that dyslipidemia was highly prevalent among diabetic subjects of this population, more so among nephropathy patients. Furthermore, the preponderance of sdLDL particles observed in this population amplifies their risk for future cardiovascular events. Stringent regulation of dyslipidemia and dysglycemia could be an effective strategy in reducing the risk of renal or cardiovascular events, as accepted universally.

 XML Download