

 PDF
PDF ePub
ePub Citation
 Print
Print


INTRODUCTION
Cystatin C, a cysteine protease inhibitor, is freely filtered by the renal glomeruli and metabolized by the proximal tubule [1]. It has been known to be a promising marker of kidney function that predicts renal function decline earlier than serum creatinine levels [2]. Furthermore, some studies have demonstrated that elevated levels of serum cystatin C are associated not only with early renal impairment in diabetes [3456] but also with obesity, atherosclerosis, insulin resistance, and hypertension [78910], which have a close relationship with the pathogenesis of cardiometabolic disorder.
Regarding the association between cystatin C and the incidence of diabetes, Donahue et al. [11] showed that serum cystatin C is associated with the risk of progression from normoglycaemia to prediabetes in Western New York Health Study participants and Sahakyan et al. [12] reported an association between elevated cystatin C levels and diabetes in a large sample of white adults in the US. Another study by Sabanayagam et al. [13] showed that elevated levels of serum cystatin C are associated with prediabetes in a nationally representative sample of non-obese United States adults. However, all of these studies were conducted in Western populations and it is not clear whether cystatin C levels are associated with diabetic conditions (prediabetes plus diabetes) consistently in all race and ethnic groups.
The glycosylated hemoglobin (HbA1c, A1c) is a test of glucose control over the relatively long term period of 2 to 3 months. The aim of this study is to evaluate the association between serum cystatin C and HbA1c test results, a clinical representative of diabetic conditions, and the usefulness of serum cystatin C in predicting the prevalence of diabetes according to the ranges of HbA1c in Korean adults.
METHODS
Subjects
We analyzed data from 1,896 adults aged ≥20 years with available serum cystatin C and HbA1c measurements who participated in a comprehensive health examination at Pusan National University Yangsan Hospital in Yangsan, Korea in 2013. Of the subjects, we excluded those aged >70 years (n=93), those with liver disease (serum levels of aspartate aminotransferase [AST] or alanine aminotransferase [ALT] were greater than three times the upper limit of the reference range; n=9), abnormal serum thyroid stimulating hormone (TSH) levels (TSH <0.27 or >4.2 µIU/mL; n=178), abnormal serum creatinine levels (male ≥1.5 mg/dL, female ≥1.3 mg/dL; n=54), or elevated high sensitivity C-reactive protein (hs-CRP) levels (>10.0 mg/L; n=3). Finally, 1,559 adults (937 men and 622 women) were enrolled in the study.
Informed consent for the use of the health screening data for research was obtained from the subjects. The design and the protocol of this study were reviewed and approved by the Institutional Review Board of Pusan National University Yangsan Hospital and are in accordance with the Helsinki Declaration of 1975 (IRB No. 05-2015-002).
Anthropometric and biochemical data
Height and weight were measured while the subjects wore light clothing without shoes. Body mass index (BMI) was calculated as weight in kilograms divided by height in meters squared. Waist circumference was measured with a soft tape on standing subjects midway between the lowest rib and the iliac crest. Blood pressure was measured on the right arm with subjects in a seated position after a 5-minute rest. Blood specimens were sampled from the antecubital vein after an overnight fast. Fasting blood glucose was measured by the glucose oxidase method (Synchron LX-20; Beckman Coulter Inc., Fullerton, CA, USA). Concentrations of standard liver enzyme, total cholesterol, high density lipoprotein cholesterol (HDL-C), serum triglyceride (TG), and gamma-glutamyltransferase (GGT) were measured using an autoanalyzer and the enzymatic colorimetric method (Hitachi 7600; Hitachi Ltd., Tokyo, Japan). The serum cystatin C was analyzed using an immunoturbidimetric assay (TBA-200FR NEO; Toshiba, Tokyo, Japan).
The HbA1c was measured using high performance liquid chromatography (Varian II Turbo; Bio-Rad Laboratories, Hercules, CA, USA). The homeostasis model assessment of insulin resistance (HOMA-IR) index was calculated using the following formula: HOMA-IR=[fasting serum insulin (mU/L)×fasting plasma glucose (mmol/L)]/22.5.
Based on the recent American Diabetes Association recommendation [14], subjects with HbA1c levels within the range of 5.7% to 6.4% were categorized in the prediabetes group, those with levels more than 6.5% were categorized in the diabetes group, and those with levels less than 5.7% were categorized in the normal glucose group.
Statistical analysis
All data are presented as the mean±standard deviation for continuous variables. The median values are also indicated in the cases of TG, GGT, and hs-CRP, which have skewed distributions. The subjects were divided into three groups according to their HbA1c levels: the normal glucose group, the prediabetes group, and the diabetes group. In addition, the subjects were divided into five groups based on the distribution of serum cystatin C (first <0.8 mg/L, second 0.8 mg/L, third 0.9 mg/L, fourth 1.0 mg/L, and fifth >1.0 mg/L). The categorical variables were compared using the chi-square test. The mean (plus the median for TG, GGT, and hs-CRP) levels of continuous variables were compared using one-way analysis of variance analysis followed by post hoc testing using the S-N-K test (the Kruskal-Wallis test and Dunn's multiple comparison test for TG, GGT, and hs-CRP levels). The bivariate correlation analyses between serum cystatin C and HbA1c were performed using Pearson correlation analysis.
Finally, the odds ratios (ORs) and corresponding 95% confidence interval (CI) of the group with the highest serum cystatin C levels (fifth) were calculated as an estimate of the relative risk of diabetic conditions compared to the lowest group (first) used as the reference category. The multiple logistic regression analyses consisted of the non-adjusted model, the age and sex adjusted model (age adjusted for each gender), and the multivariable model (additionally adjusting for BMI, total cholesterol, and systolic blood pressure). The statistical analyses were performed with SPSS version 18.0 (SPSS Inc., Chicago, IL, USA). A probability value of less than 0.05 was considered significant.
RESULTS
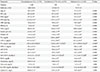
The mean serum cystatin C level was 0.92±0.13 mg/L in men and 0.84±0.13 mg/L in women. Prediabetes was diagnosed in 210 men (13.5%) and 129 women (8.3%). Diabetes was diagnosed in 79 men (5.1%) and 32 women (2.1%). Subjects with prediabetes and diabetes were more likely to be older; had a larger waist circumference; had higher BMI, blood pressure, TG, AST, ALT, GGT, and hs-CRP levels; exhibited insulin resistance; and had lower values of HDL-C. The serum cystatin C levels in subjects with prediabetes and diabetes were also significantly increased compared to those of subjects with normal glucose (0.91±0.14 mg/L in prediabetes and 0.91±0.17 mg/L in diabetes vs. 0.88±0.13 mg/L in patients with normal glucose levels, P=0.001) (Table 1).
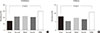
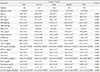
With an increase in the serum cystatin C levels, the values of age, waist circumference, BMI, blood pressure, HOMA-IR, total cholesterol, TG, AST, ALT, GGT, uric acid, and hs-CRP were significantly increased. The HDL-C level was significantly deceased with an increase in the serum cystatin C levels (Table 2). With an increase in the serum cystatin C levels, the prevalence of subjects with prediabetes (first 14.6%, second 21.5%, third 22.4%, fourth 20.9%, and fifth 30.2%) (Fig. 1A) and those with diabetes (first 8.0%, second 5.3%, third 7.2%, fourth 6.5%, and fifth 10.6%) (Fig. 1B) showed increasing trends and were significantly increased in the group with the highest serum cystatin C levels (fifth >1.0 mg/L) compared to the group with the lowest serum cystatin C levels (first <0.8 mg/L).
In the bivariate correlation analysis between serum cystatin C and HbA1c, serum cystatin C had significant but weak positive correlations with HbA1c in total subjects (r=0.052, P= 0.031) and in women (r=0.126, P=0.001) (Fig. 2).
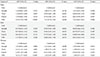
The relative risk of subjects in the group with the highest serum cystatin C levels (fifth >1.0 mg/L) for the presence of diabetic conditions compared to those with the lowest serum cystatin C levels (first <0.8 mg/L) was significantly increased in the non-adjusted model (OR, 2.35; 95% CI, 1.54 to 3.58; P<0.001). However, this increased OR was attenuated and not significant in the age- and sex-adjusted model (OR, 1.21; 95% CI, 0.76 to 1.92) and the multivariable model (OR, 1.01; 95% CI, 0.62 to 1.63) (Table 3).
When stratified by gender, there was no significant increase in the relative risk of subjects in the group with the highest cystatin C levels compared to those with the lowest cystatin C levels in all logistic regression models in men. However, in women, there was a significant OR increase in the non-adjusted model (OR, 4.13; 95% CI, 1.97 to 8.65; P<0.001), although it was attenuated and not significant in both the age-adjusted (OR, 1.32; 95% CI, 0.58 to 3.00) and the multivariable model (OR, 1.10; 95% CI, 0.47 to 2.57).
DISCUSSION
In this study, we demonstrated that serum cystatin C levels are significantly increased in subjects with diabetic conditions compared to those with normal glucose levels according to the HbA1c range in Korean adults. Furthermore, higher levels of serum cystatin C were significantly associated with an increased prevalence of diabetic conditions. There have been several studies that have shown that cystatin C could be an early and better marker in estimating renal function in diabetes or diabetic nephropathy [3456]. However, to the best of our knowledge, our findings were the first data from an Asian population to be used to assess the association between serum cystatin C levels and the prevalence of diabetic conditions. Our study is consistent with some previous studies that have reported an association between cystatin C levels and diabetic conditions, which were performed in predominantly white populations [111213].
In this study, the significantly increased relative risks of the group with the highest serum cystatin C levels for the prevalence of diabetic conditions in the total subjects and women were attenuated and not significant in both the age- and sex-adjusted and the multivariable (additionally adjusted for BMI, blood pressure, and cholesterol) models. According to the study by Sabanayagam et al. [13], the positive association between cystatin C and prediabetes was significant among non-Hispanic whites, whereas the association was not significant among other races and ethnicities in both the age- and sex-adjusted and the multivariable models. This finding provides a possible explanation for our results, suggesting that the positive association of cystatin C with diabetic conditions may be weaker in Asian populations compared to white populations although the possible existence of the ethnic differences in this association is not fully elucidated.
Several possible mechanisms may explain the positive relationship between cystatin C and the incidence of diabetic conditions. First, cystatin C has been known to have a close relationship with the multiple risk factors of diabetes such as obesity [810], insulin resistance [15], chronic inflammation [1617], endothelial dysfunction [18], and metabolic syndrome [79]. Second, cystatin C has been shown to be not only a better and more specific marker of renal function than serum creatinine but also might play a role beyond renal function such as unforeseen toxic effects, which may contribute to predicting cardiovascular disease better than creatinine [1920].
In a previous study [13], the association between cystatin C and prediabetes was stronger in women compared to men, and we also found that the relative risk of the group with the highest serum cystatin C levels for the prevalence of diabetic conditions compared to the group with the lowest levels was increased in Korean women. There were several reports that suggest possible explanations for this gender difference. One study demonstrated that women who progressed from normoglycemia to prediabetes have greater endothelial dysfunction and fibrinolysis than men [21], and another study showed that the elevated levels of C-reactive protein, a powerful inflammatory marker of diabetes, are associated with an increased risk of type 2 diabetes, which is stronger in women than in men [22].
Our study has some limitations. First, it was conducted using a cross sectional design and thus did not identify a causal relationship. Second, the total number of enrolled subjects was relatively small. Therefore, the small number of diabetic conditions, especially subjects with diabetes, may have affected our results that showed no significant difference in the serum cystatin C levels between subjects with prediabetes and those with diabetes, and a significant but weak correlation between serum cystatin C and HbA1c. Third, because the oral glucose tolerance test was not included in the medical checkup program, we used HbA1c levels alone for the definition of prediabetes and diabetes. Fourth, we could not analyze social data such as a history of exercise, diet, and smoking status, and medication use for previously diagnosed hypertension and/or hyperlipidemia, which could affect the prevalence of diabetic conditions. Fifth, there might be a possibility that known diabetic patients who have used oral hypoglycemic agents and/or insulin were classified in the normal glucose or prediabetes groups. However, current blood glucose control reflected by the HbA1c test may be meaningful in the evaluation of the association with serum cystatin C.
In conclusion, our study demonstrated that serum cystatin C levels were significantly increased in subjects with diabetic conditions compared to in those with normal glucose levels defined by HbA1c levels, a useful clinical test for the assessment of long term glucose control, in Korean adults. Furthermore, higher levels of serum cystatin C were associated with an increased prevalence of diabetic conditions. Our findings may be the first to describe this association in an Asian population and to extend the positive association between cystatin C and the incidence of diabetes to Asian as well as white populations.

 XML Download