

 PDF
PDF ePub
ePub Citation
 Print
Print


INTRODUCTION
The management of blood glucose levels is indispensable in delaying or preventing the onset of complications in the patients with diabetes mellitus. In general, patients with impaired glucose tolerance or postprandial hyperglycemia are recognized to have a higher risk of developing diabetes than those with normal glucose tolerance [1]. There are some clinical evidences that treating postprandial hyperglycemia [2] could delay the onset of diabetes or prevent complications [3]. Therefore, from the early stage of glucose intolerance, the management of patients focusing to postprandial hyperglycemia could be beneficial for the long-term outcome of glycemic control.
Glycosylated hemoglobin (HbA1c) is a widely approved and used index for glycemic control, reflecting the average blood glucose levels over the last 2 to 3 months. Although it is an important index of treatment compliance and response [45], it may not be sufficient for specific monitoring of postprandial fluctuating glycemic excursions.
Recently, continuous glucose monitoring (CGM) has made it possible to observe blood glucose profiles, providing a new option for monitoring and treating diabetes. However, CGM requires blood sampling for calibration and can be applied to a limited number of patients because it costs time and money. Thus, a convenient method capable of specific monitoring of postprandial hyperglycemia could overcome the shortcomings of existing indices and systems.
We have developed a novel system to measure glucose area under the curve (AUC) using minimally invasive interstitial fluid extraction technology (MIET) [67]. This easy-to-use system requires no blood sampling and is expected to provide simple and convenient monitoring for glycemic excursion. Previously, we reported that this system can measure glucose AUC regardless of glucose tolerance [8] and that AUC measured by this system is useful for screening patients with glucose intolerance [9]. Further, the reported good performance of a system based on interstitial fluid (ISF) collection by passive diffusion, symphony CGM [10], indicates that the concept of our monitoring system that extracting ISF by passive diffusion for a defined period and estimating glucose AUC from accumulated glucose level is reasonable. Moreover, our system showed possibility to provide glycemic indices for some confectionery [11], which are supposed to closely represent the daily situation. However, in daily life, patients may need to monitor blood glucose increases not only after a single meal but also after every meal. Therefore, it would be beneficial to know the blood glucose status for the longer periods of time in a day and the more frequent measurements in several meals for the accurate evaluation of clinical glycemic control.
In the present study, we evaluated the relationship of AUC measurement up to 8 hours in this system in reference to CGM. Moreover, the accuracy of AUC measurement between consecutive 2-hour measurement, consecutive 4-hour measurement, and repetitive 2-hour measurement were compared.
METHODS
Subjects
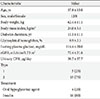
Twenty inpatients with diabetes undergoing CGM (CGMS-Gold; Medtronic, Minneapolis, MN, USA) for the purpose of treatment response monitoring were enrolled. The baseline clinical characteristics of the patients are shown in Table 1. The study was conducted following the latest version of the Declaration of Helsinki and the study protocol was approved by the Ethics Committee of Shiga University of Medical Science (Shiga, Japan), and all participants provided written informed consent for study participation.
Clinical evaluation protocol
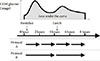
Fifteen patients were recruited to protocol A, and the other five patients were recruited to protocol B (Fig. 1).
For MIET measurement, ISF was collected from the skin of the forearm. The collection site was wiped with an antiseptic, and microneedle arrays were then stamped at two sites using a microneedle applicator. Two hydrogel patches were placed on each pretreated area to absorb ISF, and a third hydrogel patch was placed on an untreated area for sweat monitoring. After 2 (protocol A) or 4 (protocol B) hours, all patches were replaced with new ones. After 4 (protocol A) or 2 (protocol B) cycles, all patches were collected to analyze ISF composition. As previously reported [6], MIET uses Na+ collected simultaneously with glucose in hydrogels as an internal standard. Since Na+ levels in ISF are supposed to be constant inter- and intraindividual, calibration can be completed without blood glucose levels.
Immediately after ISF extraction, patients were requested to complete a questionnaire and provide feedback on the system.
Apparatus and materials
Details of the apparatus have been described in our earlier reports [912]. In summary, polycarbonate microneedle arrays and an applicator for stamping were used for pretreatment and a hydrogel patch comprising a polyvinyl alcohol hydrogel and an adhesive tape were used for ISF collection. The reagent for glucose analysis was composed of glucose oxidase (GOD), mutarotase, peroxidase, ascorbic acid oxidase, and fluorescent dye (Amplex Red; ThermoFisher, Yokohama, Japan).
Procedures for glucose and sodium ion analyses
A detailed description of our procedures has been provided in our earlier reports [69]. Briefly, the hydrogel was separated from the adhesive tape and immersed into pure water to extract glucose and sodium. The glucose level was measured using the GOD method, and sodium ion level was measured using ion chromatography.
Data analysis methods
Reference CGM-AUCs were calculated by trapezoidal approximation of glucose levels that were measured every 5 minutes. The CGM value at x minutes was termed as glucose (x), and the reference CGM-AUC for 2 hours was calculated as follows:
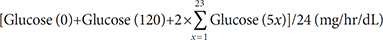
The reference CGM-AUC for 4 hours can be calculated similarly.
Details and principles of data analysis for calculating MIET-AUC have been previously described [6].
RESULTS
Performance of AUC measurement by MIET
Originally, 20 patients were enrolled and expected total samples were 120 samples. However, two patients were excluded from the performance analysis because of mechanical problems with CGMS-Gold. Another patient interrupted CGM during the evaluation, and only the data recorded before the interruption were used for analysis. Total samples excluding these problems were 108. Moreover, samples with errors of MIET (sodium ion extraction rate at intact area >0.04 nmol/hr as influence of sweat contamination (12 samples, 11.1%) or glucose permeability <2 cm/hr as too small extracted volume for correct measurement (18 samples, 16.7%) or samples with large dissociation of blood glucose levels between self-monitoring blood glucose for calibration and CGM (approximately 70 mg/dL) were excluded from analysis (2 samples, 1.9%). Finally, 76 samples were used for analysis.
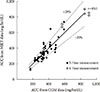
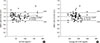
Fig. 2 shows typical data of the blood glucose profile and our AUC measurement. Fig. 3 shows the correlation between AUC estimated by MIET (MIET-AUC) and that calculated from CGM profiles (CGM-AUC). MIET-AUC correlated well with CGM-AUC, regardless of the extraction time of ISF (r=0.93). This correlation corresponded with the previous result when CGM-AUC was substituted with plasma glucose AUC [9].
Comparison of extraction time between 2 and 4 hours
The discrepancy between MIET-AUC and CGM-AUC among extraction conditions was examined. Consecutive 2-hour extraction showed 11.7%±10.2% of variance and consecutive 4-hour extraction showed 11.1%±7.9% of variance (not significant) between MIET-AUC and CGM-AUC. Previous data [8] showed 9.4%±6.8% of variance between MIET-AUC and plasma glucose AUC for the 2-hour extraction after oral glucose tolerance test. These data suggest nearly equivalent performance of the 2- and 4-hour extraction.
Performance of MIET in repetitive measurements
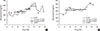
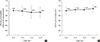
In our system, micropores formed before ISF extraction may contract over time, and this could affect the performance in repetitive measurements. In this regard, Fig. 4A shows the time-dependent change of glucose permeability in the collected ISF. The ISF was collected constantly up to 8 hours, and no significant time-dependent change was observed with regard to MIET performance (Fig. 4B). No statistically significant differences were observed between each period; thus, the accuracy of repetitive extraction up to 8 hours was confirmed.
Possible factors affecting the performance of MIET
Fig. 5 shows the influence of glucose profiles on MIET performance. One concern was that the wide fluctuation of glucose levels might degrade the performance of our system because of the time lag with ISF extraction. Moreover, the suitability of our system to wide range of glucose levels from diabetes patients was examined. Neither glucose fluctuation (Fig. 5A) nor average glucose level (Fig. 5B) affected glucose AUC measured by MIET. These results indicate that the performance of our system was minimally influenced by patient glucose profiles.
Questionnaire for patients
Fig. 6 shows the results of a questionnaire for patients, confirming the painless nature of MIET. However, two patients felt uncomfortable when hydrogel patches were attached. This discomfort was described as itching in one case and a vague discomfort in the other.
DISCUSSION
The results of the present study suggest that our system can be applicable to the measurement of glucose AUC up to 8 hours in the comparable accuracy and less invasiveness to the conventional methodologies.
Adequacy of the length of measurement period
The peak time of plasma glucose is known to vary depending on various factors, such as meal content, eating speed, and glucose tolerance. However, in most cases, peak time exists between 30 minutes and 3 hours after meals. Therefore, 4-hour consecutive samples are supposed to cover the full amplitude of glucose fluctuation after meals, and the results of this study indicate that the MIET system can represent postprandial glucose AUC in a wide variety of situations.
Differences between CGM and MIET
Both CGM and MIET measure glucose levels of the ISF; however, there are some technical differences between these two systems in glucose sensing. As widely known, sensors for CGM are subcutaneously inserted and directly measure glucose levels of ISF. In contrast, MIET extracts ISF to the body surface. Because the microneedles used for MIET pierce to a depth of approximately 100 µm, the ISF near skin surface could be easily extracted. Therefore, CGM and MIET might reflect glucose levels of ISF from different depths, which can provide different glucose levels between the two systems.
In addition, sensors for CGM are usually inserted over the abdomen, whereas MIET extracts ISF from the forearm. Considering that changes related to a site difference for blood glucose have been reported [13], this difference may result in different measurements between the two systems.
Regarding the first point, in most cases that MIET-AUC was rather far below CGM-AUC, glycemic profiles by CGM showed relatively rapid elevation while opposite cases had a tendency of rapid decrease. As mentioned above, CGM is supposed to measure deeper ISF from skin and closer to blood vessel compared with MIET, which may contribute to some extent. However, this tendency was not true in all cases; therefore, other differences such as the second point or calibration method, seemed to contribute to the results. We need more detailed and rigorous study to clarify the relationship between the accuracy of our system and the change rate of blood glucose levels, which is a subject for future study.
Application of the MIET system
This study indicated that the MIET system could reflect post-prandial glucose profiles up to 8 hours. Existing indices, such as HbA1c values, reflect average blood glucose levels for 1 to 2 months before blood sampling. In contrast, in our system, merely an adjustment of the application time of gel patch would provide AUC for a designated period. In this study, our system could reflect postprandial states following two meals, and this valuable period for clinical practice should be examined in future studies.
Glucose profiles provided by CGM are useful for diabetes management; however, CGM is applicable to a limited number of patients because it costs time and money. Blood sampling for calibration places stress on patients, and some patients feel uncomfortable about the use of an indwelling sensor. Utilizing the complete information provided by CGM in daily self-management can be difficult for patients without medical knowledge because it contains a lot of indices. In contrast, MIET allows convenient monitoring of glucose excursion by providing a simple index, glucose AUC, without blood sampling. Therefore, MIET can be applicable to patients from relatively early-stage diabetes for daily management of blood glucose. On the other hand, there are some situations in which MIET might not be fully beneficial, such as detection of hypoglycemia. In these cases, CGM could be effective, and thus, MIET and CGM may be complementary each other.
Study limitations
As this study was a feasibility study, the sample size was limited. A larger sample size is required to validate the relationship between MIET and CGM in AUC measurement. In addition, CGM has some measurement error compared with plasma glucose levels and thorough evaluation of CGM accuracy is required in parallel. Moreover, although the possibility of measurement up to 8 hours using MIET was suggested, each period of AUC measurement was 2 or 4 hours. Therefore, the device should be tested in future studies for longer durations, such as consecutively for 8 hours.
In conclusion, the results of the present study suggest that MIET can provide simple AUC measurements with comparable accuracy to CGM for up to 8 hours, indicating that a large part of the daytime glucose excursion can be covered by our system.

 XML Download