Journal List > Diabetes Metab J > v.40(4) > 1084895

Kang, Kim, Jeong, and Park: Dietary Sodium Intake in People with Diabetes in Korea: The Korean National Health and Nutrition Examination Survey for 2008 to 2010

Abstract

Background

Diabetics are likely to receive advice from their physicians concerning lifestyle changes. To understand how much sodium is consumed by diabetics in Korea, we compared the average daily sodium intake between diabetics and non-diabetics after controlling for confounding factors.

Methods

We obtained the sodium intake data for 13,957 individuals who participated in the Korean National Health and Nutrition Examination Survey (KNHANES), 2008 to 2010, which consisted of a health interview and behavioral and nutritional surveys. The KNHANES uses a stratified, multistage, probability-sampling design, and weighting adjustments were conducted to represent the entire population.

Results

Our analysis revealed that, overall, diabetics tended to have lower sodium intake (4,910.2 mg) than healthy individuals (5,188.2 mg). However, both diabetic and healthy individuals reported higher sodium intake than is recommended by the World Health Organization (WHO). Stratified subgroup analyses revealed that the sodium intake (4,314.2 mg) among newly diagnosed diabetics was higher among women when compared to patients with known diabetes (3,812.5 mg, P=0.035). Female diabetics with cardiovascular disease had lower average sodium intake compared to those without cardiovascular disease after adjusting for sex, age, body mass index, and total energy intake (P=0.058). Sodium intake among male diabetics with hypercholesterolemia (P=0.011) and female diabetics with hypertriglyceridemia (P=0.067) tended to be higher than that among those who without dyslipidemia.

Conclusion

The average sodium intake of diabetics in Korea was higher than the WHO recommends. Sodium intake in newly diagnosed diabetics was significantly higher than that in non-diabetics and previously diagnosed diabetics among females. Prospective studies are needed to identify the exact sodium intake.

INTRODUCTION

Many studies have investigated sodium intake in non-diabetic patients. Higher sodium intake is associated with higher blood pressure [1], whereas lower sodium intake can reduce blood pressure in hypertensive patients [2345]. The likelihood of developing type 2 diabetes mellitus (T2DM) is almost 2.5 times higher in persons with hypertension (HTN) than in normotensive individuals [6]. However, research investigating the potential association between diabetes and sodium intake are rare. According to the meta-analysis by Suckling et al. [7], reduced sodium intake leads to lower blood pressure in type 1 diabetes mellitus (T1DM) and T2DM. Uzu et al. [8] revealed that higher sodium intake was associated with masked HTN in patients with T2DM. On the other hand, in a cohort study about sodium intake and mortality in T2DM, lower 24-hour urinary sodium excretion was, paradoxically, associated with increased all-cause and cardiovascular mortality [9].
In Korea, there have been no standardized epidemiological studies on nationwide sodium intake to date. Using data from the Korean National Health and Nutrition Examination Survey (KNHANES, 2008 to 2010), we investigated sodium intake in Korea and the characteristics associated with sodium intake in patients with T2DM.

METHODS

Study population

The data analyzed in this study were obtained from the KNHANES IV and V (2008 to 2010). In total, 29,235 people participated in this study. We analyzed the data from male and female subjects who were more than 30 years of age. Participants who did not have data regarding their diet, demographic characteristics, and laboratory, and/or physical characteristics were excluded. People without data regarding the treatment of their HTN, diabetes mellitus (DM), hyperlipidemia, and/or medication history were also excluded. In addition, pregnant women and people whose total energy intake was less than 500 kcal or greater than 5,000 kcal were excluded, as were patients with diabetes whose glycosylated hemoglobin (HbA1c) was not recorded. After applying the exclusion criteria, 13,957 participants were enrolled.

Diagnosis of DM

It was impossible to distinguish T1DM and T2DM in the KNHANES dataset. DM is diagnosed by the American Diabetes Association (ADA), Korean Diabetes Association, and KNHANES criteria (fasting blood sugar ≥126 mg/dL, or patients with oral hypoglycemic agents [OHA] or insulin, or patients who were already diagnosed by a physician). The patients who were not diagnosed by a physician, but whose fasting blood glucose was over 126 mg/dL without OHA and insulin treatment, were considered as newly diagnosed diabetes.

Diagnosis of hypercholesterolemia

Participants whose fasting total cholesterol was ≥240 mg/dL or who were taking a lipid-lowering medication were considered to have hypercholesterolemia.

Diagnosis of hypertriglyceridemia

Participants whose fasting triglyceride was ≥200 mg/dL were considered to have hypertriglyceridemia.

Statistical analyses

All data are presented as mean±standard error (SE) or as prevalence (% and SE). Sampling weights were used to take the complex sampling into account, and statistical analyses were conducted using SAS version 9.3 software with the survey procedure (SAS Institute Inc., Cary, NC, USA). Because KNHANES uses a complex sample design method, we used the PROC SURVEY procedure of SAS, which uses weight, stratification variables, and cluster variables to obtain estimated results without bias. Statistical significance was defined as P<0.05.

RESULTS

Baseline characteristics of non-diabetic and diabetic patients

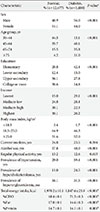
Baseline characteristics of non-diabetic and diabetic individuals are shown in Table 1. In total, there were 12,477 individuals without diabetes and 1,480 individuals with diabetes. The percentage of those that took part in smoking, drinking, and regular physical activity were similar in both groups. However, there were several notable differences. Educational attainment and income levels were lower among diabetics compared to non-diabetic individuals. The proportion of people having a body mass index (BMI) >25.0 kg/m2 was higher among diabetic patients than non-diabetic patients. The prevalence of HTN, hypercholesterolemia, and hypertriglyceridemia was also higher among patients with DM.

Sodium intake in DM and non-DM

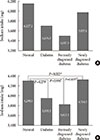
Sodium intake among patients with and without diabetes is shown in Table 2, Fig. 1. Average sodium intake per day among non-diabetic and diabetic patients was 5,188.2 and 4,910.2 mg, respectively. Among males, sodium intake was 6,127.1 mg in non-diabetics and 5,676.3 mg in diabetics. Among females, sodium intake was 4,290.5 mg in non-diabetics and 3,933.3 mg among diabetics. However, after adjusting for sex, age, BMI, and total energy intake, those with diabetes did not have significantly lower average sodium intake (P=0.868) than non-diabetics.

Sodium intake in those with known or newly diagnosed DM

The comparison of sodium intake between previously diagnosed diabetic patients and those with newly diagnosed diabetes is shown in Fig. 1. Analysis of this data reveals a trend that sodium intake among newly diagnosed diabetics is greater than those with established diagnoses. Particularly among females, this difference was statistically significant.

Sodium intake in diabetic patients with cardiovascular disease, HTN, hypercholesterolemia, and hypertriglyceridemia

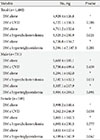
Female diabetics with cardiovascular disease (Table 3) had significantly lower average sodium intake compared to those without cardiovascular disease after adjusting for sex, age, BMI, and total energy intake (3,262 mg/day vs. 3,998 mg/day, P=0.058).
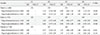
A comparison of sodium intake according to whether or not the individual had hypercholesterolemia is shown in Table 3. All subjects, males in particular, showed significant differences. After adjusting for sex, age group, education, income, BMI, smoking, alcohol use, physical activity, and total energy intake, in all subjects and particularly males, those individuals with diabetes and hypercholesterolemia had significantly higher sodium intake. A similar trend was observed among females, but was not statistically significant. A comparison of sodium intake among those with and without hypertriglyceridemia is shown in Table 3. Females with hypertriglyceridemia had higher sodium intake compared to those without hypertriglyceridemia. The resulting P value was 0.067 after adjusting for sex, age group, education, income, BMI, smoking, alcohol use, physical activity, and total energy intake. The relationships between the quartiles of sodium intake, high blood pressure, hypercholesterolemia, and HbA1c are shown in Table 4. Compared to the baseline sodium intake of the reference group (1,637 mg/day), greater baseline sodium intake was associated with an increased risk of hypercholesterolemia (3,113 mg/day: odds ratio [OR], 1.16; 95% CI, 0.74 to 1.80; 4,751 mg/day: OR, 0.99; 95% CI, 0.62 to 1.56; 9,260 mg/day: OR, 1.83; 95% CI, 1.12 to 2.97).
This trend was even more apparent among males (Table 4).

DISCUSSION

Few studies have investigated sodium intake among patients with and without diabetes in Korea. Huh et al. [10] revealed that average sodium intake estimated based on 24-hour urinary sodium excretion was 6,528.8 mg/day in male diabetic patients and 5,073.6 mg/day in female patients. Lee et al. [11] showed that sodium intake in diabetic patients aged 65 and over was 6,135.5 mg/day. Similarly, a study by Lim et al. [12] with diabetic patients aged 65 and over found that sodium intake based on 24-hour dietary recall was 4,719.6 mg/day in males and 3,461 mg/day in females. However, all of these studies are limited by the fact that their samples were very small. In our study, sodium intake among non-diabetics was greater than in diabetics (5,188.2 and 4,910.2 mg, respectively). Although this difference was not statistically significant, a trend with diabetic individuals' sodium intake being lower than that of non-diabetic individuals was observed. These findings were reported in a previous study [13] based on the National Health and Nutrition Examination Survey data in the United States. One explanation for this trend is physician recommendations regarding life-style modifications, particularly among individuals with diabetes [141516]. Almost all adults in the United States exceeded the recommended sodium intake as stated by the 2013 ADA position statement for sodium intake [17] (a total of 99.4% of United States adults consumed more than 1,500 mg/day of sodium [13]). However, adults in Korea still consume more sodium than Americans. Given the plethora of studies documenting the association between sodium intake and T2DM risk [18], cardiovascular and chronic kidney disease risk [192021222324], and links between sodium restriction and reduction in proteinuria, stroke protection, and enhancement of antihypertensive agents [1025], limiting and managing sodium intake is central to public health. Because initiatives to reduce sodium intake have been implemented by various organizations, it is necessary to determine a more accurate, healthy amount of sodium intake. KNHANES data used in this study was obtained through 24-hour dietary recall. Because this method is less accurate, considering the dietary habits of Koreans [26], there is a need to develop a more accurate method for estimating sodium intake in subsequent KNHANES surveys.
In a similar manner to sodium intake among those with and without diabetes, we speculate that those with an established diabetes diagnosis may have lower overall sodium intake than those newly diagnosed with diabetes, due to life-style modifications.
Analysis of our data revealed that sodium intake was not associated with cardiovascular events (data not shown). However, female diabetics with cardiovascular disease had lower overall sodium intake compared to those without cardiovascular disease. A single-center, randomized control trial [27] reported lower sodium intake in patients with diabetes and cardiovascular disease compared to those with diabetes without cardiovascular disease. Reduced intake and enhanced dietary modifications, which are integral to cardiovascular disease care [28], were assumed to have contributed to this observation.
Sodium intake was higher among people with diabetes accompanied by hypercholesterolemia and/or hypertriglyceridemia. In quartiles of sodium intake, those with greater sodium intake tend to have a higher risk of hypercholesterolemia. Thus, there remains a possibility that sodium intake could also affect blood lipid concentration in the Korean population. However, given the cross-sectional nature of this study, we remain skeptical of this possibility. Moreover, a prior study reported that changes in dietary sodium intake over 50 to 150 mmoL/day did not affect blood lipid concentrations [29]. If results similar to our results are found in subsequent studies from KNHANES data, there will be a greater need for more reliable studies on whether sodium intake affects blood lipid concentration.
This study has several strengths, including a large sample with diverse health and sociodemographic data from the Korean population and analysis that interrogates the potential associations between sodium intake and blood lipids among those with and without diabetes. The study is most limited by the fact that the KNHANES obtained data by 24-hour dietary recall, so the accuracy of sodium intake is not guaranteed. Our research is also limited by its cross-sectional nature because we could not elucidate the causal relationship between sodium intake and DM or hypercholesterolemia.
In summary, our study revealed that the overall sodium intake among Korean adults was very high. Second, individuals with an established diagnosis of diabetes, especially females, had lower sodium intake than did individuals with newly diagnosed diabetes or healthy individuals. In addition, female diabetics with cardiovascular disease had lower overall sodium intake than did those without cardiovascular disease. Third, among diabetics with hypercholesterolemia and hypertriglyceridemia, a trend toward higher sodium intake was observed in comparison to those with diabetes alone. Finally, we determined that among those with diabetes, sodium intake also increased the risk of hypercholesterolemia. Future studies will require more accurate tools to record sodium intake. Moreover, further prospective research is needed to elucidate cause-and-effect relationships between sodium intake and blood lipid profiles.

Figures and Tables

Fig. 1

(A) Comparison of sodium intake in male with known diabetes mellitus (DM) and newly diagnosed DM. (B) Comparison of sodium intake in female with known DM and newly diagnosed DM. P value was obtained from PROC SURVEYREG after adjustment for (sex), age group, education, income, body mass index, smoking, alcohol use, physical activity, and total energy intake. aNormal vs. diabetes, bNormal vs. formerly diagnosed, cNormal vs. newly diagnosed, dFormerly vs. newly, e,fStatistically significant P value.

dmj-40-290-g001
Table 1

Baseline characteristics in DM and non-DM

dmj-40-290-i001
Characteristic Normal, % (n=12,477) Diabetes, % (n=1,480) P valuea
Sex
 Male 48.9 56.0 <0.001
 Female 51.1 44.0
Age group, yr
 30–44 44.5 13.1 <0.001
 45–64 35.7 40.1
 65–74 15.5 35.8
 ≥75 4.2 11.0
Education
 Elementary 20.8 42.4 <0.001
 Lower secondary 12.4 15.0
 Upper secondary 36.1 27.8
 College or more 30.6 14.8
Income
 Lowest 15.0 29.1 <0.001
 Medium-low 24.8 28.4
 Medium-high 30.1 22.3
 Highest 30.1 20.2
Body mass index, kg/m2
 <18.5 3.4 1.7 <0.001
 18.5–25.0 64.9 46.3
 ≥25.0 31.6 52.0
Current smokers, yes 24.8 23.5 0.394
Alcohol use, yes 57.8 48.0 <0.001
Regular physical activity, yes 13.2 12.6 0.615
Prevalence of hypertension, yes 29.0 59.4 <0.001
Prevalence of hypercholesterolemia, yes 11.0 24.5 <0.001
Prevalence of hypertriglyceridemia, yes 16.1 31.5 <0.001
Total energy intake, kcal 1,970.2±10.1 1,847.6±25.9 <0.001b
 %CHO 68.4±0.1 71.3±0.3 <0.001b
 %Fat 17.0±0.1 14.6±0.3 <0.001b
 %Protein 14.7±0.1 14.1±0.1 0.001b

Values are presented as mean±standard error.

DM, diabetes mellitus; CHO, carbohydrate.

aP value from Rao-Scott chi-square test using PROC SURVEYFREQ, bP value from PROC SURVEYFREG.

Table 2

Comparison of sodium intake in people with diabetes mellitus and non-diabetes mellitus

dmj-40-290-i002
Variable Normal Diabetes Diabetes formerly diagnosed Diabetes newly diagnosed P valuea
Total (n=13,957) 12,477 1,480 1,137 343
 Sodium, mg 5,188.2±39.1 4,910.2±116.1 4,741.0±133.6 5,340.8±230.6 >0.1b,c,d,e
Male (n=5,661) 4,930 731 543 188
 Sodium, mg 6,127.1±55.4 5,676.3±174.0 5,547.3±210.0 5,957.6±320.0 >0.1b,c,d,e
Female (n=8,296) 7,547 749 594 155
 Sodium, mg 4,290.5±41.5 3,933.3±136.6 3,812.5±150.7 4,314.2±270.4 0.022d, 0.035e

Values are presented as mean±standard error.

aP value was obtained from PROC SURVEYREG after adjustment for (sex), age group, education, income, body mass index, smoking, alcohol use, physical activity, and total energy intake, bNormal vs. diabetes, cNormal vs. formerly diagnosed, dNormal vs. newly diagnosed, eFormerly vs. newly.

Table 3

Comparison of sodium intake in DM patients with or without CVD, hypercholesterolemia, hypertriglyceridemia

dmj-40-290-i003
Variable Na, mg P value
Total (n=1,480)
 DM alone 4,929.4±126.8 a
 DM c CVD 4,727.1±350.5 0.786
 DM alone 4,711.2±132.6 b
 DM c hypercholesterolemia 5,525.2±250.9 0.021
 DM alone 4,726.8±134.7 b
 DM c hypertriglyceridemia 5,294.1±7,187.5 0.201
Male (n=731)
 DM alone 5,669.4±185.1 a
 DM c CVD 5,738.6±499.4 0.439
 DM alone 5,294.1±182.0 b
 DM c hypercholesterolemia 7,187.5±432.3 0.011
 DM alone 5,507.1±217.9 b
 DM c hypertriglyceridemia 5,994.4±291.3 0.891
Female (n=749)
 DM alone 3,998.2±148.4 a
 DM c CVD 3,262.2±246.9 0.058
 DM alone 3,865.1±162.5 b
 DM c hypercholesterolemia 4,093.4±230.5 0.777
 DM alone 3,833.4±127.4 b
 DM c hypertriglyceridemia 4,199.6±347.9 0.067

Values are presented as mean±standard error.

DM, diabetes mellitus; CVD, cardiovascular disease; c, with.

aP value was obtained from PROC SURVEYREG after adjustment for (sex), age group, body mass index (BMI), and total energy intake, bP value was obtained from PROC SURVEYREG after adjustment for (sex), age group, education, income, BMI, smoking, alcohol use, physical activity, and total energy intake.

Table 4

Odds ratio of dyslipidemia according to the quartile of sodium intake

dmj-40-290-i004
Variable Q1 Q2 Q3 Q4 P value
OR 95% CI OR 95% CI OR 95% CI OR 95% CI
Total (n=1,480) 370 370 370 370
 Hypercholesterolemia (n=364) 1.00 - 1.16 0.74–1.80 0.99 0.62–1.56 1.83 1.12–2.97 0.028
 Hypertriglyceridemia (n=432) 1.00 - 0.83 0.55–1.25 1.03 0.68–1.58 1.02 0.67–1.56 0.629
Male (n=731) 182 183 183 183
 Hypercholesterolemia (n=134) 1.00 - 1.02 0.47–2.20 1.29 0.60–2.77 2.46 1.20–5.05 0.006
 Hypertriglyceridemia (n=229) 1.00 - 0.66 0.37–1.18 0.94 0.52–1.68 1.03 0.55–1.91 0.548
Female (n=749) 187 187 188 187
 Hypercholesterolemia (n=230) 1.00 - 0.77 0.44–1.34 1.27 0.68–2.39 1.20 0.64–2.22 0.301
 Hypertriglyceridemia (n=203) 1.00 - 1.72 0.96–3.09 1.97 1.13–3.44 1.52 0.82–2.82 0.144

OR, odds ratio.

aP for trend was obtained from PROC SURVEYLOGISTIC after adjustment for sex, age group, education, income, body mass index, smoking, alcohol use, physical activity, and total energy intake.

ACKNOWLEDGMENTS

We would like to thank members of Committee of Food and Nutrition, Korean Diabetes Association.

Notes

CONFLICTS OF INTEREST No potential conflict of interest relevant to this article was reported.

References

1. Intersalt: an international study of electrolyte excretion and blood pressure. Results for 24 hour urinary sodium and potassium excretion. Intersalt Cooperative Research Group. BMJ. 1988; 297:319–328.
2. Midgley JP, Matthew AG, Greenwood CM, Logan AG. Effect of reduced dietary sodium on blood pressure: a meta-analysis of randomized controlled trials. JAMA. 1996; 275:1590–1597.
3. He FJ, MacGregor GA. Effect of modest salt reduction on blood pressure: a meta-analysis of randomized trials. Implications for public health. J Hum Hypertens. 2002; 16:761–770.
4. Cutler JA, Follmann D, Allender PS. Randomized trials of sodium reduction: an overview. Am J Clin Nutr. 1997; 65:2 Suppl. 643S–651S.
5. Law MR, Frost CD, Wald NJ. By how much does dietary salt reduction lower blood pressure? III. Analysis of data from trials of salt reduction. BMJ. 1991; 302:819–824.
6. Gress TW, Nieto FJ, Shahar E, Wofford MR, Brancati FL. Hypertension and antihypertensive therapy as risk factors for type 2 diabetes mellitus. Atherosclerosis Risk in Communities Study. N Engl J Med. 2000; 342:905–912.
7. Suckling RJ, He FJ, Macgregor GA. Altered dietary salt intake for preventing and treating diabetic kidney disease. Cochrane Database Syst Rev. 2010; (12):CD006763.
8. Uzu T, Nakao K, Kume S, Araki H, Isshiki K, Araki S, Kawai H, Ugi S, Kashiwagi A, Maegawa H. High sodium intake is associated with masked hypertension in Japanese patients with type 2 diabetes and treated hypertension. Am J Hypertens. 2012; 25:1170–1174.
9. Ekinci EI, Clarke S, Thomas MC, Moran JL, Cheong K, MacIsaac RJ, Jerums G. Dietary salt intake and mortality in patients with type 2 diabetes. Diabetes Care. 2011; 34:703–709.
10. Huh KY, Suh I, Kim KR, Nam CM, Oh KW. The relationship between salt perception and salt intake in diabetic patients. J Korean Diabetes Assoc. 1998; 22:74–83.
11. Lee SE, Kim JH. Comparison of dietary intakes and plasma lipid levels in diabetes and control elderly. Korean J Community Nutr. 2004; 9:98–112.
12. Lim HJ, Woo MH, Moon SK, Choue R. Comparative study of diabetes mellitus patients with cerebral infarction or without cerebral infarction: focused on nutrient intakes and dietary quality. Korean J Nutr. 2008; 41:621–633.
13. Cogswell ME, Zhang Z, Carriquiry AL, Gunn JP, Kuklina EV, Saydah SH, Yang Q, Moshfegh AJ. Sodium and potassium intakes among US adults: NHANES 2003-2008. Am J Clin Nutr. 2012; 96:647–657.
14. Franz MJ. Lifestyle modifications for diabetes management. Endocrinol Metab Clin North Am. 1997; 26:499–510.
15. Tuomilehto J, Lindstrom J, Eriksson JG, Valle TT, Hamalainen H, Ilanne-Parikka P, Keinanen-Kiukaanniemi S, Laakso M, Louheranta A, Rastas M, Salminen V, Uusitupa M. Finnish Diabetes Prevention Study Group. Prevention of type 2 diabetes mellitus by changes in lifestyle among subjects with impaired glucose tolerance. N Engl J Med. 2001; 344:1343–1350.
16. Buse JB, Ginsberg HN, Bakris GL, Clark NG, Costa F, Eckel R, Fonseca V, Gerstein HC, Grundy S, Nesto RW, Pignone MP, Plutzky J, Porte D, Redberg R, Stitzel KF, Stone NJ. American Heart Association. American Diabetes Association. Primary prevention of cardiovascular diseases in people with diabetes mellitus: a scientific statement from the American Heart Association and the American Diabetes Association. Circulation. 2007; 115:114–126.
17. Evert AB, Boucher JL, Cypress M, Dunbar SA, Franz MJ, Mayer-Davis EJ, Neumiller JJ, Nwankwo R, Verdi CL, Urbanski P, Yancy WS Jr. American Diabetes Association. Nutrition therapy recommendations for the management of adults with diabetes. Diabetes Care. 2013; 36:3821–3842.
18. McCarty MF. High-salt, low-potassium diets may increase risk for type 2 diabetes via marinobufagenin-mediated potentiation of glucolipotoxicity in pancreatic beta cells. Available from: http://catalyticlongevity.org/prepub_archive/salt-DM[1].pdf.
19. Kabakov E, Norymberg C, Osher E, Koffler M, Tordjman K, Greenman Y, Stern N. Prevalence of hypertension in type 2 diabetes mellitus: impact of the tightening definition of high blood pressure and association with confounding risk factors. J Cardiometab Syndr. 2006; 1:95–101.
20. Marin R, Gorostidi M, Tranche S, Rodriguez-Manas L, Abellan J. Hypertension prevalence and control in type 2 diabetes: a primary care-based study. Am J Hypertens. 2002; 15:Suppl 3. 192A.
21. Moore WV, Fredrickson D, Brenner A, Childs B, Tatpati O, Hoffman JM, Guthrie R. Prevalence of hypertension in patients with type II diabetes in referral versus primary care clinics. J Diabetes Complications. 1998; 12:302–306.
22. Suh DC, Kim CM, Choi IS, Plauschinat CA, Barone JA. Trends in blood pressure control and treatment among type 2 diabetes with comorbid hypertension in the United States: 1988-2004. J Hypertens. 2009; 27:1908–1916.
23. Forte JG, Miguel JM, Miguel MJ, de Padua F, Rose G. Salt and blood pressure: a community trial. J Hum Hypertens. 1989; 3:179–184.
24. Sacks FM, Svetkey LP, Vollmer WM, Appel LJ, Bray GA, Harsha D, Obarzanek E, Conlin PR, Miller ER 3rd, Simons-Morton DG, Karanja N, Lin PH. ASH-Sodium Collaborative Research Group. Effects on blood pressure of reduced dietary sodium and the Dietary Approaches to Stop Hypertension (DASH) diet. DASH-Sodium Collaborative Research Group. N Engl J Med. 2001; 344:3–10.
25. Feldstein CA. Salt intake, hypertension and diabetes mellitus. J Hum Hypertens. 2002; 16:Suppl 1. S48–S51.
26. Shin EK, Lee HJ, Lee JJ, Ann MY, Son SM, Lee YK. Estimation of sodium intake of adult female by 24-hour urine analysis, dietary records and dish frequency questionnaire (DFQ 55). Korean J Nutr. 2010; 43:79–85.
27. Provenzano LF, Stark S, Steenkiste A, Piraino B, Sevick MA. Dietary sodium intake in type 2 diabetes. Clin Diabetes. 2014; 32:106–112.
28. Ornish D, Scherwitz LW, Billings JH, Brown SE, Gould KL, Merritt TA, Sparler S, Armstrong WT, Ports TA, Kirkeeide RL, Hogeboom C, Brand RJ. Intensive lifestyle changes for reversal of coronary heart disease. JAMA. 1998; 280:2001–2007.
29. Harsha DW, Sacks FM, Obarzanek E, Svetkey LP, Lin PH, Bray GA, Aickin M, Conlin PR, Miller ER 3rd, Appel LJ. Effect of dietary sodium intake on blood lipids: results from the DASH-sodium trial. Hypertension. 2004; 43:393–398.
TOOLS
ORCID iDs

Chong Hwa Kim
https://orcid.org/http://orcid.org/0000-0002-4563-7772

Tae Sun Park
https://orcid.org/http://orcid.org/0000-0001-7216-8468

Similar articles