Journal List > Diabetes Metab J > v.40(3) > 1084886

Koohdani, Sadrzadeh-Yeganeh, Djalali, Eshraghian, Zamani, Sotoudeh, Mansournia, and Keramat: APO A2 -265T/C Polymorphism Is Associated with Increased Inflammatory Responses in Patients with Type 2 Diabetes Mellitus

Abstract

Background

Apolipoprotein A2 (APO A2) is the second most abundant structural apolipoprotein in high density lipoprotein. Several studies have examined the possible effect of APO A2 on atherosclerosis incidence. Due to the role of inflammation in atherosclerosis, we aimed to determine the relationship between APO A2 -265T/C polymorphism and inflammation as a risk factor in type 2 diabetes mellitus (T2DM) patients.

Methods

In total, 180 T2DM patients, with known APO A2 -265T/C polymorphism, were recruited for this comparative study and were grouped equally based on their genotypes. Dietary intakes, anthropometric parameters, lipid profile, and inflammatory markers (i.e., pentraxin 3 [PTX3], high-sensitivity C-reactive protein [hs-CRP], and interleukin 18) were measured. The data were analyzed using an independent t-test, a chi-square test, and the analysis of covariance.

Results

After adjusting for confounding factors, in the entire study population and in the patients with or without obesity, the patients with the CC genotype showed higher hs-CRP (P=0.001, P=0.008, and P=0.01, respectively) and lower PTX3 (P=0.01, P=0.03, and P=0.04, respectively) in comparison with the T allele carriers. In the patients with the CC genotype, no significant differences were observed in the inflammatory markers between the obese or non-obese patients. However, regarding the T allele carriers, the plasma hs-CRP level was significantly higher in the obese patients compared to the non-obese patients (P=0.01).

Conclusion

In the T2DM patients, the CC genotype could be considered as a risk factor and the T allele as a protective agent against inflammation, which the latter effect might be impaired by obesity. Our results confirmed the anti-atherogenic effect of APO A2, though more studies are required to establish this effect.

INTRODUCTION

Apolipoprotein A2 (APO A2) is the second major protein in high density lipoprotein (HDL), comprising approximately 20% of the total HDL protein content [1]. Unlike apolipoprotein A1 (APO A1), the role of APO A2 in HDL metabolism and its physiological significance are not studied in detail [23]. APO A2 is mainly synthesized in the liver, and its transcription is controlled by a complex set of regulatory elements in the promoter region [4]. The T to C substitution in the APO A2 promoter (-265T>C polymorphism, rs5082) downregulates its expression in the liver cells, thus reducing its secretion into plasma. Therefore, based on the genotype, the plasma APO A2 level is different [5].
Several investigations have studied the interaction between the plasma APO A2 level and the incidence of cardiovascular disease (CVD) and have discovered controversial results [678910]. Few studies have reported an inverse relationship between the plasma APO A2 level and CVD, as well as type 2 diabetes mellitus (T2DM) [67]. On the contrary, Xiao et al. [1] reported that a low plasma APO A2 level could be associated with a reduced risk of CVD.
CVD is the main cause of morbidity and mortality in T2DM patients [11]. The rise in urbanization, a sedentary lifestyle, and, in particular, obesity, all result in an increased incidence of T2DM worldwide [12]. It turns the disease into a global crisis in public health and a potential threat to the economy of all nations, especially in developing countries [12]. Besides, T2DM is considered a major risk factor for developing premature atherosclerosis, coronary artery disease, cerebrovascular disease, and peripheral vascular disease. Several studies showed that one reason behind all of these complications is an elevated level of proinflammatory cytokines [13]. An impaired lipid profile and the accumulation of fatty tissues, especially in the abdominal cavity, are among the most prevalent metabolic disorders of T2DM [14]. The adipose tissue is currently considered as endocrine tissue due to its role in inflammation and the production of various cytokines, which lead to changes in the metabolic status [15]. Notably, it was shown that accumulated fat in the abdominal cavity could result in atherosclerosis via the production of inflammatory cytokines [16].
Due to the APO A2 contribution to CVD and also the role of inflammation in causing the disease, it appears that APO A2 genotypes might be associated with different levels of inflammatory markers. Accordingly, the current study was developed to examine the relation between APO A2 -265T/C polymorphism and inflammation in T2DM patients.

METHODS

Study design

Based on the World Health Organization criteria, we defined obesity as a body mass index (BMI) ≥30 kg/m2 [17]. Sample size was defined according to a type I error of α=0.05 and a type II error of β=80%. In total, 180 T2DM patients, divided into two groups of 90 individuals with or without obesity (BMI ≥30 or <30 kg/m2), were selected from 816 previously genotyped individuals (the frequency of the APO A2 genotypes was 39.4%, 47.7%, and 12.9% for the TT, TC, and CC genotypes combinations, respectively) [18]. In the current study, each group contained 30 patients for each TT, TC, or CC genotypes. Then, based on the previous studies, the patients were divided into two groups: T allele carriers (TC+TT) and CC genotype [192021].
All of the participants, aged 35 to 65 years, did not have a history of insulin therapy; renal, hepatic, thyroid, and coagulation disorders; cancers; inflammatory diseases; stroke; smoking habits; addiction and alcohol consumption; anti-inflammatory drug intake; or vitamin and mineral supplementation. All of the subjects provided written informed consent. This study was approved by the Ethics Committee of Tehran University of Medical Sciences.

Data collection

A self-administered questionnaire was used to record age, sex, job status, level of education, duration of diabetes, and consumption of any lipid-lowering or glucose-lowering drugs. Physical activity was measured by a metabolic equivalent of task using a validated questionnaire [22]. Information on dietary intake during the last year was collected using a validated semi-quantitative food frequency questionnaire through a face-to-face interview by a trained dietitian [23]. Nutritionist III software version 7.0 (N Squared Computing, Palmerston North, New Zealand) was employed to analyze the energy and nutrient intake of the patients. Anthropometric parameters, including height, weight, and waist circumference (WC), were measured by a trained nutritionist according to standard protocols [12]. Weight was measured to the nearest 100 g. Height and WC were measured to the nearest 0.5 cm using a non-stretching meter. BMI was calculated as weight (kg) divided by the square of height (m2).
Venous blood samples were collected at 8:00 AM, after 12 hours of fasting. Total cholesterol, triglyceride, HDL cholesterol (HDL-C), and low density lipoprotein cholesterol (LDL-C) concentrations were measured by an enzymatic method with commercially available kits (Pars Azmoon Co., Tehran, Iran). The serum levels of the inflammatory markers were measured by enzyme-linked immunosorbent assay. Interleukin 18 (IL-18) and pentraxin 3 (PTX3) were measured by Crystal Day Biotech (Shanghai Crystal Day Biotech Co. Ltd., Shanghai, China), and high-sensitivity C-reactive protein (hs-CRP) was measured by DBC (Diagnostics Biochem Canada Inc., Dorchester, ON, Canada).

Statistical analysis strategy

Characteristics of the study subjects are presented as a mean±standard deviation or frequency (percentage). The chi-square test and the independent t-test were utilized to compare the categorical variables and the continuous variables between the two study groups, respectively. The distributions of the continuous variables were assessed for normality using the normal probability plot and the Kolmogorov-Smirnov test. If necessary, a logarithmic transformation was performed to normalize the error distribution. Therefore, the logarithm of triglycerides, total cholesterol, and hs-CRP was used. The analysis of covariance was employed to evaluate the associations between the continuous variables and the study group after adjusting for potential confounding variables.
Based on the recessive model in a previous study, the APO A2 genotypes were analyzed by comparing the homozygote of the minor allele (CC) with the combined homozygote of the major alleles and the heterozygote alleles (TT+TC) [24]. The associations between the inflammatory markers and the genotype groups (the T allele carriers and the CC genotype) were summarized as mean differences (in the logarithmic scale) and 95% confidence intervals separately in our two groups of obese and non-obese patients. The significance level was set to 0.05 for all of the tests. Statistical analyses were performed using SPSS version 20 (IBM Co., Armonk, NY, USA).

RESULTS

Out of the 180 subjects, 64 (36.6%) were men and 116 (64.4%) were women. The characteristics of the study population, based on the genotype groups (TT+TC and CC), are shown in Table 1. The mean age was different between the two genotype groups (P=0.004). No significant differences were found between the two groups regarding other variables, such as lipid-lowering or anti-diabetic drugs, physical activity, BMI, WC, nutrient intake, and lipid indices.
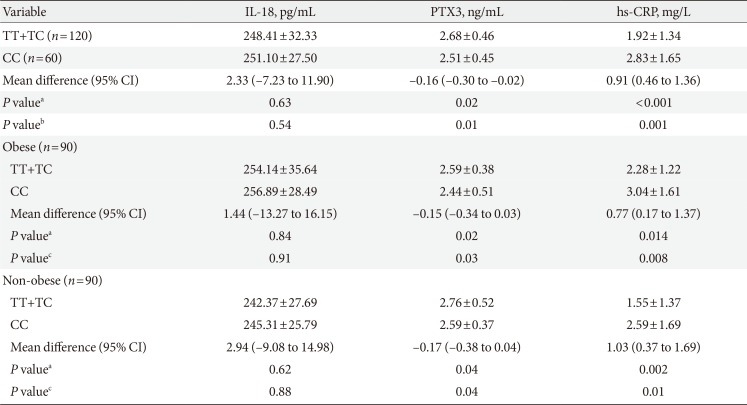
The associations between the genotype groups and the inflammatory markers (i.e., IL-18, PTX3, and hs-CRP) in the total study population and separately in the obese and non-obese patients are summarized in Table 2. After adjusting for BMI, sex, age, and monounsaturated fatty acid (MUFA), the mean PTX3 was lower and the mean hs-CRP was higher in the CC genotype group compared with the T allele carriers (P=0.01 and P=0.001, respectively). There was no statistically significant difference in the mean concentration of IL-18 between the T allele carriers and the patients with the CC genotype. After adjusting for WC, sex, age, and MUFA, the mean PTX3 in the CC genotype group was lower than the T allele carriers in both the obese and non-obese patients (P=0.03 and P=0.04, respectively). In addition, the mean hs-CRP was significantly higher in the CC genotype group compared with the T allele carriers in both the patients with or without obesity (P=0.008 and P=0.01, respectively).
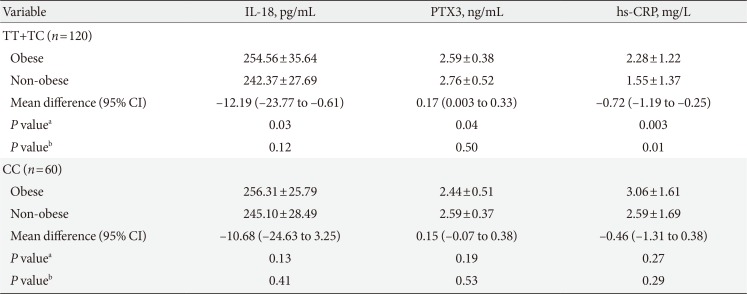
Table 3 compares the inflammatory markers between the patients with or without obesity of both the TT+TC genotypes and the CC genotype. After adjusting for WC, sex, age, and MUFA, the mean serum hs-CRP level was higher in the T allele carriers in the obese patients compared to the non-obese patients (P=0.01). No other significant differences were observed between the subjects with or without obesity.

DISCUSSION

In our previous study regarding the association between APO A2 –265T/C polymorphism and oxidative stress in T2DM patients, we observed that the rate of oxidative stress was higher in the patients with the CC genotype than the T allele carriers [25]. The current survey is the first attempt to study the relation between this polymorphism and the level of inflammation in T2DM patients. We found that after adjusting for confounding variables, the mean hs-CRP was significantly higher and the PTX3 was significantly lower in the patients with the CC genotype than the T allele carriers (Table 2). Moreover, in the T allele carriers, the mean hs-CRP concentration was statistically higher in the obese subjects compared to the non-obese subjects (Table 3).
Based on previous studies, the T to C substitution in the promoter region of APO A2 could result in a decreased expression of APO A2; different APO A2 genotypes are related to different serum APO A2 levels [5]. So far, several investigations have studied the association between serum APO A2 levels and CVD [79102627]. In some studies, an inverse relationship was reported between plasma APO A2 levels and inflammatory markers, such as hs-CRP [78928]. In addition, human studies have shown that the incidence of CVD is higher in subjects with lower serum APO A2 levels [726]. Nevertheless, several studies revealed high serum APO A2 levels as a proatherogenic factor [1293031].
Based on some animal studies, the expression of APO A2 in transgenic mice resulted in decreased paraoxonase 1 (PON1) activity, increased LDL oxidation [31], and an increased size of atherosclerotic lesions [293132]. In another study on transgenic rabbits with human APO A2 gene, transgenic rabbits exhibited significantly lower plasma CRP levels and higher PON1 activity, a decreased number of neutrophils and monocytes in the blood, and a reduced size of atherosclerotic lesions than the non-transgenic rabbits [33].
Transgenic mice are not the best model to describe human APO A2 and HDL metabolism. Instead, rabbits provide a better animal model for studying APO A2 metabolism [34]. In addition, human APO A2 was overexpressed in transgenic mice (30 to 35 mg/dL) [31]. In fact, the overexpression of human APO A2 in transgenic mice could lead to impaired activity of the enzymes involved in HDL metabolism, as well as decreased APO A1 levels [35].
Xiao et al. [1] have studied the association between CVD and different genotypes of APO A2 in men. According to their results, the risk of CVD was significantly lower in the patients with the CC genotype compared with the T allele carriers. This is in contrast with our results, though most of our subjects were female (64.4%). Xiao et al. [1] suggested that the overexpression of APO A2 could change the HDL functions and, consequently, cause atherosclerosis. In contrast, in a recent in vitro study, HDL particles in the transgenic rabbits with the human APO A2 gene were larger with higher cholesterol efflux ability, along with stronger suppressive activity on the inflammatory cytokine expression of macrophages, compared with the non-transgenic rabbits [28].
We observed that the mean value of inflammatory markers was significantly higher in the patients with the CC genotype compared with the T allele carriers (Table 2). These finding may indicate a protective effect of the T allele against inflammation. According to previous reports, the plasma APO A2 level is higher in the T allele carriers than the patients with the CC genotype [5]. It was suggested that the plasma APO A2 level could affect the anti-inflammatory activity and the levels of inflammatory markers, as the T allele carriers had lower levels of inflammatory markers and blood leukocytes (both neutrophils and monocytes), as well as high PON1 activity. This could be the explanation for the higher levels of inflammation in the patients with the CC genotype compared with the T allele carriers in our study. Nevertheless, this hypothesis should be examined in future studies.
Furthermore, in our study, the mean concentration of IL-18 was not significantly different between the patients with the CC genotype and the T allele carriers. In addition, hyperglycemia could acutely increase the circulating cytokine levels by an oxidative mechanism, and insulin resistance is a strong determinant of IL-18 levels. In the current study, no significant relationship was found about IL-18. This may be due to the fact that our subjects were all T2DM patients, and insulin resistance is common in T2DM [36].
One limitation of the current study was that there were no measurements of the plasma APO A2 level. We also did not evaluate the relation between the APO A2 polymorphism and the level of inflammatory markers in healthy individuals. It is suggested that the serum level of APO A2, along with inflammatory markers, should be studied in the future in T2DM patients and healthy subjects. In addition, our participants were not studied separately according to the type of consumed glucose-lowering drugs.
In conclusion, the present study investigated the various levels of inflammation in genetic variants of APO A2 -265T/C polymorphism. T2DM patients with the CC genotype are more susceptible to inflammation and complications, such as CVD. Moreover, obesity could increase the level of inflammation in the T allele carriers. More research is required to confirm these findings. There might be a new topic about the role of APO A2 in the incidence and the progression of inflammatory diseases.

ACKNOWLEDGMENTS

This research was funded by the Research Council of Tehran University of Medical Sciences, grant number: 20413. We would like to express our appreciation to all who cooperated with us and, more specifically, the patients for their willingness to contribute to this study.

Notes

CONFLICTS OF INTEREST: No potential conflict of interest relevant to this article was reported.

References

1. Xiao J, Zhang F, Wiltshire S, Hung J, Jennens M, Beilby JP, Thompson PL, McQuillan BM, McCaskie PA, Carter KW, Palmer LJ, Powell BL. The apolipoprotein AII rs5082 variant is associated with reduced risk of coronary artery disease in an Australian male population. Atherosclerosis. 2008; 199:333–339. PMID: 18179799.
crossref
2. Degoma EM, Rader DJ. Novel HDL-directed pharmacotherapeutic strategies. Nat Rev Cardiol. 2011; 8:266–277. PMID: 21243009.
crossref
3. Linsel-Nitschke P, Tall AR. HDL as a target in the treatment of atherosclerotic cardiovascular disease. Nat Rev Drug Discov. 2005; 4:193–205. PMID: 15738977.
crossref
4. Martin-Campos JM, Escola-Gil JC, Ribas V, Blanco-Vaca F. Apolipoprotein A-II, genetic variation on chromosome 1q21-q24, and disease susceptibility. Curr Opin Lipidol. 2004; 15:247–253. PMID: 15166779.
5. van 't Hooft FM, Ruotolo G, Boquist S, de Faire U, Eggertsen G, Hamsten A. Human evidence that the apolipoprotein a-II gene is implicated in visceral fat accumulation and metabolism of triglyceride-rich lipoproteins. Circulation. 2001; 104:1223–1228. PMID: 11551871.
6. Syvanne M, Kahri J, Virtanen KS, Taskinen MR. HDLs containing apolipoproteins A-I and A-II (LpA-I:A-II) as markers of coronary artery disease in men with non-insulin-dependent diabetes mellitus. Circulation. 1995; 92:364–370. PMID: 7634450.
7. Birjmohun RS, Dallinga-Thie GM, Kuivenhoven JA, Stroes ES, Otvos JD, Wareham NJ, Luben R, Kastelein JJ, Khaw KT, Boekholdt SM. Apolipoprotein A-II is inversely associated with risk of future coronary artery disease. Circulation. 2007; 116:2029–2035. PMID: 17923573.
crossref
8. Alaupovic P, Mack WJ, Knight-Gibson C, Hodis HN. The role of triglyceride-rich lipoprotein families in the progression of atherosclerotic lesions as determined by sequential coronary angiography from a controlled clinical trial. Arterioscler Thromb Vasc Biol. 1997; 17:715–722. PMID: 9108785.
crossref
9. Onat A, Hergenc G, Ayhan E, Ugur M, Can G. Impaired anti-inflammatory function of apolipoprotein A-II concentrations predicts metabolic syndrome and diabetes at 4 years follow-up in elderly Turks. Clin Chem Lab Med. 2009; 47:1389–1394. PMID: 19817643.
crossref
10. Sweetnam PM, Bolton CH, Downs LG, Durrington PN, MacKness MI, Elwood PC, Yarnell JW. Apolipoproteins A-I, A-II and B, lipoprotein(a) and the risk of ischaemic heart disease: the Caerphilly study. Eur J Clin Invest. 2000; 30:947–956. PMID: 11114956.
crossref
11. Vasiliadis I, Kolovou G, Mavrogeni S, Nair DR, Mikhailidis DP. Sudden cardiac death and diabetes mellitus. J Diabetes Complications. 2014; 28:573–579. PMID: 24666923.
crossref
12. Mahan LK, Escot-Stump S, Raymond JL, Krause MV. Krause food & the nutrition care process. 13th ed. St. Louis: Saunders;2012. p. 675–710.
13. Bala M, Kopp A, Wurm S, Buchler C, Scholmerich J, Schaffler A. Type 2 diabetes and lipoprotein metabolism affect LPS-induced cytokine and chemokine release in primary human monocytes. Exp Clin Endocrinol Diabetes. 2011; 119:370–376. PMID: 21104588.
crossref
14. Bari MR, Ostgren CJ, Rastam L, Lindblad U. Abdominal obesity and insulin resistance in patients with type 2 diabetes in a Swedish community. Skaraborg hypertension and diabetes project. Scand J Prim Health Care. 2006; 24:211–217. PMID: 17118860.
15. Enriori PJ, Evans AE, Sinnayah P, Cowley MA. Leptin resistance and obesity. Obesity (Silver Spring). 2006; 14:254S–258S. PMID: 17021377.
crossref
16. Monteiro R, Azevedo I. Chronic inflammation in obesity and the metabolic syndrome. Mediators Inflamm. 2010; 2010:289645. PMID: 20706689.
crossref
17. World Health Organisation. The global epidemic of obesity. Geneva: World Health Organisation;1997.
18. Basiri MG, Sotoudeh G, Alvandi E, Djalali M, Eshraghian MR, Noorshahi N, Koohdani F. APOA2 -256T>C polymorphism interacts with saturated fatty acids intake to affect anthropometric and hormonal variables in type 2 diabetic patients. Genes Nutr. 2015; 10:464. PMID: 25904114.
crossref
19. Corella D, Arnett DK, Tsai MY, Kabagambe EK, Peacock JM, Hixson JE, Straka RJ, Province M, Lai CQ, Parnell LD, Borecki I, Ordovas JM. The -256>C polymorphism in the apolipoprotein A-II gene promoter is associated with body mass index and food intake in the genetics of lipid lowering drugs and diet network study. Clin Chem. 2007; 53:1144–1152. PMID: 17446329.
20. Corella D, Peloso G, Arnett DK, Demissie S, Cupples LA, Tucker K, Lai CQ, Parnell LD, Coltell O, Lee YC, Ordovas JM. APOA2, dietary fat, and body mass index: replication of a gene-diet interaction in 3 independent populations. Arch Intern Med. 2009; 169:1897–1906. PMID: 19901143.
21. Corella D, Tai ES, Sorli JV, Chew SK, Coltell O, Sotos-Prieto M, Garcia-Rios A, Estruch R, Ordovas JM. Association between the APOA2 promoter polymorphism and body weight in Mediterranean and Asian populations: replication of a gene-saturated fat interaction. Int J Obes (Lond). 2011; 35:666–675. PMID: 20975728.
crossref
22. Aadahl M, Jorgensen T. Validation of a new self-report instrument for measuring physical activity. Med Sci Sports Exerc. 2003; 35:1196–1202. PMID: 12840642.
crossref
23. Esmaillzadeh A, Mirmiran P, Azizi F. Whole-grain consumption and the metabolic syndrome: a favorable association in Tehranian adults. Eur J Clin Nutr. 2005; 59:353–362. PMID: 15536473.
crossref
24. Smith CE, Ordovas JM, Sanchez-Moreno C, Lee YC, Garaulet M. Apolipoprotein A-II polymorphism: relationships to behavioural and hormonal mediators of obesity. Int J Obes (Lond). 2012; 36:130–136. PMID: 21386805.
crossref
25. Koohdani F, Sadrzadeh-Yeganeh H, Djalali M, Eshraghian M, Keramat L, Mansournia MA, Zamani E. Association between ApoA-II -265T/C polymorphism and oxidative stress in patients with type 2 diabetes mellitus. J Diabetes Complications. 2015; 29:908–912. PMID: 26104730.
crossref
26. Roselli della Rovere G, Lapolla A, Sartore G, Rossetti C, Zambon S, Minicuci N, Crepaldi G, Fedele D, Manzato E. Plasma lipoproteins, apoproteins and cardiovascular disease in type 2 diabetic patients. A nine-year follow-up study. Nutr Metab Cardiovasc Dis. 2003; 13:46–51. PMID: 12772437.
crossref
27. Parra HJ, Arveiler D, Evans AE, Cambou JP, Amouyel P, Bingham A, McMaster D, Schaffer P, Douste-Blazy P, Luc G, Richard LJ, Ducimetiere P, Fruchart JC, Cambien F. A case-control study of lipoprotein particles in two populations at contrasting risk for coronary heart disease. The ECTIM Study. Arterioscler Thromb. 1992; 12:701–707. PMID: 1534257.
crossref
28. Yi DW, Jeong DW, Lee SY, Son SM, Kang YH. The association between apolipoprotein A-II and metabolic syndrome in Korean adults: a comparison study of apolipoprotein A-I and apolipoprotein B. Diabetes Metab J. 2012; 36:56–63. PMID: 22363922.
crossref
29. Escola-Gil JC, Marzal-Casacuberta A, Julve-Gil J, Ishida BY, Ordonez-Llanos J, Chan L, Gonzalez-Sastre F, Blanco-Vaca F. Human apolipoprotein A-II is a proatherogenic molecule when it is expressed in transgenic mice at a level similar to that in humans: evidence of a potentially relevant species-specific interaction with diet. J Lipid Res. 1998; 39:457–462. PMID: 9580110.
30. Hedrick CC, Castellani LW, Wong H, Lusis AJ. In vivo interactions of apoA-II, apoA-I, and hepatic lipase contributing to HDL structure and antiatherogenic functions. J Lipid Res. 2001; 42:563–570. PMID: 11290828.
crossref
31. Ribas V, Sanchez-Quesada JL, Anton R, Camacho M, Julve J, Escola-Gil JC, Vila L, Ordonez-Llanos J, Blanco-Vaca F. Human apolipoprotein A-II enrichment displaces paraoxonase from HDL and impairs its antioxidant properties: a new mechanism linking HDL protein composition and antiatherogenic potential. Circ Res. 2004; 95:789–797. PMID: 15388641.
32. Castellani LW, Navab M, Van Lenten BJ, Hedrick CC, Hama SY, Goto AM, Fogelman AM, Lusis AJ. Overexpression of apolipoprotein AII in transgenic mice converts high density lipoproteins to proinflammatory particles. J Clin Invest. 1997; 100:464–474. PMID: 9218525.
crossref
33. Wang Y, Niimi M, Nishijima K, Waqar AB, Yu Y, Koike T, Kitajima S, Liu E, Inoue T, Kohashi M, Keyamura Y, Yoshikawa T, Zhang J, Ma L, Zha X, Watanabe T, Asada Y, Chen YE, Fan J. Human apolipoprotein A-II protects against diet-induced atherosclerosis in transgenic rabbits. Arterioscler Thromb Vasc Biol. 2013; 33:224–231. PMID: 23241412.
crossref
34. Brousseau ME, Hoeg JM. Transgenic rabbits as models for atherosclerosis research. J Lipid Res. 1999; 40:365–375. PMID: 10064724.
crossref
35. Pastier D, Dugue S, Boisfer E, Atger V, Tran NQ, van Tol A, Chapman MJ, Chambaz J, Laplaud PM, Kalopissis AD. Apolipoprotein A-II/A-I ratio is a key determinant in vivo of HDL concentration and formation of pre-beta HDL containing apolipoprotein A-II. Biochemistry. 2001; 40:12243–12253. PMID: 11591143.
36. Zirlik A, Abdullah SM, Gerdes N, MacFarlane L, Schonbeck U, Khera A, McGuire DK, Vega GL, Grundy S, Libby P, de Lemos JA. Interleukin-18, the metabolic syndrome, and subclinical atherosclerosis: results from the Dallas Heart Study. Arterioscler Thromb Vasc Biol. 2007; 27:2043–2049. PMID: 17626902.
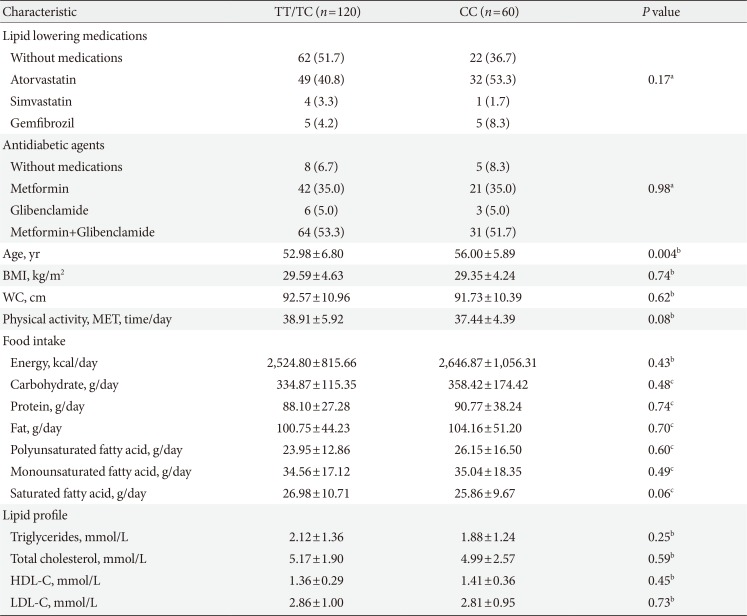
Table 1

Characteristics of patients

dmj-40-222-i001
Characteristic TT/TC (n=120) CC (n=60) P value
Lipid lowering medications
 Without medications 62 (51.7) 22 (36.7)
 Atorvastatin 49 (40.8) 32 (53.3) 0.17a
 Simvastatin 4 (3.3) 1 (1.7)
 Gemfibrozil 5 (4.2) 5 (8.3)
Antidiabetic agents
 Without medications 8 (6.7) 5 (8.3)
 Metformin 42 (35.0) 21 (35.0) 0.98a
 Glibenclamide 6 (5.0) 3 (5.0)
 Metformin+Glibenclamide 64 (53.3) 31 (51.7)
Age, yr 52.98±6.80 56.00±5.89 0.004b
BMI, kg/m2 29.59±4.63 29.35±4.24 0.74b
WC, cm 92.57±10.96 91.73±10.39 0.62b
Physical activity, MET, time/day 38.91±5.92 37.44±4.39 0.08b
Food intake
 Energy, kcal/day 2,524.80±815.66 2,646.87±1,056.31 0.43b
 Carbohydrate, g/day 334.87±115.35 358.42±174.42 0.48c
 Protein, g/day 88.10±27.28 90.77±38.24 0.74c
 Fat, g/day 100.75±44.23 104.16±51.20 0.70c
 Polyunsaturated fatty acid, g/day 23.95±12.86 26.15±16.50 0.60c
 Monounsaturated fatty acid, g/day 34.56±17.12 35.04±18.35 0.49c
 Saturated fatty acid, g/day 26.98±10.71 25.86±9.67 0.06c
Lipid profile
 Triglycerides, mmol/L 2.12±1.36 1.88±1.24 0.25b
 Total cholesterol, mmol/L 5.17±1.90 4.99±2.57 0.59b
 HDL-C, mmol/L 1.36±0.29 1.41±0.36 0.45b
 LDL-C, mmol/L 2.86±1.00 2.81±0.95 0.73b

Values are presented as number (%) or mean±standard deviation.

BMI, body mass index; WC, waist circumference; MET, metabolic equivalent of task; HDL-C, high density lipoprotein cholesterol; LDL-C, low density lipoprotein cholesterol.

aUsing the chi-square test, bUsing the independent t-test, cUsing the analysis of covariance (adjusted for energy).

Table 2

Comparison of inflammatory markers between T allele carriers and CC genotype in total study population and separately in obese and non-obese patients

dmj-40-222-i002
Variable IL-18, pg/mL PTX3, ng/mL hs-CRP, mg/L
TT+TC (n=120) 248.41±32.33 2.68±0.46 1.92±1.34
CC (n=60) 251.10±27.50 2.51±0.45 2.83±1.65
Mean difference (95% CI) 2.33 (-7.23 to 11.90) -0.16 (-0.30 to -0.02) 0.91 (0.46 to 1.36)
P valuea 0.63 0.02 <0.001
P valueb 0.54 0.01 0.001
Obese (n=90)
 TT+TC 254.14±35.64 2.59±0.38 2.28±1.22
 CC 256.89±28.49 2.44±0.51 3.04±1.61
 Mean difference (95% CI) 1.44 (-13.27 to 16.15) -0.15 (-0.34 to 0.03) 0.77 (0.17 to 1.37)
P valuea 0.84 0.02 0.014
P valuec 0.91 0.03 0.008
Non-obese (n=90)
 TT+TC 242.37±27.69 2.76±0.52 1.55±1.37
 CC 245.31±25.79 2.59±0.37 2.59±1.69
 Mean difference (95% CI) 2.94 (-9.08 to 14.98) -0.17 (-0.38 to 0.04) 1.03 (0.37 to 1.69)
P valuea 0.62 0.04 0.002
P valuec 0.88 0.04 0.01

Values are presented as mean±standard deviation.

IL-18, interleukin 18; PTX3, pentraxin 3; hs-CRP, high-sensitivity C-reactive protein; CI, confidence interval.

aUsing the independent t-test, bAdjusted for body mass index, age, sex, and monounsaturated fatty acid (MUFA) using the analysis of covariance (ANCOVA), cAdjusted for waist circumference, age, sex, and MUFA using the ANCOVA.

Table 3

Comparison of mean inflammatory markers between obese and non-obese patients in T allele carriers and CC genotype

dmj-40-222-i003
Variable IL-18, pg/mL PTX3, ng/mL hs-CRP, mg/L
TT+TC (n=120)
 Obese 254.56±35.64 2.59±0.38 2.28±1.22
 Non-obese 242.37±27.69 2.76±0.52 1.55±1.37
 Mean difference (95% CI) -12.19 (-23.77 to -0.61) 0.17 (0.003 to 0.33) -0.72 (-1.19 to -0.25)
P valuea 0.03 0.04 0.003
P valueb 0.12 0.50 0.01
CC (n=60)
 Obese 256.31±25.79 2.44±0.51 3.06±1.61
 Non-obese 245.10±28.49 2.59±0.37 2.59±1.69
 Mean difference (95% CI) -10.68 (-24.63 to 3.25) 0.15 (-0.07 to 0.38) -0.46 (-1.31 to 0.38)
P valuea 0.13 0.19 0.27
P valueb 0.41 0.53 0.29

Values are presented as mean±standard deviation.

IL-18, interleukin 18; PTX3, pentraxin 3; hs-CRP, high-sensitivity C-reactive protein; CI, confidence interval.

aUsing the independent t-test, bAdjusted for waist circumference, age, sex, and monounsaturated fatty acid using the analysis of covariance.

TOOLS
Similar articles