Journal List > Diabetes Metab J > v.39(1) > 1084833

Lee, Youm, Lee, Choi, Chu, Park, and Kim: Appendicular Skeletal Muscle Mass and Insulin Resistance in an Elderly Korean Population: The Korean Social Life, Health and Aging Project-Health Examination Cohort

Abstract

Background

Increasing evidence supports an association between age-related loss of muscle mass and insulin resistance. However, the association has not been fully investigated in the general population. Thus, we investigated the association between appendicular skeletal muscle mass (ASM) and insulin resistance in an elderly Korean population.

Methods

This cross-sectional study included 158 men (mean age, 71.8) and 241 women (mean age, 70.6) from the Korean Social Life, Health and Aging Project, which started in 2011. In this study, ASM was measured by bioelectrical impedance analysis and was analyzed in three forms: ASM (kg), ASM/height2 (kg/m2), and ASM/weight (%). The homeostasis model assessment of insulin resistance (HOMA-IR) was used as a measure of insulin resistance. The relationships between the ASM values and the HOMA-IR were investigated by multiple linear regression models.

Results

The HOMA-IR was positively associated with ASM (β=0.43, P<0.0001) and ASM/height2 (β=0.36, P<0.0001) when adjusted for sex and age. However, after additional adjustment for body weight, HOMA-IR was inversely associated with ASM (β=-0.43, P<0.001) and ASM/height2 (β=-0.30, P=0.001). Adjustment for other potential confounders did not change these associations. Conversely, HOMA-IR was consistently and inversely associated with ASM/weight before and after adjustment for other potential confounders.

Conclusion

Our results support the idea that lower skeletal muscle mass is independently associated with insulin resistance in older adults. When evaluating sarcopenia or muscle-related conditions in older adults, their whole body sizes also need to be considered.

INTRODUCTION

Sarcopenia, the decline of muscle mass and strength with age [1], is a fundamental cause of functional decline, disability, and frailty in older persons [2,3,4,5]. Sarcopenia is characterized by a decrease in the total number of skeletal muscle fibers, reduced thigh circumference, and increased intramuscular fat content [6,7] Although the specific mechanism has not been fully identified, primary causes of sarcopenia are known to be related to aging, undernutrition, sedentary lifestyle, inflammation [8,9,10], oxidative stress [11], and decreased testosterone [12]. Sarcopenia can contribute to the development of insulin resistance and type 2 diabetes because skeletal muscle is the primary site of insulin-stimulated glucose disposal at euglycemia [13,14,15,16,17]. Insulin resistance, an attenuated ability of insulin to generate its physiological responses, is associated with various age-related problems, including atherothrombotic vascular diseases, certain types of cancers, frailty, and cognitive decline.
Although increasing evidence supports an association between sarcopenia and insulin resistance, the effects of declining skeletal muscle mass on insulin resistance have not been fully investigated in the general population. Thus, we investigated the relationship between appendicular skeletal muscle mass (ASM) and insulin resistance among community-dwelling elderly Koreans without a history of diabetes and cardiovascular disease.

METHODS

Study population

The Korean Social Life, Health and Aging Project (KSHAP), which was started in 2011, recruited people aged 60 years or older and their spouses living in the rural township (myeon) of Ganghwa-gun, Incheon, South Korea. A total of 814 out of 860 eligible people in the community agreed to participate in the study and completed the questionnaire survey. The KSHAP-Health Examination Cohort was consisted of 698 people who completed additional health examinations at a public health center (n=533) or at home (n=165). Body composition analysis was available only at the public health center examination. Among the 533 participants, people with a known past history of cardiovascular disease (coronary heart disease and stroke), under treatment for diabetes, or missing important covariate data were excluded. Ultimately, 399 participants (158 men and 241 women) were included in the current study. The Institutional Review Board of Yonsei University approved the study protocol (YUIRB-2011-012-01), and all participants provided written informed consent.

Measurements

Information about age, smoking status (never or ever smoker), and alcohol intake (non-drinker or drinker) was obtained using a questionnaire survey. Standing height was measured to the nearest 0.1 cm using a stadiometer, and body weight was measured to the nearest 0.1 kg on a digital scale up according to the predetermined manual. Body mass index (BMI) was calculated as an individual's body weight in kilograms divided by their height in meters squared. Physical function was assessed by a 3-m timed up and go (TUG) test. The TUG measures the time required for the participants to rise from a chair, walk 3 m to the end of a line (pre-arranged) and then return to the chair and sit down. Resting systolic and diastolic blood pressures were measured at least twice using an oscilloscopic automatic sphygmomanometer (Dinamap 1846 SX/P; GE Healthcare, Waukesha, WI, USA). Prior to each measurement, all participants had rested for at least 5 minutes in a seated position, and the cuff size was adapted to their right upper arm circumference. If the first and second measurements differed by ≥10 mm Hg, additional measurements were performed, and the average of the last two measurements was included in this analysis.
Each participant's ASM was measured by the bioelectrical impedance analysis method (Inbody370; Biospace, Seoul, Korea), according to the instructions provided by the manufacturer. The participants stood up straight and comfortably on the analyzer's footplate while barefoot, with legs apart and arms. This analyzer measures segmental impedances at the right arm, left arm, right leg, left leg, and trunk using a multi-frequency of 5, 50, and 250 kHz. In this study, ASM was estimated by the sum of muscle mass estimated individually for two arms and two legs. Three muscle values including ASM (kg), ASM/height2 (kg/m2), and ASM/weight (%) were used for statistical analysis. Insulin and glucose levels were measured from fasting (at least 8 hours) blood samples. Insulin level was determined by radioimmunoassay, and the fasting blood glucose level was measured using the colorimetry method. To evaluate insulin resistance, we used the homeostasis model assessment of insulin resistance (HOMA-IR) according to the following formula: HOMA-IR=fasting plasma glucose (mg/dL)×fasting insulin (µIU/mL)/405 [18].

Statistical analyses

Gender differences were analyzed using the independent t-test for continuous variables and the chi-square test for categorical variables. Fasting insulin levels were log-transformed for parametric testing due to the distribution that was skewed to the right. The relationship between ASM and HOMA-IR was evaluated using Pearson correlation analysis and is presented with scatter plots. To examine the independent associations of the three forms of ASM with HOMA-IR, we applied serial multiple linear regression models: model 1 included sex and age; model 2 included sex, age and weight; and model 3 included sex, age, weight, height, systolic blood pressure, total cholesterol, high density lipoprotein cholesterol, triglyceride, C-reactive protein, smoking, and alcohol intake. To assess the robustness of our findings, we repeated the analysis without excluding people with a past history of cardiovascular disease. We also performed additional analyses to compare those who underwent body composition analysis and those who did not. All analyses were performed using SAS statistical version 9.2 (SAS Institute Inc., Cary, NC, USA). All statistical tests were two-sided and P values less than 0.05 were considered statistically significant.

RESULTS

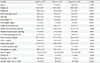
The general characteristics of the study population are presented in Table 1. Men had lower BMI but greater ASM and wider thigh circumference than women. Fasting glucose was higher in men, but fasting insulin levels and HOMA-IR values were higher in women.
A previous Korean study analyzing adults aged 60 years or older in the Fourth Korean National Health and Nutritional Examination Surveys suggested cutoff points of ASM/weight determining sarcopenia as 29.5% in men and 23.2% in women [19]. In our study, the mean ASM/weight was 31.2% in men and 25.2% in women. Another previous Korean study of older adults (60 years or older) suggested cutoff points of ASM/height2 determining sarcopenia as 7.4 kg/m2 in men and 5.1 kg/m2 in women [20]. The Asian Working Group for Sarcopenia, by using bioimpedance analysis, suggested cutoff points of 7.0 kg/m2 in men and 5.7 kg/m2 in women [21]. In our study, the mean ASM/height2 was 7.2 kg/m2 in men and 6.1 kg/m2 in women.
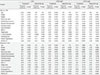
Table 2 presents the correlations between muscle values and other variables using the Pearson correlation coefficients with and without adjustment for age. ASM and ASM/height2 were significantly and positively correlated with HOMA-IR before and after adjusting for age in both men and women. However, ASM/weight had a significant inverse correlation with HOMA-IR before and after adjusting for age. The relationships between muscle values and HOMA-IR were also presented using scatter plots, separately for men and women (Fig. 1).
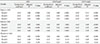
Table 3 shows the relationships between ASM and HOMA-IR in multiple linear regression analyses. HOMA-IR was positively associated with ASM (β=0.43, P<0.0001) and ASM/height2 (β=0.36, P<0.0001) when adjusted for sex and age. However, after additional adjustment for body weight, HOMA-IR was inversely associated with ASM (β=-0.47, P=0.001) and ASM/height2 (β=-0.32, P=0.001). These inverse associations were not affected by additional adjustment for height, blood pressure, mobility function, C-reactive protein, lipid profiles, smoking, and alcohol intake. Conversely, HOMA-IR was significantly and inversely associated with ASM/weight before and after adjustment for sex and age. Additional adjustment for other potential confounders did not change this association. When analyses were performed for men and women separately, the inverse associations between ASM and HOMA-IR were more prominent in men than in women.
Because only a portion (63.1%) of the KSHAP participants had their body composition measured with bioimpedance methods, we compared those who underwent body composition analysis and those who did not. There was no significant difference in the health behaviors and known chronic diseases between the two groups. The only exception was hypertension; the prevalence of known hypertension was 53.1% in those who underwent body composition measurement and 43.3% in those who did not (P=0.01). The results of sensitivity analyses including people with a past history of cardiovascular disease were very similar to the former results excluding people with a past history of cardiovascular disease (data not shown).

DISCUSSION

We examined the relationship between ASM and HOMA-IR in an elderly Korean population. After adjusting for potential confounders, HOMA-IR was significantly and inversely associated with ASM, particularly in men. Our finding reaffirms the association between age-related muscle loss and insulin resistance.
Two cross-sectional analyses using the U.S. National Health and Nutrition Examination Survey III data reported that higher muscle mass is associated with lower insulin resistance and lower risk of diabetes, independent of obesity [16,22]. A previous Korean study with 4,558 males and 5,874 females aged 20 years or older also reported a significant association between insulin resistance and sarcopenia [23]. The study suggested that sarcopenia may be an early predictor for diabetes and metabolic syndrome in the nonobese population, particularly in the elderly. Another Korean study including 493 apparently healthy adults (180 men and 313 women) reported that HOMA-IR levels were negatively associated with relative muscle mass (total skeletal muscle mass divided by body weight) [24]. A recent cohort study of apparently healthy older men reported that insulin resistance was associated with lower relative ASM after 4.6-years of follow-up [25]. Conversely, one study reported that skeletal muscle mass is not related to glucose tolerance or insulin sensitivity in overweight and obese men and women independent of age and total adiposity [26].
An elderly cohort study in Korea reported that HOMA-IR was positively correlated with ASM/height2 and negatively correlated with ASM/weight [27]. The study suggested that ASM/weight is a more appropriate index than ASM/height2 for the measurement of sarcopenic obesity [27]. In another study, the role of muscle tissue as an internal glucose-regulating organ was reflected better by ASM/weight than by ASM, ASM/height2, muscle strength, or walking speed [28]. Our findings are consistent with these results in the unadjusted model. Conversely, the Asian Working Group for Sarcopenia recommends using height-adjusted skeletal muscle mass instead of weight-adjusted skeletal muscle mass [21]. Considering previous and current findings together, when evaluating sarcopenia or muscle-related conditions of older adults, their whole body size should be considered.
There are several possible explanations for the association between sarcopenia and insulin resistance in the elderly. Sarcopenia is typically characterized by reductions in the size and number of muscle fibers [29]. These reductions are related to a combination of decreased anabolism and increased catabolism [30]. Because skeletal muscle is the tissue predominantly responsible for insulin-mediated glucose disposal, sarcopenia can have a negative impact on insulin sensitivity. A case-control study presented evidence of the dysfunction of skeletal muscle mitochondrial activity along with reduced muscle mass, increased adiposity, oxidative stress, and reduced glucose tolerance in elderly adults [31]. Dysfunction of skeletal muscle mitochondrial activity and increased insulin resistance can mutually amplify each other with aging [32]. Increasing evidence supports the pathological association between sarcopenia and metabolic syndrome in a bidirectional association. Sarcopenia, an age-related loss of muscle mass, may contribute to the development of insulin resistance that in turn exacerbates the loss of skeletal muscle. Considering all of these findings, sarcopenia and insulin resistance interact with each other and aging.
This study has a few strengths. First, we recruited participants from a community of a single ethnic background. Therefore, we could minimize the effects of important confounders including ethnicity, residential area, and environmental factors. Second, using multiple statistical models, we controlled and evaluated the effects of other confounders including sex, age, body size, physical health, health behaviors, and mobility function. Third, we used three forms of muscle values, including ASM, ASM/height2 and ASM/weight, for estimating participants' muscle conditions.
Our study also has limitations to be discussed. First, this study is limited by its cross-sectional design. The causal relationship between skeletal muscle mass and insulin resistance was not evaluated in this study. Second, the number of participants was relatively small; thus, we could not conduct further analyses according to age group or obesity status. Third, skeletal muscle mass was measured via a bioelectrical impedance analysis method in this study. Although dual-energy X-ray absorptiometry is widely used to measure skeletal muscle mass, owing to its limited accessibility, bioelectrical impedance analysis method is increasingly used as alternative [33,34]. Fourth, our findings may not be generalizable to other ethnic or age groups because the study was conducted among older Korean adults recruited from a single rural community. Moreover, the study population was a selected group of people who visited the public health center and completed physical examinations. These factors may limit the generalizability of our study findings. However, in the comparison between people with and without body composition analysis, no significant differences existed in terms of health behaviors, depression, self-rated health, and most common chronic disorders, except for hypertension.
In conclusion, lower skeletal muscle mass was associated with increased insulin resistance in a healthy elderly Korean population, and the association was more prominent in men than in women. Additionally, when evaluating sarcopenia or muscle-related conditions of older adults, their whole body size should be considered.

Figures and Tables

Fig. 1

Correlation between appendicular skeletal muscle mass (ASM) and homeostasis model assessment of insulin resistance (HOMA-IR). (A) ASM and HOMA-IR in 158 men (Pearson coefficient=0.281, P=0.0004). (B) ASM and HOMA-IR in 241 women (Pearson coefficient=0.250, P<0.0001). (C) ASM/height2 and HOMA-IR in 158 men (Pearson coefficients=0.287, P=0.0003). (D) ASM/height2 and HOMA-IR in 241 women (Pearson coefficient=0.255, P<0.0001). (E) ASM/weight and HOMA-R in 158 men (Pearson coefficient=-0.431, P<0.0001). (F) ASM/weight and HOMA-IR in 241 women (Pearson coefficient=-0.253, P<0.0001).

dmj-39-37-g001
Table 1

The general characteristics of the study population

dmj-39-37-i001
Variable Total (n=339) Men (n=158) Women (n=241) P value
Age, yr 71.0±7.7 71.8±7.3 70.6±7.8 0.125
Height, cm 155.5±8.9 163.3±6.2 150.4±6.4 <0.001
Weight, kg 58.1±10.3 62.4±10.0 55.3±9.5 <0.001
Body mass index, kg/m2 24.0±3.4 23.4±3.5 24.3±3.3 0.005
ASM, kg 16.1±3.8 19.4±2.9 13.9±2.5 <0.001
ASM/weight, % 27.6±4.1 31.2±3.2 25.2±2.7 <0.001
ASM/height2, kg/m2 6.5±0.9 7.2±0.8 6.1±0.7 <0.001
Thigh circumference, cm 47.6±3.8 48.6±3.7 47.0±3.7 <0.001
Systolic blood pressure, mm Hg 131.9±18.4 132.0±19.2 131.8±17.9 0.888
Diastolic blood pressure, mm Hg 71.4±9.8 73.5±10.0 70.1±9.4 0.001
3-m timed up and go test, sec 12.7±3.4 12.1±3.4 13.0±3.3 0.010
Total cholesterol, mg/dL 187.7±33.6 177.9±32.4 194.2±32.9 <0.001
HDL-C, mg/dL 53.0±12.7 52.9±12.7 53.2±12.8 0.818
Triglyceride, mg/dL 151.8±76.7 149.9±83.3 153.1±72.1 0.691
C-reactive protein, mg/L 2.5±7.6 3.7±11.0 1.7±4.0 0.028
Fasting glucose, mg/dL 89.9±11.5 92.1±14.1 88.5±9.2 0.004
Insulin, mg/dL 6.8 (5.5-8.7) 6.4 (4.9-8.0) 7.3 (5.8-9.2) <0.001
HOMA-IR 1.7±0.9 1.6±0.9 1.8±0.9 0.040
Smoking, ever (n=388) 102 (30.1) 98 (64.5) 4 (1.7) <0.001
Alcohol intake, ever (n=388) 134 (39.5) 90 (59.2) 44 (18.6) <0.001

Values are presented as mean±standard deviation, median (interquartile range), or number (%).

ASM, appendicular skeletal muscle mass; HDL-C, high density lipoprotein cholesterol; HOMA-IR, homeostasis model assessment of insulin resistance.

Table 2

The correlation between appendicular skeletal muscle mass and other variables

dmj-39-37-i002
Variable ASM ASM/height2 ASM/weight
Unadjusted Adjusted for age Unadjusted Adjusted for age Unadjusted Adjusted for age
Pearson's coefficient P value Pearson's coefficients P value Pearson's coefficients P value Pearson's coefficients P value Pearson's coefficients P value Pearson's coefficients P value
Men (n=158)
 Age -0.44 <0.001 NA NA -0.42 <0.001 NA NA -0.12 0.132 NA NA
 Height 0.74 <0.001 0.71 <0.001 0.33 <0.001 0.23 0.004 0.41 <0.001 0.39 <0.001
 Weight 0.79 <0.001 0.76 <0.001 0.80 <0.001 0.77 <0.001 -0.39 <0.001 -0.45 <0.001
 Body mass index 0.46 <0.001 0.41 <0.001 0.71 <0.001 0.70 <0.001 -0.64 <0.001 -0.69 <0.001
 Systolic blood pressure -0.08 0.331 -0.03 0.712 -0.05 0.558 <0.001 0.963 -0.12 0.133 -0.10 0.201
 Diastolic blood pressure 0.20 0.013 0.06 0.438 0.21 0.008 0.09 0.284 -0.04 0.581 -0.09 0.258
 Timed up and go -0.34 <0.001 -0.16 0.041 -0.29 <0.001 -0.11 0.170 -0.13 0.095 -0.08 0.324
 Total cholesterol 0.17 0.032 0.13 0.108 0.12 0.131 0.07 0.362 -0.12 0.129 -0.13 0.113
 HDL-C -0.11 0.164 -0.12 0.126 -0.19 0.020 -0.20 0.011 0.07 0.413 0.06 0.452
 Triglyceride 0.31 <0.001 0.24 0.003 0.30 <0.001 0.22 0.006 -0.10 0.223 -0.11 0.162
 C-reactive protein -0.01 0.878 -0.0002 0.998 -0.04 0.591 -0.03 0.666 0.01 0.893 0.01 0.870
 Fasting glucose 0.18 0.028 0.14 0.080 0.14 0.069 0.11 0.189 -0.15 0.059 -0.13 0.098
 Insulin (logarithmic) 0.31 <0.001 0.31 <0.001 0.33 <0.001 0.33 <0.001 -0.50 <0.001 -0.50 <0.001
 HOMA-IR 0.28 <0.001 0.25 0.002 0.29 <0.001 0.26 0.001 -0.43 <0.001 -0.44 <0.001
Women (n=241)
 Age -0.56 <0.001 NA NA -0.44 <0.001 NA NA -0.18 0.005 NA NA
 Height 0.81 <0.001 0.72 <0.001 0.52 <0.001 0.36 <0.001 0.35 <0.001 0.29 <0.001
 Weight 0.84 <0.001 0.79 <0.001 0.79 <0.001 0.74 <0.001 -0.21 0.001 -0.34 <0.001
 Body mass index 0.57 <0.001 0.54 <0.001 0.69 <0.001 0.67 <0.001 -0.48 <0.001 -0.55 <0.001
 Systolic blood pressure -0.13 0.049 -0.02 0.741 -0.10 0.123 -0.01 0.833 -0.09 0.174 -0.06 0.341
 Diastolic blood pressure 0.17 0.007 0.09 0.147 0.13 0.046 0.06 0.342 -0.03 0.600 -0.07 0.306
 Timed up and go -0.42 <0.001 -0.17 0.010 -0.36 <0.001 -0.17 0.010 -0.19 0.004 -0.10 0.136
 Total cholesterol -0.05 0.436 -0.04 0.531 -0.05 0.439 -0.04 0.513 -0.15 0.021 -0.14 0.030
 HDL-C -0.09 0.155 -0.10 0.113 -0.12 0.054 -0.13 0.050 0.07 0.293 0.06 0.397
 Triglyceride 0.03 0.668 0.09 0.156 0.08 0.242 0.12 0.057 -0.10 0.141 -0.07 0.276
 C-reactive protein -0.05 0.482 -0.005 0.945 0.03 0.627 0.07 0.279 -0.15 0.019 -0.14 0.033
 Fasting glucose 0.04 0.565 0.09 0.150 0.05 0.424 0.10 0.142 -0.09 0.170 -0.08 0.228
 Insulin (logarithmic) 0.33 <0.001 0.33 <0.001 0.33 <0.001 0.32 <0.001 -0.29 <0.001 -0.32 <0.001
 HOMA-IR 0.25 <0.001 0.27 <0.001 0.26 <0.001 0.26 <0.001 -0.25 <0.001 -0.27 <0.001

ASM, appendicular skeletal muscle mass; NA, not available; HDL-C, high density lipoprotein cholesterol; HOMA-IR, homeostasis model assessment of insulin resistance.

Table 3

Multiple linear regression coefficients of ASM with homeostasis model assessment of insulin resistance

dmj-39-37-i003
Variable ASM ASM/height2 ASM/weight
Standardized coefficient Adjusted R2 P value Standardized coefficient Adjusted R2 P value Standardized coefficient Adjusted R2 P value
Total (n=339)
 Model 1 0.43 0.08 <0.001 0.36 0.08 <0.001 -0.50 0.13 <0.001
 Model 2 -0.43 0.27 <0.001 -0.32 0.29 <0.001 -0.26 0.27 <0.001
 Model 3 -0.50 0.29 0.001 -0.33 0.29 <0.001 -0.30 0.29 0.001
Men (n=158)
 Model 1 0.30 0.07 0.001 0.30 0.07 0.001 -0.45 0.20 <0.001
 Model 2 -0.40 0.36 <0.001 -0.40 0.36 <0.001 -0.25 0.35 0.001
 Model 3 -0.61 0.40 <0.001 -0.46 0.41 <0.001 -0.36 0.39 0.001
Women (n=241)
 Model 1 0.33 0.07 <0.001 0.29 0.06 <0.001 -0.27 0.07 <0.001
 Model 2 -0.24 0.20 0.036 -0.15 0.19 0.112 -0.13 0.20 0.032
 Model 3 -0.19 0.23 0.195 -0.14 0.23 0.161 -0.12 0.23 0.143

Model 1: adjusted for sex, age. Model 2: adjusted for sex, age, weight. Model 3: adjusted for sex, age, weight, height, smoking, alcohol intake, systolic blood pressure, triglyceride, total cholesterol, high density lipoprotein cholesterol, and C-reactive protein.

ASM, appendicular skeletal muscle mass.

ACKNOWLEDGMENTS

This work was supported by the National Research Foundation of Korea Grant (NRF-2011-330-B00137) and the Korean Health Technology R&D Project, Ministry of Health and Welfare (HI13C0715), Republic of Korea.

Notes

No potential conflict of interest relevant to this article was reported.

References

1. Rosenberg IH. Sarcopenia: origins and clinical relevance. J Nutr. 1997; 127:5 Suppl. 990S–991S.
2. Abe T, Ogawa M, Loenneke JP, Thiebaud RS, Loftin M, Mitsukawa N. Relationship between site-specific loss of thigh muscle and gait performance in women: the HIREGASAKI study. Arch Gerontol Geriatr. 2012; 55:e21–e25.
3. Amigues I, Schott AM, Amine M, Gelas-Dore B, Veerabudun K, Paillaud E, Beauchet O, Rolland Y, Canoui Poitrine F, Bonnefoy M. Low skeletal muscle mass and risk of functional decline in elderly community-dwelling women: the prospective EPIDOS study. J Am Med Dir Assoc. 2013; 14:352–357.
4. Visser M, Kritchevsky SB, Goodpaster BH, Newman AB, Nevitt M, Stamm E, Harris TB. Leg muscle mass and composition in relation to lower extremity performance in men and women aged 70 to 79: the health, aging and body composition study. J Am Geriatr Soc. 2002; 50:897–904.
5. Abbatecola AM, Paolisso G, Fattoretti P, Evans WJ, Fiore V, Dicioccio L, Lattanzio F. Discovering pathways of sarcopenia in older adults: a role for insulin resistance on mitochondria dysfunction. J Nutr Health Aging. 2011; 15:890–895.
6. Solerte SB, Gazzaruso C, Bonacasa R, Rondanelli M, Zamboni M, Basso C, Locatelli E, Schifino N, Giustina A, Fioravanti M. Nutritional supplements with oral amino acid mixtures increases whole-body lean mass and insulin sensitivity in elderly subjects with sarcopenia. Am J Cardiol. 2008; 101(11A):69E–77E.
7. Pahor M, Kritchevsky S. Research hypotheses on muscle wasting, aging, loss of function and disability. J Nutr Health Aging. 1998; 2:97–100.
8. Cesari M, Kritchevsky SB, Baumgartner RN, Atkinson HH, Penninx BW, Lenchik L, Palla SL, Ambrosius WT, Tracy RP, Pahor M. Sarcopenia, obesity, and inflammation: results from the Trial of Angiotensin Converting Enzyme Inhibition and Novel Cardiovascular Risk Factors study. Am J Clin Nutr. 2005; 82:428–434.
9. Jensen GL. Inflammation: roles in aging and sarcopenia. JPEN J Parenter Enteral Nutr. 2008; 32:656–659.
10. Roubenoff R. Physical activity, inflammation, and muscle loss. Nutr Rev. 2007; 65(12 Pt 2):S208–S212.
11. Semba RD, Ferrucci L, Sun K, Walston J, Varadhan R, Guralnik JM, Fried LP. Oxidative stress and severe walking disability among older women. Am J Med. 2007; 120:1084–1089.
12. Ochi M, Kohara K, Tabara Y, Kido T, Uetani E, Ochi N, Igase M, Miki T. Arterial stiffness is associated with low thigh muscle mass in middle-aged to elderly men. Atherosclerosis. 2010; 212:327–332.
13. Fielding RA, Vellas B, Evans WJ, Bhasin S, Morley JE, Newman AB, Abellan van, Andrieu S, Bauer J, Breuille D, Cederholm T, Chandler J, De Meynard C, Donini L, Harris T, Kannt A, Keime Guibert F, Onder G, Papanicolaou D, Rolland Y, Rooks D, Sieber C, Souhami E, Verlaan S, Zamboni M. International working group on sarcopenia. Sarcopenia: an undiagnosed condition in older adults. Current consensus definition: prevalence, etiology, and consequences. J Am Med Dir Assoc. 2011; 12:249–256.
14. Schatten GP. Chapter 5, Sarcopenia of aging and its metabolic impact. Current topics in developmental biology, volume 68. Burlington: Elsevier;2005. p. 123–148.
15. Yang EJ, Lim S, Lim JY, Kim KW, Jang HC, Paik NJ. Association between muscle strength and metabolic syndrome in older Korean men and women: the Korean Longitudinal Study on Health and Aging. Metabolism. 2012; 61:317–324.
16. Srikanthan P, Hevener AL, Karlamangla AS. Sarcopenia exacerbates obesity-associated insulin resistance and dysglycemia: findings from the National Health and Nutrition Examination Survey III. PLoS One. 2010; 5:e10805.
17. DeFronzo RA, Jacot E, Jequier E, Maeder E, Wahren J, Felber JP. The effect of insulin on the disposal of intravenous glucose. Results from indirect calorimetry and hepatic and femoral venous catheterization. Diabetes. 1981; 30:1000–1007.
18. Matthews DR, Hosker JP, Rudenski AS, Naylor BA, Treacher DF, Turner RC. Homeostasis model assessment: insulin resistance and beta-cell function from fasting plasma glucose and insulin concentrations in man. Diabetologia. 1985; 28:412–419.
19. Kim YS, Lee Y, Chung YS, Lee DJ, Joo NS, Hong D, Song G, Kim HJ, Choi YJ, Kim KM. Prevalence of sarcopenia and sarcopenic obesity in the Korean population based on the Fourth Korean National Health and Nutritional Examination Surveys. J Gerontol A Biol Sci Med Sci. 2012; 67:1107–1113.
20. Kim TN, Yang SJ, Yoo HJ, Lim KI, Kang HJ, Song W, Seo JA, Kim SG, Kim NH, Baik SH, Choi DS, Choi KM. Prevalence of sarcopenia and sarcopenic obesity in Korean adults: the Korean sarcopenic obesity study. Int J Obes (Lond). 2009; 33:885–892.
21. Chen LK, Liu LK, Woo J, Assantachai P, Auyeung TW, Bahyah KS, Chou MY, Chen LY, Hsu PS, Krairit O, Lee JS, Lee WJ, Lee Y, Liang CK, Limpawattana P, Lin CS, Peng LN, Satake S, Suzuki T, Won CW, Wu CH, Wu SN, Zhang T, Zeng P, Akishita M, Arai H. Sarcopenia in Asia: consensus report of the Asian Working Group for Sarcopenia. J Am Med Dir Assoc. 2014; 15:95–101.
22. Srikanthan P, Karlamangla AS. Relative muscle mass is inversely associated with insulin resistance and prediabetes. Findings from the third National Health and Nutrition Examination Survey. J Clin Endocrinol Metab. 2011; 96:2898–2903.
23. Moon SS. Low skeletal muscle mass is associated with insulin resistance, diabetes, and metabolic syndrome in the Korean population: the Korea National Health and Nutrition Examination Survey (KNHANES) 2009-2010. Endocr J. 2014; 61:61–70.
24. Kim TN, Park MS, Lim KI, Choi HY, Yang SJ, Yoo HJ, Kang HJ, Song W, Choi H, Baik SH, Choi DS, Choi KM. Relationships between sarcopenic obesity and insulin resistance, inflammation, and vitamin D status: the Korean Sarcopenic Obesity Study. Clin Endocrinol (Oxf). 2013; 78:525–532.
25. Aleman-Mateo H, Lopez Teros MT, Ramirez FA, Astiazaran-Garcia H. Association between insulin resistance and low relative appendicular skeletal muscle mass: evidence from a cohort study in community-dwelling older men and women participants. J Gerontol A Biol Sci Med Sci. 2014; 69:871–877.
26. Kuk JL, Kilpatrick K, Davidson LE, Hudson R, Ross R. Whole-body skeletal muscle mass is not related to glucose tolerance or insulin sensitivity in overweight and obese men and women. Appl Physiol Nutr Metab. 2008; 33:769–774.
27. Lim S, Kim JH, Yoon JW, Kang SM, Choi SH, Park YJ, Kim KW, Lim JY, Park KS, Jang HC. Sarcopenic obesity: prevalence and association with metabolic syndrome in the Korean Longitudinal Study on Health and Aging (KLoSHA). Diabetes Care. 2010; 33:1652–1654.
28. Bijlsma AY, Meskers CG, van Heemst D, Westendorp RG, deCraen AJ, Maier AB. Diagnostic criteria for sarcopenia relate differently to insulin resistance. Age (Dordr). 2013; 35:2367–2375.
29. Abellan van Kan G, Rolland Y, Bergman H, Morley JE, Kritchevsky SB, Vellas B. The I.A.N.A Task Force on frailty assessment of older people in clinical practice. J Nutr Health Aging. 2008; 12:29–37.
30. Amati F, Dube JJ, Coen PM, Stefanovic-Racic M, Toledo FG, Goodpaster BH. Physical inactivity and obesity underlie the insulin resistance of aging. Diabetes Care. 2009; 32:1547–1549.
31. Johannsen DL, Conley KE, Bajpeyi S, Punyanitya M, Gallagher D, Zhang Z, Covington J, Smith SR, Ravussin E. Ectopic lipid accumulation and reduced glucose tolerance in elderly adults are accompanied by altered skeletal muscle mitochondrial activity. J Clin Endocrinol Metab. 2012; 97:242–250.
32. Phielix E, Szendroedi J, Roden M. Mitochondrial function and insulin resistance during aging: a mini-review. Gerontology. 2011; 57:387–396.
33. Kim JH, Choi SH, Lim S, Kim KW, Lim JY, Cho NH, Park KS, Jang HC. Assessment of appendicular skeletal muscle mass by bioimpedance in older community-dwelling Korean adults. Arch Gerontol Geriatr. 2014; 58:303–307.
34. Lu CW, Yang KC, Chang HH, Lee LT, Chen CY, Huang KC. Sarcopenic obesity is closely associated with metabolic syndrome. Obes Res Clin Pract. 2013; 7:e301–e307.
TOOLS
Similar articles