

 PDF
PDF ePub
ePub Citation
 Print
Print


INTRODUCTION
Diabetic kidney disease is the most common cause of chronic kidney disease, leading to end-stage renal disease (ESRD) and premature death [1]. In addition, it negatively affects a patient's quality of life and social environment, and poses a burden on national health care budgets [2]. Although various therapeutic approaches, such as hypoglycemic agents, antihypertensive drugs, and renin-angiotensin system inhibitors, have been tried to slow the progression of nephropathy, the number of patients with diabetic kidney disease continues to rise with the prevalence of type 2 diabetes mellitus [3]. Thus, early identification of patients at risk of developing diabetic nephropathy and initiation of appropriate therapy is important to improve patient outcomes.
Ceruloplasmin, a copper-carrying metalloenzyme, acts as an antioxidant through its ferroxidase activity [4]. However, in conditions of elevated oxidative stress, it may act as a pro-oxidant by donating of free copper ions, which induces reactive oxygen species (ROS) formation and low density lipoprotein (LDL) oxidation [5]. In addition, as an acute phase protein, the ceruloplasmin level reflects acute and chronic inflammation in an organism [5]. Elevated serum ceruloplasmin levels have been observed in both type 1 and type 2 diabetes [67] and in patients with diabetic retinopathy [8]. In line with that, in our previous cross-sectional study, we observed a positive association between serum ceruloplasmin level and albuminuria in patients with type 2 diabetes mellitus [9]. However, longitudinal studies investigating the association between serum ceruloplasmin and development of diabetic nephropathy had not been conducted. Thus, to evaluate the role of serum ceruloplasmin as a biomarker for predicting progression of diabetic nephropathy, we conducted this longitudinal observational study.
METHODS
Study population
Study subjects were recruited from an outpatient clinic at a major referral center, Asan Medical Center (Seoul, Korea). A total of 703 patients whose serum ceruloplasmin levels were measured were followed up from January 2009 through December 2013. Ceruloplasmin were measured in patients with type 2 diabetes mellitus who visited our diabetes clinic for the first time after registration at the Asan Diabetes Registry as well as in patients with type 2 diabetes mellitus who underwent screening tests for diabetic microvascular complications regularly every 1 to 2 years. There was no doctor's intention in the recruitment process.
All patients visited the diabetes clinic on a regular basis (every 3 or 6 months). Subjects with histories of chronic inflammatory processes (n=1, ulcerative colitis; n=2, rheumatoid arthritis) or liver cirrhosis (n=6; due to hepatitis B infection in four cases and alcohol use in two cases), and those with leukocytosis or leukopenia (blood leukocyte count >10.0×10³/mm3 or <4.0×10³/mm3, n=51) at baseline were excluded. After the exclusion of ineligible subjects, 643 subjects with a mean age of 57.0 years (range, 24 to 86 years) were included in the analysis. The Institutional Review Board of Asan Medical Center approved this retrospective observational study, and waived for requirement of written informed consent because personal information was not included in this analysis and risk of this study was considered to be negligible.
Lifestyle factors and measurements
All participants were interviewed by a specially trained nurse, and information on medication and history of previous medical or surgical diseases was obtained. Smoking habits were categorized as "never," "previous," or "current." A history of cardiovascular disease (CVD) was defined as a history of angina, myocardial infarction, and/or cerebrovascular incidents. Antidiabetic treatments were categorized as none, oral hypoglycemic agents (OHAs), insulin, or insulin combined with OHAs. The antihypertensive medications that subjects were taking were categorized as angiotensin-converting enzyme inhibitors (ACEi), angiotensin II receptor blockers (ARBs), or others (β-blockers, calcium-channel blockers, diuretics, or α-blockers). Height (m) and weight (kg) were measured while subjects were wearing light clothing without shoes. Body mass index (BMI, kg/m2) was calculated as weight in kilograms divided by the square of height in meters. Blood pressure was measured using an automatic manometer with an appropriate cuff size on the right arm after a resting period of ≥5 minutes at intervals of 6 months, and mean systolic blood pressure (SBP) and diastolic blood pressure (DBP) values for the observation period were used as follow-up data. The presence of retinopathy was assessed by retinal photography (two fields per eye) with a wide-angle camera and scored centrally by an ophthalmologist.
After overnight fasting, early morning blood samples were drawn from the antecubital vein. Fasting total cholesterol, high density lipoprotein cholesterol, LDL cholesterol (LDL-C), triglyceride (TG), and uric acid levels were measured using an enzymatic colorimetric method (Toshiba Medical System Co., Ltd., Tokyo, Japan). High sensitivity C-reactive protein (hsCRP) and fasting plasma glucose (FPG) concentrations were measured using immunoturbidimetric (Toshiba) and enzymatic colorimetric (Toshiba) methods, respectively. Glycosylated hemoglobin (HbA1c) was measured using an immunoturbidimetric method and an Integra 800 System (Roche Diagnostics, Basel, Switzerland) every 6 months, and calculated mean HbA1c values for the observation period were used as follow-up data.
The extent of albuminuria was determined from the urinary albumin-to-creatinine ratio (UACR), which was measured by a photometric method using the Integra 800 system (Roche Diagnostics) in a random spot urine collection. The category of albuminuria was defined as normoalbuminuria if the UACR was <30 mg/g, microalbuminuria if the UACR was 30 to 299 mg/g, and macroalbuminuria if the UACR was ≥300 mg/g [10]. Creatinine was measured using the Jaffe method, and estimated glomerular filtration rate (eGFR) was calculated using the Modification of Diet in Renal Disease study equation [11]. Serum ceruloplasmin level was measured using a nephelometric method (BN II System; Siemens, Marburg, Germany).
Definition of diabetic nephropathy progression
The outcome in terms of "progression of diabetic nephropathy" was defined as transition in albuminuria class (i.e., normo- to microalbuminuria, micro- to macroalbuminuria, or normo- to macroalbuminuria) and/or a greater than 2-fold increase in serum creatinine at follow-up compared with the baseline value. Transition in albuminuria class and doubling of creatinine value were confirmed by at least two consecutive tests to reduce misclassification.
Statistical analyses
Subjects were categorized into three tertile groups (i.e., Q1 ≤219 mg/L, Q2=220 to 249 mg/L, and Q3 ≥250 mg/L) according to the baseline ceruloplasmin concentration. Continuous variables with a normal distribution were expressed as the mean±standard deviation, and continuous variables with a skewed distribution were expressed as the median (interquartile range). Categorical variables were expressed as percentages (%). Characteristics of the study population according to ceruloplasmin tertile categories were compared using one-way analysis of variance or the Kruskal-Wallis test for continuous variables, and the chi-square test for categorical variables.
Demographic and biochemical characteristics of the study population with respect to the progression of diabetic nephropathy were compared using an independent t-test or the Mann-Whitney U test for continuous variables, and the chi-square test for categorical variables. Time to progression of diabetic nephropathy was estimated by the Kaplan-Meier method and statistical differences among groups were compared by the log-rank test. The follow-up time was censored if diabetic nephropathy progressed or if the patient was lost to follow-up. To calculate the hazard ratios (HRs) and 95% confidence intervals (CIs) of each ceruloplasmin tertile category for the development of diabetic nephropathy, multivariate Cox proportional hazard models were applied after adjustment for conventional risk factors of diabetic nephropathy. Traditional diabetic nephropathy risk factors were included in model 1 and factors that showed a statistically significant (P<0.05) or borderline significant (P<0.10) associations in the univariate analysis were included in model 2. All the variables in models 1 and 2 were included in model 3.
All statistical analyses were carried out using SPSS version 19.0 (SPSS Inc., Chicago, IL, USA). A P value of <0.05 was considered statistically significant.
RESULTS
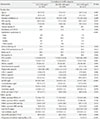
Table 1 shows the clinical and biochemical characteristic of the subjects according to serum ceruloplasmin tertile category at baseline. There were significant positive associations between ceruloplasmin tertile category and SBP, current smoking status, HbA1c, total cholesterol, LDL-C, hsCRP, UACR, and percentage of subjects using insulin therapy at baseline. There was a borderline significant positive association between ceruloplasmin tertile and the prevalence of retinopathy at baseline. Among follow-up data, UACR measured at the time of last follow-up or at event occurrence increased according to ceruloplasmin tertile.
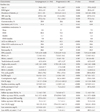
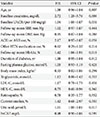
During the follow-up period (median, 2.7 years; range, 0.3 to 4.4 years), 49 of 643 patients (7.6%) showed the progression of diabetic nephropathy and three patients (0.5%) developed ESRD. The clinical and biochemical characteristics at baseline and during follow-up for progressors and non-progressors are shown in Table 2. Duration of diabetes was significantly longer in progressors compared with nonprogressors. Progressors tended to use of insulin therapy and ACEi or ARB at baseline more frequently than nonprogressors. The percentage of subjects taking other antihypertensive medication tended to be higher in progressors, with borderline statistical significance. Progressors had significantly higher levels of uric acid, hsCRP, UACR, and creatinine at baseline, but a lower eGFR compared with non-progressors. They had higher values of total cholesterol and TG at baseline, although the associations were borderline significant. Baseline ceruloplasmin levels were significantly higher in the progressors than in the non-progressors (262.6±40.9 mg/L vs. 233.3±37.8 mg/L, P<0.001). During the follow-up period, the two groups did not differ in terms of mean SBP and DBP, but mean HbA1c was significantly higher in progressors than nonprogressors. At the time of event occurrence or the last observation, the progressors had higher UACR and creatinine, but lower eGFR compared with nonprogressors (all P values <0.001).
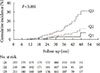
Kaplan-Meier analysis demonstrated a significantly higher incidence of progression of diabetic nephropathy according to baseline ceruloplasmin tertile (log-rank test, P<0.001) (Fig. 1). Above all, subjects in Q3 showed a significantly increasing trend of diabetic nephropathy progression compared with Q1 and Q2 (Q1 vs. Q3, P<0.001; Q2 vs. Q3, P=0.002). No difference was found between Q1 and Q2 (P=0.167).
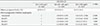
When we performed multivariate Cox regression analysis adopting various models, the HRs for progression of diabetic nephropathy according to baseline ceruloplasmin tertile category consistently showed an increasing trend (Table 3). In the unadjusted model, the HRs and 95% CIs based on ceruloplasmin tertile groups were 1.95 (0.73 to 5.19) for Q2, and 5.41 (2.30 to 12.96) for Q3, respectively (P<0.001), with Q1 as reference. After adjusting for confounding variables including age, BMI, duration of diabetes, current smoker, past history of CVD, antidiabetic medication, ACEi or ARB use, other HTN medication, retinopathy, FPG, total cholesterol, uric acid, hsCRP, baseline UACR, baseline creatinine, follow-up mean HbA1c, follow-up mean SBP and follow-up mean DBP, the HRs (95% CI) for progression of diabetic nephropathy were 1.14 (0.38 to 3.40) for Q2 and 3.14 (1.21 to 8.10) for Q3, respectively (P=0.010). Besides baseline ceruloplasmin, baseline creatinine, baseline UACR, follow-up mean HbA1c, and uric acid were predictive factors for the development of diabetic nephropathy in model 3 (Table 4).
DISCUSSION
Diabetic nephropathy is a leading cause of ESRD and greatly contributes to all-cause mortality in type 2 diabetes [1]. To slow the progression of diabetic nephropathy, early detection and treatment of those patients at risk of developing nephropathy is regarded as an important goal [12]. Recently, several novel biomarkers have been investigated to predict nephropathy in patients with type 2 diabetes. However there were few longitudinal studies with suitable methodological quality that properly adjusted for traditional conventional risk factors for diabetic nephropathy [12].
In this longitudinal observational study, elevated ceruloplasmin levels at baseline were found to be positively associated with progression of diabetic nephropathy. After adjusting for conventional risk factors, ceruloplasmin levels still remained an independent risk factor for the progression of diabetic nephropathy. This result indicates that an elevated ceruloplasmin level might be a strong predictor of diabetic nephropathy progression.
The exact mechanism underlying this positive association between ceruloplasmin levels and progression of diabetic nephropathy is largely unknown. One plausible explanation is that ceruloplasmin might act as a pro-oxidant under conditions of increased oxidative stress, such as in type 2 diabetes mellitus [8]. Although ceruloplasmin possesses antioxidant properties due to its ferroxidase activity [4], increased generation of ROS disrupts the binding of copper from ceruloplasmin which further induces ROS formation and LDL oxidation [5]. Considering that increased oxidative stress and oxidized LDL are known to be associated with progression of diabetic kidney disease [13], elevated ceruloplasmin level might reflect or augment progression of diabetic nephropathy.
In addition, as an acute phase protein, ceruloplasmin might reflect subclinical inflammation, which plays a critical role in the pathogenesis of diabetic nephropathy [14]. Navarro et al. [15] reported that inflammatory parameters including hsCRP are independently associated with urinary albumin excretion. However, when we performed multivariate Cox regression analysis, serum hsCRP levels were not associated with the progression of diabetic nephropathy (HR, 0.98; 95% CI, 0.90 to 1.06; P=0.590) (Table 4), which contrasts with the results of a previous study [15]. Although the reasons for these discrepancies are unclear, we suspect that, compared with hsCRP, elevated ceruloplasmin might reflect chronic subclinical inflammation more sensitively or play a more important role in the progression of diabetic nephropathy.
In multivariate Cox regression analysis, baseline creatinine, UACR, and follow-up mean HbA1c were found to be predictive factors for the progression of diabetic nephropathy, which is in line with previous studies [161718]. However, multivariate Cox regression analysis did not indicate that SBP was an independent predictor of progressive diabetic nephropathy, which was inconsistent with previous studies [19]. Since progressors tend to take ACEi or ARB and other hypertension medication at baseline more often than non-progressors, the difference in hypertensive medications between groups during the follow-up period might affect this outcome.
Furthermore, in our study, an increased baseline uric acid level was predictive for the progression of diabetic nephropathy, which is in accordance with previous studies [1820]. Several studies showed that high uric acid level as well as ceruloplasmin was associated with increased oxidative stress [521], but further study is need to clarify the connections between those biomarkers and mechanisms of how they contributes to diabetic nephropathy.
Although not statistically significant, we observed a tendency for eGFR to be increased in patients with the highest ceruloplasmin tertile category (Table 1). Since glomerular hyperfiltration usually occurs in early stages of diabetic nephropathy [22], it can be speculated that an elevated eGFR in the highest tertile category might reflect the early stages of renal dysfunction. Long-term extension studies will be required to evaluate the association between serum ceruloplasmin and changes in eGFR.
This study has several limitations. First, we investigated the relationship between ceruloplasmin and progression of diabetic nephropathy only in men. Since medications such as oral contraceptives can affect ceruloplasmin levels [23], women were not included in this study and the result cannot be generalized to both sexes. Second, although we postulated that dissociated free copper, ROS, and oxidized LDL might play a role in ceruloplasmin-mediated diabetic nephropathy, we did not measure these values. Considering the previous report that ceruloplasmin was positively correlated with makers of ROS under the oxidative stress conditions [24], it might be better to measure oxidative stress makers as well as the level of ceruloplasmin in our study. Third, in this study, ceruloplasmin was measured by nephelometry. It has been suggested that the ratio of enzymatic to immunoreactive ceruloplasmin is a better indicator of copper status than either enzyme activity or immunoreactive ceruloplasmin level alone [25]. Thus, it might be better to assess ceruloplasmin using both methods. Forth, since increased urinary excretions of ceruloplasmin also predicted development of microalbuminuria in type 2 diabetic patients [26], concurrent measure of serum and urinary ceruloplasmin might be beneficial to evaluate the association between these markers, but we did not measure the level of urinary ceruloplasmin. In addition, we did not measure follow-up ceruloplasmin values and could not evaluate whether participants remained in initially allocated tertile category at the end of study. Lastly, to evaluate the long-term prognosis, it might be better to evaluate the occurrence of ESRD or death rather than transition of albuminuria class as the primary outcome. Although three patients developed ESRD (one event in group Q1, two events in group Q3) in this study, long-term follow-up of large numbers of subjects will be required to evaluate the ultimate outcome.
Despite these limitations, our study has some robust features, in that we properly adjusted for various conventional risk factors that might affect the progression of diabetic nephropathy. It should be noted that the predictive value of ceruloplasmin in our Cox model was found to be equal to or even stronger than that of well-known risk factors for the progression of diabetic nephropathy, including hyperglycemia, baseline creatinine, UACR, and uric acid. Furthermore, we observed that the number of subjects who exceeded a 2-fold increase of creatinine at follow-up tended to rise with ceruloplasmin tertile group (one event in group Q1, three events in group Q2, and six events in group Q3). Although this subgroup analysis was not statistically significant, due to the small number of events, this result prompts further investigation of the possibility that an increased ceruloplasmin level predicts renal dysfunction as well as transition in albuminuria class.
Albuminuria has been traditionally considered as the hallmark for diabetic nephropathy [27], but recent studies showed that one third to one half of type 2 diabetes with chronic kidney disease have no proteinuria [2829]. Although it is not widely available in clinical practice, measurements of serum ceruloplasmin might be used to compensate this limitation of 'albuminuria' as a predictive marker for diabetic nephropathy. To evaluate the predictive role of ceruloplasmin on progression of 'nonalbuminuric diabetic nephropathy,' further study will be required.
In conclusion, these data suggest that an elevated serum ceruloplasmin is a strong prognostic marker for progression of diabetic nephropathy in patients with type 2 diabetes mellitus. This effect remains significant even after adjustment for conventional risk factors for diabetic nephropathy. Therefore, measuring ceruloplasmin levels in addition to UACR might be used for early identification of patients at risk of diabetic nephropathy in order to initiate appropriate therapy.
 XML Download