

 PDF
PDF ePub
ePub Citation
 Print
Print


INTRODUCTION
Type 2 diabetes mellitus (T2DM) is the most common endocrine disease. It is a complex disease characterized by hyperglycemia and is associated with long-term diabetic complications, such as diabetic retinopathy (DR), nephropathy, and neuropathy. The diagnosis of T2DM has been based on fasting plasma glucose (FPG) levels or 2-hour plasma glucose levels after an oral glucose tolerance test (OGTT) [1]. Recently, glycated hemoglobin (HbA1c, A1C) ≥6.5% was recommended for the diagnosis of T2DM by a leading diabetes organization [2,3] and the World Health Organization [4]. The most important reason to define T2DM is to identify persons with a high risk for diabetes complications. The association between A1C and cardiovascular diseases has been found in a glucose range usually considered to be nondiabetic [5,6], and there might be no threshold or a threshold below the prediabetic range [7]. For other diabetic microvascular complications except for DR, the association with A1C was linear without evidence of a distinct threshold [8]. In this paper, we will first review the history of A1C measurement and then review the studies for determining the optimal cutoff value for A1C in the presence of DR.
HISTORY OF A1C MEASUREMENT
The heterogeneity of human hemoglobin (Hb) was demonstrated for the first time in 1958 using cation exchange chromatography [9]. The unexpected elution of Hb peaks (HbA1) before the major HbA fraction (HbA0) was found, and these peaks were designated as HbA1a to HbA1e based on the chromatographic elution order [10]. The HbA1 fraction results from the binding of various adducts to HbA. In 1962, Huisman and Dozy [11] reported an increase in the HbA1 fraction in red blood cells from patients with DM. In 1968, Rahbar [12] had shown an elevated percentage of A1C compared to total Hb in patients with DM. In the late 1970s, sugars or sugar phosphates were found to form HbA1, which is incidentally A1C [13]. Glucose was identified to generate A1C, which was shown to be an Amadori product formed by the irreversible binding of glucose to the β-N-terminal valine residues of globin changes [14] during the 120-day lifespan of the erythrocytes [15]. The close relationship between A1C values and glucose control resulted in the periodic monitoring of A1C for glycemic control [16,17]. The epidemiologic studies of the Diabetes Control and Complications Trial [18] and the United Kingdom Prospective Diabetes Study [19] demonstrated a link between A1C and chronic diabetic complications.
There have been various methods based on different principles (i.e., ion-exchange chromatography, affinity chromatography, electrophoresis, colorimetric assay, and immunoassay) and methodologies (i.e., micro- and minicolumn chromatography, low-pressure liquid chromatography, high-pressure liquid chromatography, manual assays, and automated assays) without standardized procedures [20]. In the United States, the National Glycohemoglobin Standardization Program (NGSP) formed an efficient network of laboratories, monitored by a committee [21], but the reference system supporting the NSGP standardization was not appropriate to support the long-term international standardization of the assay [22]. Therefore, the International Federation of Clinical Chemistry and Laboratory Medicine-Working Group (IFCC-WG) proposed a reference, which was used to establish an internally approved IFCC reference method for A1C [23]. The IFCC recommended changing the A1C units from a percentage of A1C to total Hb ("NGSP units") to a molar ratio of A1C to HbA0 in mmol/mol (SI units, of "IFCC units") [24].
THE OPTIMAL CUTOFF VALUE FOR A1C IN DIABETIC RETINOPATHY
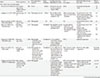
Ideally, the optimal cutoff value of A1C to diagnose diabetes is determined in a way that individuals with A1C levels above the cutoff value have a much larger probability of having or developing a diabetic complication, and individuals with A1C levels below the cutoff value have a much lower probability of having or getting diabetic complications. Three cross-sectional epidemiological studies that included Pima Indians [25], an Egyptian population [26], and the third National Health and Nutrition Examination Survey (NHANES) population in the United States [27] showed glycemic levels below which there was a low prevalence of DR and above which the prevalence of DR increased in an apparently linear fashion. The prevalence of DR rose abruptly in the highest decile of each variable, corresponding to FPG ≥120 mg/dL, 2-hour plasma glucose ≥195 mg/dL, and A1C ≥6.2% [25,26]. With standardization of measurement for A1C, the International Expert Committee Report (IECP) in 2009 [2], the American Diabetes Association in 2010 [3], and the WHO in 2011 [4] recommended incorporating A1C ≥6.5% into the previous diagnostic criteria formed by FPG and/or 2-hour plasma glucose. There have been several studies about the optimal cutoff value for A1C in DR. While most of them are cross-sectional studies [8,25,26,27,28,29,30,31,32,33,34,35,36,37,38,39], only few of them are longitudinal studies (Table 1) [25,38,40,41]. The results for each study are described below in chronological order.
Cross-sectional studies
Studies in the 1990s
In 1994, a Pima Indian study showed a threshold value of A1C between the 80th (6.5%) and 90th percentiles (7.5%), below which DR is absent or rare and above which the prevalence is considerably higher, with 960 Pima Indians not taking antihyperglycemic agents or insulin [25]. This study also demonstrated that the optimal cutoff value of A1C was 7.0%, which produced the highest sum of sensitivity (78.1%) and specificity (84.7%) using a point-wise area under the receiver operating characteristic curve (ROC). In this study, a direct ophthalmoscopic examination through a dilated pupil was performed by a physician. In 1997, an Egyptian study found that the optimal cutoff of HbA1c was approximately 6.9% (n=1,018) [26]. After excluding subjects taking antihyperglycemic medication, the optimal cutoff of HbA1c was approximately 7.5%. In this study, only one retinal photograph was taken per eye. In 1997, the Expert Committee on the Diagnosis and Classification of Diabetes Mellitus in the United States reported that an A1C of 6.2% was the optimal cutoff for predicting DR in the analysis of the third NHANES population (n=2,821) [27]. In this study, only one retinal photograph was taken per eye.
Studies in the 2000s
In 2004, the Hisayama study [36] showed that the prevalence of DR dramatically increased in the tenth decile of A1C (5.5% to 5.7%), and the optimal cutoff level for DR was 5.7% for A1C by ROC analysis (86.5% sensitivity, 90.1% specificity) in a Japanese population (n=1,637). In this study, fundus photographs (45°) were taken, and DR was defined as the presence of any mild nonproliferative DR or more severe DR.
In 2006, the Australian Diabetes Obesity and Lifestyle (AusDiab) study, conducted in 1999 to 2000, included subjects ≥25 years of age (n=2,182; 34.5% diabetes, 46.6% impaired glucose tolerance or impaired fasting glucose) and found that above the top 2 deciles of A1C, the prevalence of DR rose markedly and the threshold for increasing the prevalence of DR was 6.1% [32]. In this study, using different analysis methods and/or adjustments, the threshold was changed. Using the change-point model, the threshold was 5.2%. After adjusting for age, sex, and blood pressure, the threshold was changed to 5.6%. After further adjusting for diabetes duration, the threshold was changed to 6.0%. In this study, retinal photographs were taken with a nonmydriatic retinal camera. The level of DR was defined according to a simplified version of the Wisconsin grading system [42]. DR was defined as the presence of at least one definite retinal hemorrhage and or microaneurysm.
In 2009, a Singapore study of 3,190 Malay adults aged 40 to 80 years showed that the optimal cutoff values for mild DR (Early Treatment Diabetic Retinopathy Study [ETDRS] >20) and moderate DR (ETDRS >43) were 6.6% (87.0% sensitivity, 77.1% specificity) and 7.0% (82.9% sensitivity, 82.3% specificity), respectively. The prevalences of mild and moderate DR were <1% below the optimal cutoff values. In this study, after pupil dilatation, two photographs were taken of both eyes of each participant using a digital retinal camera [8].
In 2009, a report including 1,066 individuals aged ≥40 years from the 2005 to 2006 NHANES showed that the steepest increase in DR prevalence occurred among individuals with an A1C ≥5.5%, using Joint point regression analysis [29]. In this study, two 45° nonmydriatic color digital images of the retina were taken of each eye. DR was defined as a level ≥14 on the ETDRS severity scale [43].
Recent Western studies
In 2011, the Atherosclerosis Risk in Communities (ARIC) study did not find a threshold value for A1C in DR in middle-aged Americans without diabetes using a cubic spline model. The study showed that in the absence of diagnosed diabetes, A1C was cross-sectionally associated with the presence of moderate/severe DR (ETDRS ≥35), with adjusted odds ratios of 1.42 (0.69 to 2.92) and 2.91 (1.19 to 7.11) for A1C 5.7% to <6.5% and ≥6.5%, respectively, compared to <5.7% (P trend=0.011). In this study, the relationship between A1C and DR was different according to the presence of diabetes, and there was a strong association with mild DR (ETDRS 14 to 20) in patients with diabetes and weak or no association with mild DR in patients without diabetes [31].
In 2011, the DETECT-2 collaboration study [30], using a data-pooling analysis of nine studies from five countries with 44,623 participants aged 20 to 79 years with gradable retinal photographs, showed that the diabetes-specific retinopathy prevalence (moderate/severe DR, ETDRS 40 to 47/50 to 53) was low for A1C <6.0% but increased above this level. Based on vigintile (20 groups with equal numbers) distributions, the A1C threshold for diabetes-specific retinopathy was observed over the range of 6.3% to 6.7%. The threshold for diabetes-specific retinopathy based on ROC analysis was 6.4% for A1C.
Recent Asian studies
In 2012, a cross-sectional population-based study of 2,551 Chinese (representing a population of 1,660,500 in a Beijing district) between 19 to 79 years of age showed that the prevalence of DR increased in the ninth decile of A1C, corresponding to an A1C of ≥6.4% (85.1% sensitivity, 82.1% specificity) according to the Joint point regression method [39]. After excluding individuals receiving antihyperglycemic medication, the threshold increased up to 6.7% of A1C (60.7% sensitivity, 91.6% specificity). The cutoff points for A1C by maximizing the sensitivity and specificity were higher than by Joint point regression (6.8% of A1C, 85.1% sensitivity, 88.0% specificity in the total population; 6.9% of A1C, 60.7% sensitivity, 93.6% specificity in the subpopulation not receiving antihyperglycemic medications). In this study, two 45° color digital images of the retina were taken of each eye, and DR was defined as the presence of any mild nonproliferative DR or more severe DR.
In 2013, a Korean cross-sectional study including 3,403 adults from the Ansung Cohort Study showed that the optimal A1C cutoff for detecting any DR was 6.6% (76.2% sensitivity, 84.2% specificity) and was 6.9% for moderate or severe retinopathy (77.1% sensitivity, 88.7% specificity) in the ROC analysis [34]. In this study, DR was assessed with single-field 45 nonmydriatic fundus photography of each eye using a digital fundus camera and classified by the International Clinical Diabetic Retinopathy Disease Severity Scale.
In 2014, a report using data from the Korea National Health and Nutrition Examination Survey 2001 including 5,212 adults showed that the optimal A1C cutoff for detecting any DR was 6.2% (93.9% sensitivity, 89.7% specificity). In this study, retinal photographs were taken using a digital nonmydriatic fundus camera, and for each participant, one 45° retinal image was taken per eye (two images per person in total) [44].
Longitudinal studies
In 2003, the Hoorn study [41] investigated the effect of cardiovascular risk factors including A1C on the incidence of DR in 233 individuals aged 50 to 74 years who were not taking oral hyperglycemic agents or insulin, with an average follow-up of 9.4 years. The adjusted odds ratios for retinopathy were 2.36 for hypertension, 3.29 for the highest tertiles for A1C, and 8.67 for the highest tertiles for waist-hip ratio. The results showed no threshold for retinopathy using calculated odds ratios for DR by logistic regression.
In 2011, the French DESIR study, which included 700 participants who were evaluated for DR using a nonmydriatic digital camera (three images per eye), reported that over the preceding 9 years, 235 had diabetes, 227 had an impaired fasting glucose at least once, and 238 always had normal glucose levels. Additionally, the study showed that the positive predictive values for retinopathy increased sharply from 6.0% for A1C [40].
In 2012, an analysis of longitudinal data for 19,897 Japanese adults who underwent a health checkup and were followed up 3 years later showed a possible threshold for the risk of incident DR at A1C levels of 6.0% to 7.0% using the restricted cubic spline model, but there was no threshold in the analysis of prevalent retinopathy [38]. In this study, one digital photograph was taken per eye (total of two images per participant) through a nonpharmacologically dilated pupil.
Possible reasons for discrepancy among study results
In studies about the optimal cutoff value for A1C in DR in Western
people, the A1C values ranged from 5.2% to 7.8% [25,26,27,28,29,30,31,32,33,40,41], and in Asian people, the range was 5.5% to 7.2% [8,34,35,36,37,38,39]. There are several possible reasons why the optimal cutoff value of A1C for DR differs so widely in the studies thus far.
Difference in definition and/or methods for detecting DR
In most of the studies, the method for eye examination was a retinal photograph centered on the macular and optic nerve for each eye or one eye with or without pupil dilatation. Three earlier studies using direct opthalmoscopic examination or a retinal photograph of one field per eye (the Pima Indian study [25], the Egyptian study [26], and NHANES III [27]) reported that DR is uncommon within a normal FPG range. Additionally, in these earlier studies, there was a strong association of hyperglycemia with DR, and a sharp threshold of A1C was observed (7.0% in the Pima Indian study, 6.9% in the Egyptian study, and 6.2% in the NHANES III). A report of the 2005 to 2006 NHANES showed that the steepest increase in DR prevalence occurred among individuals with an A1C ≥5.5%, which was lower than that observed in some previous studies [29]. The authors suggested that one of the reasons could be that in their study, DR was assessed by two retinal photographs for each eye. Pooled analyses including three cross-sectional populations (the Blue Mountain Eye Study [45], the AusDiab study [32], and the Multi-Ethnic Study of Atherosclerosis [46]), using retinal photographs of multiple fields, reported inconsistent evidence for a uniform FPG threshold for prevalent and incident retinopathy, with analyses suggesting a continuous relationship [47]. Using retinal photographs of multiple fields in this pooled analysis, the authors reported that DR occurs in 7% to 13% of the population below the normal FPG range, that the association between FPG and DR was much weaker as indicated by ROC and that no sharp threshold could be observed anymore. These findings suggested that the sensitivity of the technique for DR could be one of the determinants for the optimal cutoff value for A1C in DR.
The optimal cutoff value for A1C in DR may also depend on the definition of DR; a study defined DR as the presence of at least one microaneurysm or hemorrhage [25], and other studies defined retinopathy using the modified Airlie House classification system, as used in the ETDRS [26,28,29,30,31,33,36,44]. However, although using the same ETDRS level, the definition for DR was different (ETDRS level ≥14 [29,31] or ≥15 [8]). While some studies investigated any retinopathy [25,26,29,31,32,33,36,37,39,40,41,44], some studies investigated moderate or more severe DR [28,30,38,48]. A Korean study and a Singapore study showed that the threshold for A1C was different according to the definition of DR; the threshold for A1C for any or mild retinopathy was lower than that for moderate retinopathy (6.5% for any DR, and 6.9% for moderate or more severe DR in a Korean study; 6.6% for mild DR, and 7.0% for moderate or more severe DR in a Singapore study) [8,34]. In studies between 2000 and 2014, the optimal cutoff value for any DR was 5.7% in the Hisayama Study [36], 6.1% in the AusDiab Study [32], 5.5% in the NHANES 2005 to 2006 [29], 6.4% in a Chinese study [39], and 6.2% in the Korean NHANES [44], and for moderate or more severe DR, it was 6.4% in the DETECT-2 study [30].
Variation in statistical methods
There are several statistical methods to determine the optimal cutoff value for A1C in DR, including visual inspection, change-point model, regression model (logistic, and Joint point), restricted cubic spline analysis, and ROC analysis. The cutoff value for A1C varied even for the same data when different methods were applied [25,30,32,36]. To give an example, in the AusDiab study, the cutoff was 6.1% by visual inspection. When change-point models were used, the cutoff value was 5.2% [32]. Considering the Hoorn study showed that not only A1C but also hypertension and abdominal obesity were determinants for DR [41], and the cutoff value of A1C for DR could be dependent of any adjustment of factors that may affect the development of DR. In the AusDiab study, without adjustment, a cutoff value of 5.2% was calculated with change-point model analysis; with adjustment for age, sex, and blood pressure, the cutoff value was 5.6%, and after further adjustment for diabetes duration, the cutoff was 6.0%. Mainly from the DETECT-2 findings, the International Expert Committee recommended a cutoff of 6.5% for an A1C-based diagnosis of diabetes [2]. In the DETECT-2 study, the largest cross-sectional analysis of nine studies from five countries with 44,623 multiethnic participants aged 20 to 79 years in an unadjusted analysis was conducted [30].
Differences in study population: ethnicities, age, and nonglycemic factors for determining A1C
Other reasons for variability in the optimal cutoff points could be the different clinical characteristics of each study population (ethnicities, age, and nonglycemic factors for determining A1C). A1C distribution could be different according to age and sex distribution of the population.
A1C levels appear to increase with age [49,50,51,52,53]. In analyses of the Framingham Offspring and participants of the NHANES 2001 to 2004, Pani et al. [49] tried to investigate the effect of age on the A1C level and found a 0.10% to 0.14% A1C increase with each decade increase in age. In this study, people 70 years of age without DM appeared to have higher A1C values of approximately 0.4% compared to those 40 years of age [49].
There was a report suggesting that an A1C-based diagnosis of diabetes has a different impact on prevalence in different ethnic groups [54]. In this study, while 91% of white participants with an A1C ≥6.5% had diabetes by the 2-hour plasma glucose criterion after an OGTT, only 61% of South Asian participants and 50% of black participants with an A1C ≥6.5% had diabetes by the 2-hour plasma glucose criterion after an OGTT. The Diabetes Prevention Program study showed a difference in A1C by race and ethnicity among patients with impaired glucose tolerance, and in this study, the A1C values for Afro-Caribbeans were approximately 0.4% higher than white Europeans with apparently the same glucose tolerance [55]. Another study showed a similar difference between South Asians and White Europeans [56].
Several nonglycemic factors may affect the results of A1C measurement. A Korean study found that the optimal A1C cutoff value for diagnosing diabetes based on FPG and 2-hour plasma glucose after an OGTT rose by approximately 0.1% with each decade increase of age in a Korean population [50]. This association of higher A1C with increasing age seemed to be due to changes in the rate of glycation associated with aging [53]. Some Hb variants could interfere with some A1C assay methods [57]. In the USA, 10% of 26 million African-American citizens have HbS or HbC trait [58]. Any condition that changes erythrocyte turnover, such as hemolytic anemia, chronic malaria, major blood loss, blood transfusions, splenomegaly or splenectomy, rheumatoid arthritis, or drugs such as antiretrovirals, ribavirin, and dapsone could lead to spurious A1C results. Hemolytic anemia can lead to an A1C that is lower than expected because of a decreased erythrocyte lifespan [59]. Iron deficiency anemia can increase the A1C level, which falls after iron therapy [60]. Renal failure was identified as an influencing condition because of the following: (1) a decreased erythrocyte life-span, as described above; (2) erythropoietin therapy, which increases red cell production [59]; and (3) increased formation of carbamylated Hb due to the binding to N-terminal β-chains of Hb of isocyanic acid, a urea byproduct formed in excess because of hyperuremia [61].
If A1C distributions were not the same for different populations due to these differences in clinical characteristics, the cut-off value would be changed with a shift in the A1C distribution to the left or right.
Differences in exclusion criteria: diabetes and/or using antidiabetes medication
The cutoff A1C values for DR depend on the choice of exclusion criteria. Most studies included individuals using oral hypoglycemic agents or insulin. In an Egyptian study, the optimal cutoff for HbA1c was 6.9% in the entire study population [26]. However, the optimal cutoff for HbA1c was changed to 7.5% after excluding subjects taking an antihyperglycemic medication. In a Chinese study, a cutoff of 6.4% was determined for the entire study population [39]. After excluding individuals receiving antidiabetes medication, the cutoff was 6.7% using the same method.
The ARIC study showed the relationships of A1C and DR separately, in diabetic and nondiabetic individuals, demonstrating differential associations of A1C with DR in diabetic (strong association with mild DR) and nondiabetic individuals (weak or no association) [31]. The authors suggested that examining the cross-sectional association of A1C and prevalent DR in populations that include individuals with diabetes who may have received lifestyle and/or pharmacologic interventions to lower A1C could be problematic; the onset of DR may have occurred years earlier, and the 'risk thresholds' observed for A1C in these studies may not accurately reflect values at which risk begins to increase.
Others
The variability in optimal cutoff points could be due to assay differences in measuring A1C, especially in earlier studies before the standardization of measurements for A1C. The limitation of A1C as a marker for chronic hyperglycemia exposure could be one of the reasons for the variability in optimal cutoff points of A1C because A1C was measured at a single time-point and we did not collect information on previous hyperglycemia exposure.
CONCLUSIONS
While the association of A1C with cardiovascular disease and other diabetic microvascular complications was linear without evidence of a distinct threshold, several studies suggested a threshold value for A1C in DR. In studies about the optimal cutoff value for A1C in DR, the values of A1C ranged from 5.2% to 7.8%. There are several possible reasons why these values for DR differ so widely (differences in definition and/or methods for detection of DR, variation in statistical methods, differences in study populations, differences in exclusion criteria, and differences in methods for measuring A1C). With these wide variations in study methods, drawing a conclusive cutoff value for A1C in DR is impossible.
In earlier studies, using direct opthalmoscopic examination or a retinal photograph of one field per eye, there was a strong association of hyperglycemia with DR, and a sharp threshold for A1C was observed [25,26,27]. A pooled analysis with three cross-sectional populations using retinal photographs with multiple fields reported inconsistent evidence for a uniform glycemic threshold for prevalent and incident retinopathy [47]. These findings suggested that the sensitivity of the technique for DR could be one determinant for the optimal cutoff value for A1C in DR. The DETECT-2 collaboration study [30] showed that the A1C threshold for moderate or more severe retinopathy was observed over the range of 6.3% to 6.7%. The threshold for diabetes-specific retinopathy from ROC analysis was 6.4% for A1C. In published studies, the cutoff values for moderate or more severe DR were higher than those for any or mild DR (6.4% to 7.0% vs. 5.5% to 6.5%).
 XML Download