

 PDF
PDF ePub
ePub Citation
 Print
Print


INTRODUCTION
Peroxisome proliferator-activated receptor-γ (PPAR-γ) agonist plays a key role in the regulation of adipose tissue function and has a significant effect on multiple components of metabolic syndrome [1]. Thiazolidinedione (TZD), a synthetic PPAR-γ agonist, favorably influences the production of adipokines and redistributes fat within the body, thereby contributing to an improvement in insulin sensitivity [2]. In addition, several animal and human studies have shown that TZD treatment is associated with usually small but significant reductions in blood pressure [3,4,5]. Moreover, TZD is known to increase high density lipoprotein cholesterol significantly and to decrease triglycerides, which are major contributors to metabolic syndrome [6]. Therefore, considerable research efforts have investigated novel genes regulated by PPAR-γ to determine genes related to metabolic syndrome.
The Otsuka Long-Evans Tokushima Fatty (OLETF) rat is a useful animal model of metabolic syndrome, as these rats are characterized by abdominal obesity, insulin resistance, hypertension, and dyslipidemia [7]. OLETF has a control counterpart animal model, the Long-Evans Tokushima Otsuka (LETO) rat, which was developed from the same colony but does not develop insulin resistance and obesity [8]. These two strains have been used in a number of studies to clarify the pathogenesis of metabolic syndrome [9,10,11].
Microarrays have provided medical researchers with a powerful tool to study the mechanisms of complex diseases, including type 2 diabetes and obesity [12]. However, there are still numerous problems and challenges in the current application of microarrays [13,14]. In particular, a vast number of genes are usually detected using microarrays, requiring a laborious validation process [15]. Therefore, in this study, we performed microarrays in two different models and searched overlapping genes to identify genes that are significant multiple conditions and thus reduce the number of identified genes requiring further validation.
We primarily investigated lipocalin-2, which has been recently re-evaluated as a novel adipokine correlated with obesity-related metabolic disorders [16]. Recently, Wang et al. [16] exhibited circulating lipocalin-2 levels and the expression of lipocalin-2 in adipose tissue, which were increased in db/db obese diabetic mice compared with normal mice. Furthermore, serum lipocalin-2 levels were elevated in obese compared to lean humans and correlated with various components of the metabolic syndrome [16]. However, there have been no studies examining the difference of lipocalin-2 expression in direct human adipose tissue in obese and nonobese. No study has examined the relationship of lipocalin-2 expression in human adipose tissue with circulating metabolic parameters. Therefore, in this study, we planned to confirm the significance of lipocalin-2 using microarrays in two different rodent models, and we intended to validate, for the first time, the difference of lipocalin-2 expression in adipose tissue between obese and nonobese humans.
METHODS
Study design
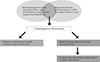
We examined the adipose gene expression profiles, which were regulated by PPAR-γ agonist treatment in db/db mice, a rodent model of metabolic syndrome using microarray analysis. Additionally, in the second microarray analysis, another set of adipose gene expression profiles, which were differentially expressed in OLETF rats compared with LETO rats, were searched. Finally, to determine the important genes related to metabolic syndrome, we examined overlapping genes whose expression is decreased by PPAR-γ agonist treatment and increased in OLETF rats using microarrays in two different models, and we validated the significant overlapping genes in independent rodent and human adipose tissue samples (Fig. 1).
Animal study
db/db mice and OLETF/LETO rats
Five-week-old male db/db mice (SLC, Shizuoka, Japan), which have a mutation in the leptin receptor, are used as an animal genetic model of metabolic syndrome [17]. The mice were acclimated to standard chow (AIN-93G; Dyets, Bethlehem, PA, USA) for 1 week, after which they were weighed and divided into two groups: (1) a group on a standard diet (n=5); and (2) a group on a standard diet mixed with pioglitazone (Takeda Pharmaceutical, Osaka, Japan), a synthetic PPAR-γ agonist (n=5). Pioglitazone was administered to 6-week-old db/db mice for 10 days at a dose of 40 mg/kg/day. At the end of the study period, the animals were sacrificed and the visceral adipose tissue (mesenteric depots) was harvested.
Four-week-old male OLETF rats (70 to 80 g initial weight) were supplied from Otsuka Pharmaceutical (Tokushima, Japan). Age-matched LETO rats were used as normal controls. At 24 weeks of age, OLETF (n=5) and LETO rats (n=5) were sacrificed and their visceral adipose tissues (mesenteric depots) were harvested. All experiments were conducted in accordance with the Korea University Guidelines for the Care and Use of Experimental Animals.
Microarray analysis
Total RNA from visceral adipose tissues of pioglitazone-treated db/db mice (n=5), normal chow-fed db/db mice (n=5), OLETF rats (n=5), and LETO rats (n=5) was extracted using an RNeasy Mini kit according to the manufacturer's instructions (Qiagen, Baltimore, MD, USA). Using a Bioanalyzer 2100 (Agilent Technologies, Santa Clara, CA, USA), the quality of extracted RNA was analyzed, and microarray analyses in two different models were performed: (1) between pioglitazone-treated db/db mice and normal chow-fed db/db mice; and (2) between OLETF rats and LETO rats. For control and test RNAs, the synthesis of target cRNA probes and hybridization were performed using a Low RNA Input Linear Amplification kit (Agilent Technologies) according to the manufacturer's instructions. Total twelve samples (six samples per model) were used for microarray hybridizations. The arrays were hybridized at 65℃ for 17 hours using a hybridization oven (Agilent Technologies). DNA chips (Agilent mouse whole genome 251486813056, Agilent rat whole genome 251487913127) were scanned using Scan Array Lite (Perkin-Elmer Life Sciences, Billerica, MA, USA). Scanned images were analyzed with GenePix 3.0 software (Axon Instruments, Union City, CA, USA) to obtain gene expression ratios. Logged gene expression ratios were normalized by LOWESS regression.
Human study
Participants
Six premenopausal obese women (body mass index [BMI] >25 kg/m2) and six age-matched nonobese premenopausal women (BMI <23 kg/m2) who were scheduled for gynecological surgery (total abdominal hysterectomy or myomectomy for noninflammatory uterine leiomyoma) were enrolled in this study. Obesity was defined with BMI according to the Asia-Pacific criteria [18]. Exclusion criteria included pregnancy, heart disease, cancer, inflammatory conditions, diabetes, and any other endocrine or metabolic disorder. Women with a history of hormone replacement therapy or oral contraceptive use or who were taking medications within the previous 3 months that could affect their inflammatory condition were also excluded.
Anthropometric and laboratory variables
Weight and height were measured to calculate BMI (kg/m2). Total serum cholesterol was determined by enzymatic methods using a chemical analyzer (Hitachi 747; Hitachi, Tokyo, Japan). The glucose oxidase method was used to measure plasma glucose. Interleukin-6 (IL-6) levels were measured by a Quantikine kit (R&D Systems, Belmont, CA, USA) with a coefficient of variation (CV) of 8.1%. Adipocyte fatty acid binding protein (A-FABP) levels were measured by an enzyme-linked immunosorbent assay kit (BioVendor Laboratory Medicine, Brno, Czech Republic) with a CV of 3.11%, and lipocalin-2 was measured by a Quantikine kit (R&D System) with a CV of 1.43%.
Adipose tissue sampling
Using a cold knife, small pieces (5 to 10 g wet weight) of subcutaneous adipose tissue were obtained from the abdominal incision site. In addition, visceral adipose tissue (mesenteric depots) was obtained during the gynecologic surgery. The adipose tissues were washed with sterile Krebs-Ringer-HEPES buffer and were stored at -70℃.
Quantitative real time reverse transcription polymerase chain reaction
Double-stranded cDNA was synthesized using a High Capacity cDNA Archive kit (Applied Biosystems, Foster City, CA, USA). Expression levels of lipocalin-2 in the visceral adipose tissues of humans and rodents were analyzed by a quantitative real-time reverse transcription polymerase chain reaction (qRTRT-PCR). qRTRT-PCR analysis was conducted using an ABI PRISM 7000 Sequence Detection System (Applied Biosystems) according to the manufacturer's instructions. TaqMan probes for lipocalin-2 (Mn00809552_s1, Hs00194353_m1, Rn00590612) and β-actin (Mm00607939_s1, Hs99999903_m1, Rn00667869) were the Assay-on-Demand gene expression products (Applied Biosystems). The mRNA levels of all genes were corrected using the transcription level of β-actin as an internal standard.
Statistical analyses
Values are presented as mean±standard deviation. Differences between the two groups were tested using the Mann-Whitney U test. One-sample Student t-test was calculated to test whether the mean normalized expression value for the gene was significantly different. A one sample binomial test was used to calculate whether there was a significant difference between the number of genes up-regulated and down-regulated by PPAR-γ agonist within each pathway. A Spearman correlation analysis was performed to determine the relationship between the level of lipocalin-2 expression in visceral adipose tissue and clinical and biochemical variables. A P<0.05 was considered to be statistically significant. Data were analyzed using SPSS version 10.0 (SPSS Inc., Chicago, IL, USA).
RESULTS
Anthropometric and biochemical variables in rodent models of metabolic syndrome
db/db mice fed with a pioglitazone mixed diet for 10 days showed a greater increase in body weight than those on a standard diet (P<0.01) (Table 1). Additionally, there was a significant decrease in serum fasting glucose and triglyceride levels with pioglitazone treatment (P<0.001 and P=0.027, respectively). The body weight of OLETF rats at 24 weeks was significantly increased compared with that of LETO rats (P=0.05), and there was a significant increase in serum fasting glucose, triglyceride, and total cholesterol levels in OLETF rats (Table 1).
Significant biological pathways affected by PPAR-γ agonist in rodent models of metabolic syndrome
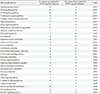
To clarify which pathways were truly affected by PPAR-γ, we focused on differentially expressed genes using filtering criteria of at least 2.0-fold-changes in all the experiment sets with a false discovery rate <5% [19]. The predominant pathways that were differentially represented in the visceral adipose tissues of db/db mice after PPAR-γ agonist treatment are shown in Table 2. The KEGG public category with the highest number of differentially expressed genes in a positive direction was the oxidative phosphorylation pathway. The other three KEGG public pathways positively affected by PPAR-γ agonist were PPAR signaling, fatty acid metabolism, and the citrate cycle pathway, in that order. In contrast, the T-cell receptor signaling pathway was identified as the pathway most down-regulated by PPAR-γ agonist followed by cytokine-cytokine receptor interactions, natural killer cell-mediated cytotoxicity, and B-cell receptor signaling pathways.
Gene expression ratio of lipocalin-2 in the microarrays of two different models
Based on previous studies [16,20], we chose lipocalin-2 as a significant gene, which needed to be validated by real-time RT-PCR. Lipocalin-2 is a recently re-evaluated adipokine that is related to obesity related metabolic disorders [16]. Our research team has published that serum lipocalin-2 levels were significantly elevated in patients with coronary heart disease (CHD) and independently associated with CHD [20]. In the first microarray analysis, the average gene expression fold change of lipocalin-2 in PPAR-γ agonist treated db/db mice when divided by normal chow fed db/db mice was 0.39 (P=0.011). In the second microarray analysis, the average gene expression fold change of lipocalin-2 in OLETF rats divided by that of LETO rats was 1.59 (P=0.077).
Lipocalin-2 expression in visceral adipose tissues of animal models
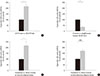
Real-time RT-PCR validation studies in independent samples showed that there was a significant increase in lipocalin-2 expression in visceral adipose tissue of OLETF rats compared with LETO rats (P=0.01) (Fig. 2A), while the level of lipocalin-2 mRNA in visceral adipose tissue of pioglitazone-treated db/db mice was significantly decreased compared with that of normal chow-fed db/db mice (P<0.001) (Fig. 2B).
Comparison of biochemical variables between nonobese and obese participants
The clinical characteristics of the 12 women are shown in Table 3. The average BMI in the obese group was 29.6±3.5 kg/m2, whereas the average BMI in the nonobese group was 21.1±1.2 kg/m2 (P<0.001). In the obese group, there was a significant increase in serum glucose (P=0.05), WBC count (P=0.004), A-FABP (P=0.004), and lipocalin-2 (P=0.03) levels compared with the nonobese group.
Lipocalin-2 expression in visceral and subcutaneous adipose tissues of obese humans
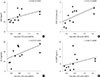
The level of expression of lipocalin-2 in the visceral adipose tissues of the obese group was significantly increased compared with the nonobese group (P=0.01) (Fig. 2C). However, there was no significant difference in the expression of lipocalin-2 in subcutaneous adipose tissues between the two groups (P=0.20) (Fig. 2D). Next, we analyzed the relationship between the expression of lipocalin-2 in visceral adipose tissues with anthropometric and biochemical variables. As a result, the expression of lipocalin-2 in visceral adipose tissues was significantly correlated with BMI (r=0.68, P=0.015), serum IL-6 (r=0.59, P=0.044), A-FABP (r=0.60, P=0.04) levels, and WBC count (r=0.72, P=0.008) (Fig. 3). Lipocalin-2 expression in visceral adipose tissue showed the trends of positive correlation with serum lipocalin-2 levels, although the correlation was not significant (r=0.50, P=0.1). Additionally, the serum lipocalin-2 level was closely correlated with BMI (r=0.71, P=0.01), WBC (r=0.71, P=0.01), and A-FABP levels (r=0.74, P=0.006).
DISCUSSION
Using microarrays in two different models, we tried to search adipose gene expression profiles that were simultaneously increased in a rodent model of metabolic syndrome and decreased with PPAR-γ agonist treatment. In the present study, lipocalin-2 was validated as a significant metabolic syndrome-related adipokine in both rodent and human adipose samples. Furthermore, this study is the first to demonstrate that the level of expression of lipocalin-2 is significantly increased in visceral adipose tissue of obese humans compared with nonobese humans and that these levels have a close positive correlation with BMI, serum IL-6, A-FABP levels, and WBC counts.
Microarray analysis permits a more comprehensive understanding of the interaction between multiple genes simultaneously involved in pathological conditions [12]. For example, retinol binding protein 4 (RBP4) is an adipokine that is newly discovered using microarray analysis and is elevated in the adipose tissue of adipose-Glut4-/- mice [21]. In addition, using cDNA array chips, a screen for genes that are induced during adipocyte differentiation but down-regulated in mature adipocytes exposed to PPAR-γ agonist led to the discovery of a protein called resistin [22]. Although microarray analysis is a useful methodology for the detection of new genes that are involved in a variety of metabolic syndromes, a very large number of genes are usually detected necessitating a laborious validation process. Our study design was intended to search for overlapping genes between two separate microarray analyses to find more meaningful genes with metabolic syndrome, between pioglitazone-treated db/db mice and normal chow-fed db/db mice and between OLETF rats and LETO rats. The use of two different rodent models most likely reduced the risk of identifying false positive genes.
Among the overlapping genes, based on recent studies, we validated lipocalin-2 using independent rodent and human adipose samples in this study. As a result, we verified that lipocalin-2 is simultaneously down-regulated in pioglitazone treated db/db mice and up-regulated in OLETF rats. Lipocalin-2 (also known as neutrophil gelatinase-associated lipocalin) is a 25-kDa acute phase protein originally purified from human neutrophils [23], a member of the lipocalin family, and shares a common tertiary structure formed by segments termed lipocalin folds [24]. RBP-4, which has been recently re-evaluated as a novel adipokine involved in the pathogenesis of insulin resistance using DNA arrays in adipose Glut4-/- mice, is another well-known lipocalin family [21]. Recently, Wang et al. [16] evaluated the relevance of lipocalin-2 in obesity-related disorders both in mice and humans. These researchers reported that lipocalin-2 expression in adipose tissue and liver were significantly increased in db/db mice compared with lean littermates [16]. In addition, the researchers also found a significant positive correlation between serum lipocalin-2 levels and several variables associated with obesity-related metabolic disorders in humans. In this study, we confirmed that the serum concentration of lipocalin-2 was significantly increased in the obese group and closely correlated with BMI, WBC count, and serum A-FABP levels. Furthermore, we found for the first time that the expression of lipocalin-2 in visceral adipose tissues of humans has a positive correlation with BMI, WBC count, and serum IL-6 and A-FABP levels. We examined the correlation of circulating inflammatory markers not only with the serum lipocalin-2 level but also with lipocalin-2 expression in human adipose tissue. To date, there have been a small number of studies examining the lipocalin-2 expression in visceral adipose tissue of rodents and 3T3-L1 adipoctyes [16,25,26]. However, there have been no studies regarding the lipoclin-2 expression level in direct human adipose tissue. Therefore, the present study is the first to show the difference in the level of lipocalin-2 expression in the visceral adipose tissues in obese and nonobese humans.
If lipocalin-2 expression in visceral adipose tissue had predicted the circulating levels of that cytokine in the present study, positive correlation of lipocalin-2 expression in visceral adipose tissue with various metabolic parameters might be more meaningful. However, lipocalin-2 expression in visceral adipose tissue showed only the trends of positive correlation with serum lipocalin-2 level (r=0.50, P=0.1) in the present study, and significance is expected if the sample size increased. In this study, the expression of lipocalin-2 in visceral adipose tissue had a significant positive relationship with serum IL-6 levels and WBC count, which are representative biomarkers of the inflammatory process [27,28]. Metabolic syndrome is closely associated with systemic low-grade inflammation [29]. Recently, Zhang et al. [25] reported that the administration of lipocalin-2 to 3T3-L1 adipocytes attenuated the inflammatory effect of tumor necrosis factor-α and lipopolysaccharide-induced cytokine production in macrophages, suggesting that lipocalin-2 is a novel adipokine acting as an antagonist of inflammatory pathways. By contrast, Yan et al. [26] demonstrated that the forced reduction of lipocalin-2 in 3T3-L1 adipocytes improved insulin action and that exogenous lipocalin-2 promotes insulin resistance in cultured hepatocytes, suggesting that lipocalin-2 is an independent adipokine to accelerate obesity-related pathogenesis. Although the previous two studies had different suggestions regarding the action of lipocalin-2, it is clearly based on the results of these study and our study that lipocalin-2 mediates an important crossroad between the obesity-related inflammatory process and metabolic response.
The limitation of our cross-sectional study was that we could not clarify whether the increase in lipocalin-2 was a simple compensatory response of obesity or whether lipocalin-2 independently affects the pathogenesis of obesity-related disorders. Second, the sample size of human participants is too small. There is lack of data regarding visceral adiposity, such as waist circumference and abdominal fat, on computed tomography.
In conclusion, to determine the genes involved in metabolic syndrome, we tried to search overlapping genes whose expression were both decreased in PPAR-γ agonist treated db/db mice and increased in OLETF rats based on two independent microarray results. Among these overlapping genes, we confirmed that lipocalin-2 is a significant adipokine affected by PPAR-γ agonist and obesity. We newly validated that the lipocalin-2 expression of human adipose tissue is significantly increased in obese humans compared with nonobese humans and is significantly correlated with several circulating metabolic parameters. Further study is warranted to clarify the functional role of lipocalin-2 in the pathogenesis of metabolic syndrome.

 XML Download