

 PDF
PDF ePub
ePub Citation
 Print
Print


INTRODUCTION
Impaired insulin secretion and insulin resistance are considered as the primary pathophysiological factors in the development of type 2 diabetes mellitus (T2DM) [1]. T2DM is preceded by a long prediabetic state, which is defined by an oral glucose tolerance test (OGTT) including isolated impaired fasting glucose (i-IFG), isolated impaired glucose tolerance (i-IGT), or their combination (IFG+IGT) [2]. In these high-risk individuals, abnormalities of β-cell function are present at early stages prior to the development of T2DM.
A specific non-low density lipoprotein (non-LDL) dyslipidemia known as atherogenic dyslipidemia, which is characterized by increased triglyceride (TG) along with decreased high density lipoprotein cholesterol (HDL-C), is present in subjects with diabetes and prediabetes, as well as those with normal glucose tolerance (NGT). This abnormal lipid profile has been recently hypothesized to play a primary role in the development of T2DM, and dysfunction of β-cells caused by dyslipidemia precedes the manifestation of disease [3,4].
The plasma TG/HDL-C concentration ratio is significantly related to a direct measure of insulin-mediated glucose disposal [5]. In nondiabetic Korean subjects, the TG/HDL-C ratio was independently associated with later development of T2DM [6]. Hermans et al. [7,8] revealed that the TG/HDL-C ratio was related to decreased insulin secretion, β-cell function loss, and poorer glycemic control in both sexes among subjects with T2DM. Another study reported that HDL-C levels were associated with β-cell function in prediabetic subjects [9]. On the other hand, the association between TG and TG/HDL-C ratio, and insulin secretion in prediabetic and NGT subjects remain to be clarified.
The aim of the present study was to investigate the association between serum TG and HDL-C levels, and TG/HDL-C ratio and early-phase insulin secretion in normoglycemic and prediabetic subjects. One of the empirical indices that measures β-cell function, the insulinogenic index (IGI), is a surrogate measure of early-phase insulin secretion [1]; it calculates the difference between the postprandial insulin peak (measured at 30 minutes) and basal insulin in relation to the difference in glucose levels (IGI=ΔInsulin0-30/ΔGlucose0-30). The homeostasis model assessment of insulin resistance (HOMA-IR) is used to estimate insulin sensitivity. Because the amount of insulin secreted by β-cells is strongly dependent on the prevailing degree of insulin sensitivity, accounting for differences in insulin sensitivity is a critical point when evaluating β-cell function. Therefore, in the present study, the disposition index (DI), which is the ratio of IGI relative to HOMA-IR (IGI/HOMA-R), was determined as this gives an adjusted measure of β-cell function that accounts for variations in insulin sensitivity [10].
METHODS
Subjects
Between January 2005 and December 2008, 746 subjects aged 35 years or older who had no known history of diabetes underwent a 75-g OGTT as part of a routine health examination at Iida Municipal Hospital. The 75-g OGTT was conducted after an overnight fast (>12 hours). Blood samples were collected at 0 minute (fasting plasma glucose; FPG), 30 minutes, 1 hour, and 2 hours postchallenge plasma glucose (2 hr-PG) following the OGTT. The glucose tolerance status of each subject was classified based on the criteria of the American Diabetes Association (2011), as follows: NGT (FPG <100 mg/dL and 2 hr-PG levels <140 mg/dL), i-IFG (FPG of 100 to 125 mg/dL and 2 hr-PG levels <140 mg/dL), i-IGT (FPG ≤125 mg/dL and 2 hr-PG levels of 140 to 199 mg/dL), and (IFG+IGT; FPG of 100 to 125 mg/dL and 2 hr-PG levels of 140 to 199 mg/dL) [11].
Subjects who were newly diagnosed with diabetes (according to the following definition: hemoglobin A1c ≥6.5%, FPG ≥126 mg/dL, or 2 hr-PG ≥200 mg/dL) were excluded [11]. Subjects who were on steroids or were taking drugs interfering with lipid metabolism, and those with IGI values of ≤0 were also excluded [12]. On the basis of the OGTT results, subjects with NGT (n=341), i-IFG (n=211), i-IGT (n=71), and IFG+IGT (n=40) were selected for the present study. Informed consent was obtained from all participants.
Biochemical measurements
Plasma glucose levels, serum total cholesterol (TC), TG, HDL-C, LDL-cholesterol (LDL-C), and serum uric acid (UA) were determined using standard methods (Hitachi 47 automatic analyzer; Hitachi, Tokyo, Japan). Serum insulin level was measured by chemiluminescent enzyme immunoassay (Chemilumi Insulin; Kyowa Medics, Tokyo, Japan).
Familial history and lifestyle questionnaires
A questionnaire was used to obtain information about familial medical history and the subjects' lifestyle, such as smoking habits and alcohol ingestion. Familial history of diabetes was defined as having one or more relatives (parent or sibling) with diabetes. Individuals who had smoked <100 cigarettes during their lifetime were considered nonsmokers, those who had smoked ≥100 cigarettes and were currently not smoking were considered former smokers, and those who had smoked ≥100 cigarettes and were currently smoking were considered current smokers. The following criteria were defined for alcohol consumption groups: drinking never or rarely (0 to 5 times/year), occasionally (1 to 5 times/month), and regularly (1 to 7 times/week).
Calculations
Insulin sensitivity was determined by the HOMA-IR, which was calculated as FPG (mg/dL)×fasting insulin (µIU/mL)/405 [13]. The IGI, which determines the early insulin response during the OGTT, was calculated as the ratio of the change in insulin to the change in glucose from 0 to 30 minutes (ΔInsulin0-30/ΔGlucose0-30). The DI, which is an adjusted measure of β-cell function that accounts for variations in insulin sensitivity, was calculated as the ratio of the IGI relative to the HOMA-IR (IGI/HOMA-R) [10].
Statistical methods
Statistical analyses were performed using the SPSS version 21.0 (IBM Co., Armonk, NY, USA). One-way analysis of variance was used to compare the clinical characteristics among the four groups followed by the Bonferroni post hoc test for continuous variables. The chi-square test was used to compare the categorical parameters. Normal distribution of variables was checked by Kolmogorov-Smirnov test.
Pearson correlation coefficients were calculated to evaluate the relationships between indices of insulin secretion and several clinical variables (body mass index [BMI], systolic blood pressure [SBP], diastolic blood pressure, UA, TC, TG, HDL-C, TG/HDL-C ratio, LDL-C, FPG, and fasting insulin level). The distributions of TG and TG/HDL-C ratio were skewed; hence, we conducted Pearson linear correlation using log-transformed values instead of the raw data. To assess independent relationships between β-cell function and the clinical variables, a multiple linear regression analysis was performed. Standardized coefficients (β) were determined after adjusting for age, BMI, SBP, UA, smoking status, and alcohol ingestion. Data were expressed as mean±standard deviation. A P values of <0.05 was considered statistically significant.
RESULTS
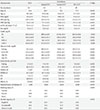
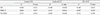
The clinical and metabolic characteristics of the study population are summarized in Table 1. In brief, subjects affected by prediabetes had significantly higher age, BMI, blood pressure, and levels of fasting insulin, TC, TG, LDL-C, and HOMA-IR but lower HDL-C levels than NGT subjects, which was expected. Glucose levels were higher in subjects with i-IFG, i-IGT, and IFG+IGT than in NGT subjects. We found a significant difference in insulin secretion (HOMA-β, IGI, and DI) among the four groups.
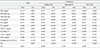
Spearman correlation analyses of subjects with i-IFG, i-IGT, and IFG+IGT demonstrated that IGI and DI were positively correlated with serum HDL-C levels. In addition, in subjects with i-IGT and IFG+IGT, but not with i-IFG, IGI, and DI were negatively correlated with log-transformed TG and the log-transformed TG/HDL-C ratio. On the other hand, in NGT subjects, neither HDL-C and log-transformed TG, nor log-transformed TG/HDL-C ratio were associated with insulin secretion. Moreover, there were no significant correlations between insulin secretion and TC, and LDL-C levels among all subjects (Table 2).
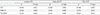
As presented in Table 3, multivariate linear regression analyses revealed that DI was positively correlated with HDL-C in the subjects with i-IFG, i-IGT, and IFG+IGT even after adjusting for potential confounding factors. Moreover, in those with i-IGT, DI was inversely correlated with log-transformed TG and the log-transformed TG/HDL-C ratio. However, DI was not significantly associated with the TG or TG/HDL-C ratio in the subjects with i-IFG and IFG+IGT.
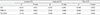
Because the relationship between lipid profiles and insulin secretion may be explained by the disproportional distribution of men and women, we examined insulin secretion by gender. In i-IGT subjects, decreased HDL-C and increased TG and TG/HDL-C ratio were significantly correlated with decreased DI in both men and women shown in Tables 4 and 5, respectively. However, the association between HDL-C and DI in subjects with i-IFG and IFG+IGT was not found in the analysis performed separately in men and women.
DISCUSSION
Elevated TG and decreased HDL-C levels are known to be associated with the development of T2DM. These atherogenic lipid abnormalities often precede T2DM by several years, indicating that altered lipoprotein metabolism is an early event in the development of β-cell dysfunction. In fact, among subjects with prediabetes, hypertriglyceridemia is demonstrated as a predictor of T2DM progression [14]. Elevated TG levels induce β-cell apoptosis by increasing the levels of ceramide and nitric oxide [15,16]. On the other hand, HDL-C stimulates insulin secretion by interacting with ABCA1, the ATP-binding cassette transporter G1, or the scavenger receptor B1, and it also inhibits β-cells apoptosis [4]. Therefore, subjects with Tangier disease, which is caused by an ABCA1 mutation, exhibit impaired insulin secretion [17].
In the present study, indices of early-phase insulin secretion, IGI and DI, were correlated with HDL-C levels in prediabetic subjects but not in NGT subjects. Although the specific reason for this inconsistency is unknown, it is hypothesized that HDL-C may play an important role in protecting β-cells in subjects in the relatively late stages of hyperglycemia, particularly in those with prediabetes, whereas its protective effects are less apparent in those with NGT. Moreover, these indices of insulin secretion did not correlate with TG or the TG/HDL-C ratio in NGT subjects. Thus, our present study provides new insights into the pathophysiological differences in lipid levels and insulin secretion among normoglycemic and prediabetic subjects.
The evidence now suggests that subjects with i-IFG and i-IGT may represent different populations, with more or less overlapping subclinical characteristics and pathophysiology. Isolated IGT is associated with an increase in cardiovascular-related mortality and all-cause mortality [18]. On the other hand, i-IFG is a risk category for diabetes, but its relationship with atherosclerosis is less clear [19]. The present study revealed that insulin secretion correlated with TG, HDL-C, and the TG/HDL-C ratio in both men and women subjects with i-IGT. However, such correlations were not identified in i-IFG subjects, even though the sample size was the largest in this group among the three prediabetes subjects. Similar to the results reported by Lorenzo et al. [20], in our study, TG levels were higher in i-IGT subjects compared with i-IFG subjects. Van der Zijl et al. [21] showed that lipid accumulation in the pancreas was positively associated with TG levels and negatively with HDL-C levels. Moreover, they reported that pancreatic fat content gradually increased with deterioration of glucose metabolism (NGT, 7.6%; IFG, 12.1%; and IGT, 22.4%), and an inverse relationship between pancreatic fat content and DI was observed [21]. In the present investigation, different association between lipid profiles and DI in i-IFG and i-IGT could be the result of differences in pancreatic fat content between the two groups.
He et al. [22] found that TG and the TG/HDL-C ratio were independent risk factors for T2DM, and that TG/HDL-C was a stronger risk factor of the two. Moreover, Giannini et al. [23] reported that the TG/HDL-C ratio is associated with insulin resistance and may be used along with other factors to identify subjects at increased risk of insulin resistance-driven morbidity. In the present study, we investigated DI, which can be considered an index of pancreatic functionality and can predict the normal β-cell response adequate for any degree of insulin resistance [24]. To the best of our knowledge, this is the first report to reveal that this index is correlated with the TG/HDL-C ratio in both men and women with i-IGT even after adjusting for the associated variables. Our results add further support to the notion that the TG/HDL-C ratio may be a clinically simple and useful indicator of insulin secretion independent of insulin sensitivity among subjects with i-IGT.
The current study had some limitations. First, the 75-g OGTT was performed as part of a health check-up rather than for any specified research purpose, and there were no predetermined criteria for undergoing the test. Second, the current study had a small sample size and a high prevalence of men especially in subjects with IFG+IGT. Our sample size and disproportional distribution of gender may be insufficient to clearly confirm the association between lipid profile and insulin secretion in subjects with IFG+IGT. Third, and finally, we did not measure subclinical inflammatory markers (such as C-reactive protein, interleukin-6, or tumor necrosis factor-α), which may affect insulin secretion. However, the strength and consistency of the association observed using routine biochemical measures may have beneficial implications for clinical practice.
In conclusion, in a sample of prediabetic subjects, consistent associations were found between lower HDL-C and lower early-phase insulin secretion levels. Moreover, in both men and women with i-IGT, insulin secretion was negatively correlated with TG and the TG/HDL-C ratio. These results suggest that early-phase insulin secretion is affected by HDL-C and TG in prediabetic subjects.
 XML Download