

 PDF
PDF ePub
ePub Citation
 Print
Print


INTRODUCTION
Serum creatinine is the most commonly used indicator of renal function, but serum creatinine can be affected by age, gender, ethnicity, nutritional status, and body muscle mass [1]. To account for the physiologic factors that affect creatinine, glomerular filtration rate (GFR)-estimating equations, such as the Modification of Diet in Renal Disease (MDRD) formulas, include age, sex, and race to account for variation across populations related to creatinine [2,3,4,5]. However, muscle mass is extremely variable across individuals and strongly influences serum creatinine. Furthermore, the different equations that are used to predict GFR do not include parameters related to body composition, such as muscle mass [6,7,8,9,10]. Cystatin C is a 13.3 kDa low-molecular-weight substance that is freely filtered and almost completely taken up and degraded but not secreted by proximal tubular cells. The advantages of using cystatin C are reduced influences of age, gender, weight, and muscle mass compared to serum creatinine [11,12,13,14,15]. Serum cystatin C is being considered as a potential replacement for serum creatinine for GFR estimation [16,17,18].
To evaluate serum cystatin C as a potential replacement for creatinine, this study examined the analytical performance of cystatin C and evaluated the use of GFR-estimating equations based on serum cystatin C compared to the use of these equations based on creatinine to address the influence of physical factors, including muscle mass, on serum creatinine and cystatin C.
METHODS
This study included 37 samples from diabetic chronic kidney disease (CKD) patients for whom serum creatinine tests had been requested and 40 samples from a healthy population in Dong-A University Hospital between May 2010 and June 2010. The inclusion criteria were presence of stages 3 to 5 CKD according to the National Kidney Foundation's classification. Patients who were free of cancer and liver, thyroid, and infectious diseases at the time of the study were included. The healthy population consisted of samples obtained from the people who had visited the hospital for periodic medical checkups and proved to have no specific clinical or laboratory problems. Serum cystatin C was measured with a TBA-200FR (Toshiba Medical Systems, Tokyo, Japan). The assay precision (i.e., the coefficient of variation) and the reference range of the serum cystatin C test were evaluated. The assay precision of the cystatin C test was evaluated according to Clinical and Laboratory Standards Institute protocol EP5-A2 [19]. We tested the low and high control materials simultaneously. We measured the cystatin C concentrations twice daily for 5 consecutive days. We compared the estimated GFRs using the new equations that are based on variations in serum cystatin C levels with age, gender, and race and a routine laboratory GFR test. The estimated GFR (eGFR) levels that resulted from the routine laboratory tests were calculated using the MDRD formula: MDRD=186×(serum creatinine [mg/dL])-1.154×age-0.203 [20]. A correction factor of 0.742 was used for the women. The eGFRcys level was calculated with the CKD-epidemiology (CKD-EPI) equation: eGFR=127.7×(cystatin C in mg/L)-1.17×(age in years)-0.13×(0.91 if female) [21]. The charts of all patients and healthy individuals were reviewed for sex, age, height, weight, and body muscle mass. The variables considered in this study were measured with a 2006 X-Scan Plus II Body Composition Analyzer (Jawon Medical Co., Gyeongsan, Korea). Moreover, we investigated the influences of age, gender, weight, and muscle mass on serum creatinine and serum cystatin C. Correlations between the parameters were evaluated with Pearson or Spearman tests as appropriate. All statistical analyses were performed using MediCalc version 9.3 (MedCalc Software, Mariakerke, Belgium). The data were also analyzed with Analyse-it (Analyse-it Software, Leeds, UK). P values below 0.05 were regarded as statistically significant.
RESULTS
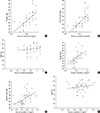
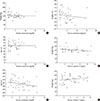
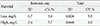
The characteristics of the study groups are presented in Table 1. There were positive correlations between GFR based on the MDRD equation and GFR based on the new equation among the diabetic CKD patients (r=0.79, P<0.0001) and the healthy individuals (r=0.36, P=0.01) (Fig. 1). Table 2 shows the mean serum creatinine and serum cystatin C levels of the healthy populations and the diabetic CKD patients according to gender. The correlations of age, weight, and muscle mass with serum creatinine and serum cystatin C in the healthy population are shown in Fig. 2. The correlations of age, body weight and height with serum creatinine and serum cystatin C in the diabetic CKD patients are shown in Fig. 3. Neither serum creatinine nor cystatin C were influenced by age or gender. However, serum creatinine and cystatin C were significantly correlated with body weight and muscle mass, but the correlations with serum creatinine were stronger in the healthy individuals. Additionally, both parameters were correlated with body weight and height, but strengths of the correlations with serum cystatin C were slightly higher. The precision study revealed excellent results for both the high and low controls (Table 3). In this study, the serum samples of 40 healthy individuals were tested to construct a reference range. The mean cystatin C concentration derived from the data was 0.794 mg/L, and the 95% reference interval was 0.371 to 1.236 mg/L.
DISCUSSION
GFR allows for the detection of impairments in renal function. Accurate GFR measurements are important for the diagnoses and treatments of kidney diseases, including CKD. Over the past decades, several different markers for the estimation of GFR have been proposed. Currently, serum creatinine concentration is widely used to estimate GFR because this estimation is simple and inexpensive [22]. However, serum creatinine can be affected by age, gender, ethnicity, dietary protein intake, and muscle mass, and its measurement requires a variety of analytical interferences and is associated with significant standardization problems [1,6,7,8,9,10,23,24]. In contrast, although the notion that the capacity of cystatin C to predict GFR is not influenced by body composition has been controversial, several studies have reported that the use of cystatin C has the advantages of being less influenced by age, gender, weight, and muscle mass compared to the use of serum creatinine [11,12,13,14,15,25]. Therefore, some new cystatin C formulas have been developed and compared with the corresponding formulas for creatinine [15,26,27,28]. Studies conducted over the last 20 years have generally shown that cystatin C is a better predictor of GFR than creatinine. These previous studies showed that cystatin C is superior to serum creatinine as a marker of kidney function in the detection of early renal failure and in various patient groups, including patients with diabetes, spine injuries and liver cirrhosis, and the elderly [17,18]. Additionally, an overall meta-analysis based on 46 studies that were performed on adults and children used receiver operating characteristic analysis to demonstrate that cystatin C is superior to serum creatinine as a marker of kidney function [16].
In the present study, we evaluated GFR based on cystatin C with the CKD-EPI formulas and concluded that the cystatin C formulas achieved correlations that were as good as those of the creatinine MDRD equation. A correlation coefficient close to 1 indicates that two factors are positively correlated, a correlation coefficient between 0.7 and 1.0 indicates the factors are strongly correlated, and a correlation coefficient between 0.3 and 0.7 indicates a good correlation.
Some previously published studies of populations with CKD have reported that the cystatin C formula produces higher accuracies than the MDRD formulas [26,27]. One study performed comparisons of a variety of creatinine-based equations with two cystatin C-based equations in a large population of patients with diabetic CKD. The results of this study indicated that the cystatin C formulas are reliable markers of GFR [29]. Additionally, Rule et al. [15] reported that the cystatin C formula is complementary to the serum creatinine-based equations and can also be used in place of the serum creatinine-based equations. Similar to creatinine, serum cystatin C was affected by body weight and muscle mass, but the strengths of the correlations with serum creatinine were greater in the reference group in our study. These findings are concordant with those of more recent studies that have shown that
cystatin C concentrations are higher in men and increase with height, weight, and lean body mass [12,13,14]. Two large studies produced consistent results that suggest that cystatin C is influenced by many variables (e.g., age, sex, body mass, smoking, hypertension, coronary heart disease, and C-reactive protein) and is not solely influenced by renal function even after adjustments for kidney function [14,30]. However, age and gender did not affect serum cystatin C or creatinine concentrations in our study.
Our study has some potential limitations. First, we were unable to measure GFR using gold standard; therefore, a direct comparison of the correlation between the GFRs based on cystatin C and those based on creatinine was impossible. Second, the small population of our study, the selection of the reference group, ethnic differences and methodological differences in the evaluation of cystatin C and creatinine may have influenced the results. The performances of the equations based on serum creatinine level and those based on cystatin C level are known to vary across populations, and our study included only diabetic CKD patients and healthy individuals. Additionally, the pathogenesis of diabetic kidney disease is complex and multifactorial. The duration of diabetes among the patients varied, and hemodynamic changes might have influenced the results. However, we found results that are similar to those of previous reports regarding cystatin C; i.e., we found positive correlations between eGFR and eGFRcys, and we found that cystatin C was less influenced by age, gender, weight, and muscle mass than was serum creatinine [11,12,13,14,15]. Although the strength of the correlations of serum cystatin C with body weight and height were greater among the diabetic CKD patients, these findings might have been influenced by many other factors, including the small sample size and the heterogeneous characteristics of the study group. Third, because we measured serum cystatin C and serum creatinine only once in a small population, we cannot rule out the effects of intrapatient variability.
Additionally, we evaluated the reference range and the precision of the serum cystatin C test and found excellent results in both the high and low controls that were all below 10%. Based on these results, we conclude that, despite the strong correlation between serum creatinine and cystatin C, the latter is less strongly affected by weight and muscle mass and might represent a better alternative for the assessment of renal function in both diabetic CKD patients and healthy populations. Future studies in different clinical settings employing larger numbers of patients and healthy individuals are required to clarify the effectiveness of serum cystatin C for the determination of GFR, and thorough investigations of any conditions or medications that might influence cystatin C levels are also required.


 XML Download