

 PDF
PDF ePub
ePub Citation
 Print
Print


INTRODUCTION
Recent studies have explored the incidence of complications in diabetic populations and emphasized strict glucose control to reduce these complications. Despite advances in antidiabetic medications, the number of diabetic patients who achieve target glucose level has remained low [1]. As well as chronic hyperglycemia, acute glucose fluctuation activates oxidative stress, which is a mechanism of complications in diabetic populations [2]. Therefore, it is essential to control acute glucose fluctuation to achieve target glucose level and to reduce complications. Glucose fluctuation is affected by various factors; therefore, the factors aggravating hyperglycemia also need to be controlled in order to more effectively manage diabetes. Psychiatric stress is a major factor causing increased glucose level [3]. Stress hormones such as glucagon and epinephrine increase glycogenolysis and gluconeogenesis in the liver and reduce glucose uptake in muscle, producing resultant hyperglycemia [4]. While many studies have reported that psychiatric stress aggravates hyperglycemia in diabetes [3], the pattern and extent of hyperglycemia induced by psychiatric stress and the difference in the amount of psychiatric stress-induced hyperglycemia between normal and diabetic subjects remain unknown. In addition, the pattern and level of hyperglycemia induced by psychiatric stress are difficult to investigate because psychiatric stress is difficult to objectively measure and quantify and to reproduce in humans due to ethical and methodological considerations.
Therefore, we used animal models to investigate the characteristics of patterns of glucose fluctuation in response to psychiatric stress. Moreover, we investigated potential differences in the pattern of stress-induced hyperglycemia between type 1 diabetes, caused by an absolute insulin deficiency, and type 2 diabetes, with chronic hyperglycemia resulting from insulin resistance together with relative insulin deficiency. For type 2 diabetes, we included an obese type 2 diabetes model (OT2D), which is predominantly caused by insulin resistance [5-7], and a nonobese type 2 diabetes model (NOT2D), which is caused mainly by insulin deficiency [8-11]. In the present study, we established an acute stress-loading test to evaluate and quantify glucose changes induced by acute psychiatric stress rather than physical stress in the animal models; we exposed rats with a normal glucose level to a cat in an experimental box-a predator stress model [12,13]-thereby subjecting the rats to fear stress. When predators (e.g., cats and ferrets) or odors of predators are presented to rodents, the hypothalamic-pituitary-adrenocortical axis is activated [14-19], and stress-related neurotransmitters are excreted in the brains [20,21]. Next, after progression to type 1 or type 2 diabetes, we repeated the stress-loading test in the rats and examined the patterns in glucose fluctuation and glucose level in the diabetes models. We compared the differences in glucose change according to the type of diabetes, including type 1 diabetes, obese type 2 diabetes, and nonobese type 2 diabetes, as well as between the normal and diabetic states. Thus, the present study shows quantified patterns in glucose change in normal and diabetic rats and type of glucose change according to diabetes type. We emphasize that psychiatric stress may be a serious factor in the aggravation of hyperglycemia in diabetes, and that the pattern of glucose change should be considered for effective treatment of diabetes patients.
METHODS
Stress loading test (predat or stress model)
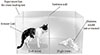
We prepared an experimental model for stress loading by creating an environment believed to produce actual psychiatric stress rather than using physical stress. Rats in an experimental box were exposed to a cat. A male cat with short hair and a body weight of 1.8 kg was used in the study. The cat and rats were placed in adjacent compartments of the experimental box to produce a consistent psychiatric stress on the rats, as shown in Fig. 1. The box was 80 cm in width, 45 cm in length, and 60 cm in height and had 32 1-cm holes in each front and back wall and 18 holes in each side wall. A transparent partition with 18 holes was placed in the center of the box to prevent the cat from attacking the rats but to allow visual and auditory stimuli and exposure to predator odor. The duration of exposure to the cat in the experimental box was 60 minutes. The rats received only water for at least 12 hours before the experiment and remained in their cages for 30 minutes after being transferred to the experimental room and before exposure to the cat. The cat was removed from the testing room after the test was complete.
Glucose monitoring and patterns of blood glucose change
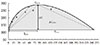
To determine changes in blood glucose induced by the predator stress, we measured the glucose levels of the rats with a glucometer (ACCU-CHEK Performa; Roche, Indianapolis, IN, USA) at 5-minute intervals after exposure to the cat. We used capillary blood from the tail tips of the rats. We continued to measure blood glucose at 5-minute intervals even after removal of the cat until blood glucose returned to baseline level. To avoid exposure to any trace of the cat remaining in the experimental box, the rats were moved back to their home cages during the poststress period. To assess the pattern of blood glucose change, we defined baseline glucose level (Gbase; mg/dL) as blood glucose level before exposure to the cat and peak glucose level (Gpeak; mg/dL) as the peak level of blood glucose during the stress-loading test. We calculated G (Gpeak to Gbase; mg/dL) to assess the glucose increment induced by the stress. For quantification of total hyperglycemic exposure by stress, we calculated area under the curve of glucose change (total amount of hyperglycemic change caused by stress, ΔGAUC; mg/dL/min) from beginning to end of the stress-loading test. We defined time to reach peak glucose level (Tpeak; min) as the time to reach peak glucose level and time to return to the baseline glucose level from the beginning of the stressor exposure (Ttotal; min) as the time to return to baseline glucose level from the beginning of the stressor exposure. To assess the rate of increase of glucose level, we calculated the increase in glucose. Thus, we defined Grinc(15 min), Grinc(30 min), and Grinc(60 min) (mg/dL/min) as the gradient of increase during the first 15, 30, and 60 minutes from baseline, respectively. Increasing rate of glucose from beginning to peak (Grinc(peak)) was defined as the increase in glucose from baseline level to peak level. We also calculated the decrease in glucose. We defined decreasing rate of glucose from peak level to baseline level (Grdec; mg/dL/min) as the decrease in glucose from peak to baseline level (Fig. 2).
Diabetes models
To perform the stress-loading test on a type 1 diabetes model (T1D), we prepared 10 male Sprague-Dawley (SD) rats with normal glucose level. The rats' weight range was 250 to 300 g. We performed the stress-loading test as a baseline study before development of diabetes. Then, a model of type 1 diabetes was induced by a single intraperitoneal injection of 70 mg/kg streptozotocin. After the streptozotocin injection, we measured fasting plasma glucose level to identify development of diabetes and repeated the stress loading test on the same rats with type 1 diabetes.
We prepared five male Otsuka Long-Evans Tokushima Fatty (OLETF) rats, which is an established model of spontaneous noninsulin-dependent diabetes mellitus or human type 2 diabetes that exhibits obesity, hyperinsulinemia, hypertriglyceridemia, and hyperglycemia [22,23], to perform the stress-loading test on OT2D. Firstly, we performed the intraperitoneal glucose tolerance test (IPGTT) and the stress loading test on 28-week-old OLETF rats with normal glucose level and a weight range of 450 to 550 g. We regularly measured fasting plasma glucose levels during progression to diabetes and repeated IPGTT to confirm the development of diabetes and the stress-loading test on the same OLETF rats at 50 weeks of age after progression to type 2 diabetes.
The Goto-Kakizaki (GK) rat, selectively bred from Wistar rats with increased blood glucose levels, is a well-studied nonobese spontaneous type 2 diabetes animal model [24]. Its main diabetic phenotype is impaired glucose-stimulated insulin secretion (GSIS) [25,26]. To test stress-induced glucose changes in a NOT2D model, we prepared ten male 6-week-old GK rats of 180 to 230 g and performed the stress-loading test on the same rats at both baseline and diabetes stages. All the rats were housed in two or three cages per rat model at a consistent temperature and humidity (12-hour light/dark cycle). They were maintained in conventional animal facilities (~21℃) with ad libitum food and water at the animal facility of The Catholic University of Korea College of Medicine. All investigations on the rats were performed with the approval of the Institutional Animal Care and Use Committee of The Catholic University of Korea College of Medicine, Seoul, Korea.
Statistical analysis
Values were expressed as mean±standard deviation. For comparison of the extent of hyperglycemia induced by predator stress between normal and diabetic states in each diabetes model, we used the independent two-tailed Student t-test. The repeated measures analysis of variance test was used for comparison of the extent of hyperglycemia among the type 1 diabetes, nonobese type 2 diabetes, and OT2Ds. Statistically significant differences were recognized at P<0.05.
RESULTS
Stress-induced hyperglycemia
Type 1 diabetes model
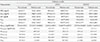
The glucose parameters are shown in Table 1. In normal SD rats, the glucose level was increased by 26.8±9.7 mg/dL with exposure to a cat and returned to baseline after 63.0±5.7 minutes of stress loading. After induction of type 1 diabetes, the glucose increment in the rats with 60 minutes exposure to a cat was dramatically increased over the previous normal state. Glucose level was increased to a peak of 388.2±145.5 mg/dL with an increment of 164.2±67.6 mg/dL and only returned to baseline after about 4 hours, which was a 4-fold increase over the normal state. The glucose increment (ΔG) and ΔGAUC experienced about 5-fold and 20-fold increases, respectively, in the type 1 diabetes state compared with the previous normal state. After stress loading of the rats, the glucose concentration in the blood increased at a rate of 4.8 mg/dL/min during the first 15 minutes in type 1 diabetes, which was a 4-fold increase compared to the normal glucose state. Table 1 shows the definitive differences in blood glucose level changes induced by fear stress between the normal glucose and type 1 diabetes states.
Obese type 2 diabetes model
The results of glucose changes induced by fear stress in the normal and type 2 diabetes stages are shown in Table 1. ΔG induced by stress loading in 28-week-old normal rats was 38.0±11.0 mg/dL, and glucose level peaked at the time of stressor exposure (Tpeak, 19.0±4.2 minutes) and returned to baseline shortly after the stressor was removed (Ttotal, 69.0±11.4 minutes). In the 50-week-old rats with type 2 diabetes, ΔG was 98.5±21.1 mg/dL with stress loading, which was an approximately 3-fold increase over the normal stage, and hyperglycemia persisted for about 3 hours even after the stress was removed. ΔGAUC caused by stress in the type 2 diabetes stage was a greater than 6-fold increase compared to the normal stage. The rate of increase of the glucose level within the initial period of stress loading was 0.9 mg/dL/min in the diabetes stage, which was significantly higher than that of the normal stage (0.3 mg/dL/min, P<0.05) (Table 1).
Nonobese type 2 diabetes model
After exposing the rats to the stressor, the blood glucose concentration increased at a rate of 6.5±1.7 mg/dL/min during the first 15 minutes, which was significantly higher than the baseline rate (2.9±1.4 mg/dL/min, P<0.01). This increased rate of glucose change was still significantly high at 30 and 60 minutes after exposure to the stressor in NOT2D compared with the baseline stage. ΔG (152.6±36.9 mg/dL) and ΔGAUC (14,345.1±6,051.3 mg/dL/min) were significantly greater in the nonobese type 2 diabetes state compared with the baseline stage before development of diabetes.
Patterns of stress-induced hyperglycemia
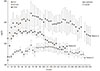
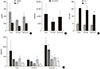
As shown in Fig. 3, the pattern of change in glucose concentration induced by acute fear-like stress differed among the three types of diabetes. The rates of glucose increase within the first 15 minutes after stress loading (Grinc(15 min)) in the T1D and NOT2D were markedly rapid and significantly higher than that in OT2D (T1D, 4.8±2.6 mg/dL/min; NOT2D, 6.5±1.7 mg/dL/min vs. OT2D, 2.0±1.0 mg/dL/min; P<0.01). Glucose increments in T1D and NOT2D were also significantly greater than in OT2D (T1D, 164.2±67.6; NOT2D, 152.6±36.9 vs. OT2D, 98.5±21.1; P=0.045) (Fig. 4). The rate of Grdec was highest in NOT2D (1.6±0. mg/dL/min, P<0.01); subsequently, Ttotal was shortest in this model (61.0±18.5 minutes, P=0.003). In contrast, Grdec was lowest in OT2D (0.7±0.3 mg/dL/min, P<0.01). The analysis revealed three different patterns of change in glucose concentration induced by acute stress according to type of diabetes. As shown in Fig. 3, T1D had pattern A, fast & slow, in which glucose was rapidly increased by the acute stress and slowly decreased after reaching peak level; NOT2D had pattern B, fast & fast, in which glucose rapidly increased and also rapidly decreased; and OT2D had pattern C, slow & slow, in which glucose slowly increased and also slowly decreased.
DISCUSSION
It has been reported that stress plays a role in the etiology and treatment of diabetes mellitus [3]. Activation of the sympathetic nervous system with excessive catecholamine release contributes to pathogenesis of stress-induced hyperglycemia [27,28]. Catecholamines stimulate glycogenolysis and, gluconeogenesis and inhibit insulin secretion [27,29]. However, there have been no reports of differences in stress-induced hyperglycemia between diabetic and nondiabetic patients or on the mechanisms of stress-induced hyperglycemia in diabetes. The present study was the first to demonstrate that glucose level is quantitatively more sensitive to psychiatric stress in diabetic than in normal subjects, and interestingly, the pattern of glucose change differed according to the type of diabetes. We observed prominent glucose increases shortly after stress exposure in the diabetes models, which persisted throughout the stress exposure and even after removal of the stressor. Therefore, we classified the stress-induced hyperglycemia phase into two phases, an in-stress hyperglycemia phase and poststress hyperglycemia phase. However, this phenomenon was not observed in subjects with normal glucose tolerance. Our finding might reflect the stress response in diabetic patients with beta cell failure, insulin resistance, or impaired GSIS. An immediate response of the autonomic nervous system and release of catecholamine occur in the in-stress hyperglycemia phase, and the GSIS and increase of cortisol occur in the poststress phase. Gpeak and increment of glucose level induced by the acute fear stress were significantly higher in all of the diabetes models compared to the normal glucose states, and the increased glucose level induced by the 60-minute stress only returned to baseline after 3 to 4 hours in the diabetes models. In contrast, there were relatively small increments in glucose induced by the stress in the same animal models with normal glucose tolerance status, and the glucose level returned rapidly to baseline, even during the stress exposure. The total amount of hyperglycemia caused by stress loading was increased 20-fold in T1D over the normal state. This impairment of compensation led to severe stress-induced hyperglycemia, which was more prolonged in diabetic than in normal glucose tolerance states.
We found a marked difference between the glucose parameters induced by the same stress before and after diabetes development in the same rats, which suggests that diabetic patients are considerably more sensitive to stress. We hypothesized that rats with normal glucose tolerance had the ability to compensate for stress-induced hyperglycemia, but lost or suffered weakened ability after development of diabetes. Such disability would lead to severe hyperglycemia due to stress, which could be quantified with ΔG, Gpeak, and ΔGAUC.
We also found that the pattern of the change in glucose level induced by the stress differed according to the type of diabetes. To analyze differences in the pattern of glucose fluctuation, we quantified rates of increase and decrease of glucose level. Initial rates of glucose increase were significantly higher in T1D and NOT2D than in OT2D. The rates of glucose increase within 15 minutes of stress loading (Grinc(15 min)) in T1D and NOT2D were two to three times than that in the OT2D, the slowest responder among the three types of diabetes. The rates of glucose increase within the first 30 minutes after stress loading and decrease from Gpeak to baseline were highest in NOT2D. From these results, we characterized the pattern of stress-induced hyperglycemia as follows: pattern A, fast and slow, in which glucose rapidly increased and slowly decreased, was shown in T1D; pattern B, fast & fast, in which glucose rapidly increased and decreased, was shown in NOT2D; and pattern C, slow & slow, in which glucose slowly increased and also slowly decreased, was shown in the OT2D. In a previous study, T1D rats showed higher norepinephrine levels than control rats due to increased sympathetic activity [30]. In another study, ob/ob mice as subjects with obese type 2 diabetes had altered peripheral responses to sympathetic stimuli and glycemic responses to stress [31]. We hypothesized that differences in insulin secretion and insulin resistance could bring about different patterns in glucose change induced by stress loading according to the type of diabetes; also, there are discrepancies in diabetes types with regard to impairment of the autonomic nervous system and response to catecholamine, which could affect these different patterns.
There are several limitations to the present study. Firstly, we used a predator stress model to imitate psychiatric stress in humans. This fear stress may differ from the actual psychiatric stress or emotions like depression, anxiety, and anger experienced by humans. Thus, we cannot directly extrapolate the results of the animal models to humans. Secondly, we used different animal models for the three types of diabetes, which might have influenced the interpretation of the difference in pattern of glucose change induced by the stress. We also did not adjust variables by age of the rats, and we did not use control groups of the same strain and age. Another limitation is that we conducted this test in an acute hyperglycemic state, which meant a short duration of exposure to hyperglycemia for the T1D model. In addition, we did not measure catecholamine, cortisol, or glucagon level, which are considered to play key roles in stress-induced hyperglycemia [4,28,29]. Stressful stimuli can cause elevated glucose level via several different hypothalamic-pituitary pathways. When glucagon or epinephrine is released in physiologic doses, there are modest alterations in glucose regulation in normal subjects. Physiologic increases in stress hormones such as glucagon, epinephrine, and interact cortisol synergistically. Epinephrine enhances glucagon-stimulated glucose production and interrupts glucose uptake, while cortisol maintains elevations in glucose output produced by epinephrine and glucagon [32]. Therefore, we could have found patterns of stress-induced hyperglycemia; it was nothing but observation of phenomenon. The findings in the present study cannot explain why different patterns of stress-induced hyperglycemia were expressed among the three different types of diabetes or why the response to stress was overactive in the diabetic state. Although further study is warranted to evaluate the specific mechanisms of stress-induced hyperglycemia, the current study quantitatively confirmed the characteristics of acute stress-induced hyperglycemia.
Furthermore, we conclude that psychiatric stress has a much greater impact on glucose parameters in diabetes mellitus. Therefore, stress control should be emphasized for more effective diabetes management, which could result in reduced diabetic complications and improved quality of life. We also found that the pattern of glucose change induced by stress differed according to type of diabetes, which could be applied in the actual treatment of patients with different types of diabetes. This study verifies the existence of specific patterns of glucose fluctuation induced by acute stress in diabetes mellitus and confirms the need to control psychiatric stress for more effective diabetes management to help reduce diabetic complications and improve quality of life.
In conclusion, diabetic stage subjects were more vulnerable to acute stress compared to baseline stage subjects, and the pattern of glucose fluctuation differed among the three types of diabetes mellitus. This study provides basic information on stress-induced hyperglycemia; the pattern and characteristics could be used for management of diabetes patients.
 XML Download