

 PDF
PDF ePub
ePub Citation
 Print
Print


INTRODUCTION
In reducing microvascular and macrovascular diabetic complications, there has been little controversy on the need for early intensive glycemic control in subjects with newly detected type 2 diabetes (T2D) since the late 1990s [1]. This consensus is essentially based on the results of controlled clinical trials, such as the Kumamoto study and UK Prospective Diabetes Study, which are prospective randomized studies including a large number of Asian and Western subjects, respectively [1-3]. However, optimal or recommended regimens regarding the selection of hypoglycemic agents to effectively and safely achieve good glycemic status have differed slightly between several guidelines [4-6]. In 2011, the Korean Diabetes Association recommended Clinical Practice Guidelines for T2D in Korea [5]. This guideline recommended lifestyle interventions with metformin as an initial treatment regimen. In addition, initial treatment with a combination of oral hypoglycemic agents (OHAs) or insulin was also recommended at a hemoglobin A1c (HbA1c) level greater than 8.0% at the time of T2D diagnosis. In the same year, the National Health Insurance Corporation (NHIC) established guidelines to enforce metformin-preferred monotherapy as a general initial treatment regimen and metformin-based dual therapies with sulphonylurea (SU), pioglitazone, or DPP4-inhibitor as an initial regimen at an HbA1c level greater than 7.5%. Recently, Yoon et al. [7] reported a reduction in HbA1c level after conducting a double-blind, randomized controlled study over a 48-week period on the efficacy of glimepiride, metformin, and rosiglitazone as antidiabetic monotherapies in drug-naïve, Korean T2D patients. The study showed no statistical difference in the efficacy of glimepiride, metformin, and rosiglitazone as antidiabetic monotherapy. However, there has been no report on the efficacy or safety of metformin-based dual combination therapy for drug-naïve or newly detected Korean T2D patients.
This study was designed to evaluate the effectiveness of glycemic control in drug-naïve or newly detected Korean T2D patients receiving metformin-based dual combination therapy with SU, pioglitazone, or DPP4-inhibitor.
METHODS
Study design
This prospective, nonrandomized, open-label study was conducted at a single center by closely observing metabolic parameters for up to 24 weeks between November 2011 and March 2013. The study protocol entitled 'Efficacy of antidiabetic medications recommended by government guidelines for newly diagnosed or currently medicated T2D patients on metformin and sulfonylurea' was reviewed by the local ethics committee (2011-0670-001). To adhere to the guidelines of NHIC and Institutional Review Board for reimbursement, all subjects with an initial HbA1c level ≥7.5% received metformin and were recommended lifestyle modification; however, the selection of another OHA from SU, pioglitazone, or DPP4-inhibitor was at the discretion of the subjects' physicians. In addition, physicians also determined all subsequent treatment decisions according to usual practice. Participants were examined every 12 to 13 weeks for 24 weeks after the initiation of metformin-based dual combination therapy with OHAs.
We included only drug-naïve T2D patients with an initial HbA1c level ≥7.5% who were first-time visitors to the Severance Diabetes Center. In the final analysis, subjects were excluded if they had a recent (≤6 months) history of major cardiovascular event, including myocardial infarction, unstable angina, moderate to severe congestive heart failure, and/or stroke. In addition, patients with a current hepatic (aspartate aminotransferase [AST], and alanine aminotransferase [ALT] >2.5-fold the upper normal limit), renal (serum creatinine >1.5 mg/dL in men, >1.4 mg/dL in women), hematologic, or gastrointestinal disease or those that had undergone systemic corticosteroid treatment in the previous 12 weeks were excluded. Subjects recruited for the study were classified into three groups according to the combination of metformin and OHA: group I (metformin and either gliclazide-MR or glimepiride), group II (metformin and 15 mg pioglitazone), and group III (metformin and 100 mg sitagliptin).
Complete available medical records from other departments or other institutions were reviewed, and laboratory results meeting the criteria for diabetes (fasting serum glucose ≥126 mg/dL, postprandial serum glucose ≥200 mg/dL, or HbA1c ≥6.5%) were regarded as the onset of diabetes. If data were unavailable, the onset and duration of diabetes were determined by subject recall. Subjects underwent a standardized mixed-meal stimulation test (Glucerna; Abbott Laboratories, Saint-Laurent, QC, Canada) (H4S 1Z; 2 cans, total 474 mL, 474 kcal, 26 g fat, 45.8 g carbohydrate, and 19.8 g protein) for the evaluation of glucose metabolism. The glucose level after a mixed-meal stimulation test was regarded as the baseline postprandial glucose (PPG) level. Plasma glucose level was measured using the glucose oxidase method, and HbA1c was measured with high-performance liquid chromatography using Variant II Turbo (Bio-Rad Laboratories, Hercules, CA, USA). Plasma triglyceride, total cholesterol, high density lipoprotein cholesterol, blood urea nitrogen, creatinine, AST, and ALT levels were assayed with a routine Hitachi 7600 autoanalyzer (Hitachi Instruments Service, Tokyo, Japan). Low density lipoprotein cholesterol level was calculated using Friedewald's equation. Serum insulin and C-peptide levels were measured in duplicate using immunoradiometric assays (Beckman Coulter, Fullerton, CA, USA) with samples individually collected during the standardized mixed-meal stimulation test. Pancreatic β-cell function and insulin sensitivity were determined by homeostasis model assessment (HOMA) of pancreatic β-cell function (HOMA-β; [baseline insulin (µIU/mL)×20]/[0.055551×fasting glucose (mg/dL)-3.5]) and HOMA of insulin resistance (HOMA-IR; [0.055551×fasting glucose (mg/L)×baseline insulin (µIU/mL)]/22.5), respectively.
Tolerability and hypoglycemia assessment
Reasons for discontinuation of the study and treatment-induced major hypoglycemia were recorded to assess tolerability and compliance. A major hypoglycemic event was defined as blood glucose ≤60 mg/dL accompanied by neurological symptoms consistent with hypoglycemia or an episode requiring intervention with intravenous glucose. In addition, other minor adverse events were obtained by patient self-report.
Effectiveness assessment
The primary endpoint was change in HbA1c and fasting and PPG levels from baseline to 24 weeks. The secondary endpoint was the frequency of successfully achieved target HbA1c (≤7.0%) level according to baseline HbA1c.
Statistics
Results are described as mean±standard deviation or median value (low quartile, high quartile). Analysis of variance test was used for comparison of baseline data among the three treatment groups. Kruskal-Wallis test was used for nonparametric statistical analysis. Mann-Whitney test with Bonferroni correction was used as post hoc analysis for nonparametric statistical analysis. Wilcoxon signed rank test was used for comparison of pretreatment and posttreatment values. Multiple linear regression test and Fisher exact test were performed for comparison of treatment effectiveness. Group I was used as a reference group in the multiple regression test because dual therapy with sulfonylurea and metformin is the most traditional combination. Statistical analyses were performed using SPSS version 20 (IBM Co., Armonk, NY, USA). Differences among groups with P<0.05 were considered statistically significant.
RESULTS
Baseline characteristics of the study population
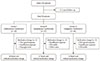
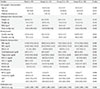
Of the 116 subjects who were enrolled in this study, 17 subjects failed to complete follow-up; 99 subjects were ultimately analyzed and were classified into three groups: group I (n=31, metformin and either gliclazide-MR [n=22 (71.0%), 60 (30 to 60) mg] or glimepiride n=9 [29.0%], 4 [2.5 to 4] mg); group II (n=30, metformin and 15 mg pioglitazone), and group III (n=38, metformin and 100 mg sitagliptin) (Fig. 1). The baseline characteristics of the subjects are described in Table 1. The mean age, body mass index (BMI), and median HbA1c level of the study population were 53.2 years, 26.7 kg/m2, and 9.1%, respectively. No significant difference in diabetes duration or baseline demographics, anthropometrics, or metabolic characteristics was observed among the three groups. Daily metformin dose was smaller in group I than the other two groups (overall, P=0.006; group I vs. group II, P=0.001; group I vs. group III, P=0.012; group II vs. group III, P=0.064).
Tolerability and hypoglycemia assessment
The proportion of participants who completed the study without change in dose or class of initial medications was 90.3% in the SU-treated group I (28/31), 90% in the pioglitazone-treated group II (27/30), and 86.8% in the sitagliptin-treated group III (33/38). There was no significant difference in study completion rate among the groups (P=0.925). In group I, one subject discontinued the study due to very good response and subsequent reduction of medications and another due to insufficient response. In addition, one subject with symptoms of hypoglycemia was prescribed other drugs. In group II, one subject with an insufficient response, one subject with nausea, and one subject concerned with the risk of bladder cancer were switched to other drugs. In group III, one subject with a very good response, three subjects with an insufficient response, and one subject with nausea were switched to other drugs. No major hypoglycemic events occurred among the groups. In addition, one patient in group II reported transient diarrhea, but no other adverse events were reported.
Effectiveness assessment
Primary outcome
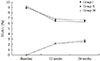
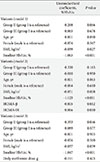
In the 88 patients who completed the study without change of initial medications, the median HbA1c level decreased from 8.9% (8.2 to 10.3) to 6.5% (6.4 to 7.0; at 12-week) and to 6.4% (6.0 to 6.7; at 24-week) in the SU-treated group I (P<0.001 for each); from 9.0% (8.4 to 11.2) to 6.8% (6.5 to 7.3; at 12-week) and to 6.6% (6.1 to 6.9; at 24 weeks) in the pioglitazone-treated group II (P<0.001 for each); and from 9.3% (7.8 to 10.4) to 6.4% (6.3 to 7.0; at 12-week) and to 6.3% (6.0 to 6.7; at 24-week) (P<0.001 for each) in the sitagliptin-treated group III (Fig. 2). The median of individually assessed differences in HbA1c level from baseline to the 12- and 24-week end points were -2.2% (-3.7 to -1.8) and -2.5% (-4.0 to -1.9) in group I; -2.2% (-3.8 to -1.5) and -2.8% (-4.5 to -1.6) in group II; and -2.1% (-4.0 to -1.6) and -2.7% (-4.0 to -1.6) in group III, respectively. In addition, there was no significant difference in the change of HbA1c level of group II and III compared to group I after adjusting for baseline age, sex, BMI, and HbA1c at either the 12-week (group II, P=0.101; group III, P=0.673) or 24-week end point (group II, P=0.066; group III, P=0.678) (Table 2, Fig. 2). However, after additional adjustment of metformin dose, group I showed superiority in HbA1c improvement to group II at the 24-week end point (covariate-adjusted difference in change of HbA1c, 0.35%; P=0.046) (Table 2). Fasting plasma glucose level decreased from 166.5 (139.0 to 195.0) to 103.5 mg/dL (89.0 to 112.0) (P<0.001); 174.0 (145.0 to 223.0) to 111.0 mg/dL (101.5 to 120.0) (P<0.001); and 173.0 (135.0 to 204.0) to 105.0 mg/dL (100.0 to 124.0) (P<0.001) in groups I, II, and III, respectively. PPG level decreased from 226.5 (192.5 to 312.0) to 157.0 mg/dL (133.5 to 196.5) (P<0.001); 238.0 (195.5 to 324.0) to 157.0 mg/dL (124.0 to 219.5) (P<0.001); and 251.0 (196.0 to 306.0) to 148.0 mg/dL (115.0 to 172.0) (P<0.001) in groups I, II, and III, respectively. In addition, there was no significant difference in the change of FBG (group II, P=0.061; group III, P=0.070) or PPG (group II, P=0.914; group III, P=0.237) level among the groups after adjusting for baseline age, sex, BMI, and FBG or PPG. After additional adjustment of metformin dose, group I showed superiority in FBG improvement to group II and group III (covariate-adjusted difference in change of FBG: group 2, 15.9 mg/dL, P=0.008; group 3, 11.6 mg/dL, P=0.032), without significant difference in the change of PPG level.
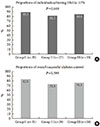
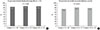
The proportion of individuals who achieved HbA1c level ≤7% at 24 weeks was 89.3%, 81.5%, and 84.8% in groups I, II, and III, respectively, with no statistically significant difference in the proportion among the groups (P=0.649) (Fig. 3A). To minimize selection bias, we performed an additional analysis. Subjects who achieved HbA1c level ≤7% at 24 weeks and those who reduced their medications because of a very good response during the study period were considered to have successfully controlled diabetes; however, other subjects, with the exception of those who did not continue with follow-up observation, were considered to have failed diabetes control. The proportion of individuals with successfully controlled diabetes was 83.9%, 73.3%, and 76.3% in groups I, II, and III, respectively, with no statistically significant difference among the groups (P=0.593) (Fig. 3B).
Secondary and other outcomes
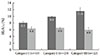
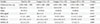
The subjects were also classified into three categories according to HbA1c level: category I (n=43; 7.5%≤HbA1c<9.0%), category II (n=23; 9.0%≤HbA1c<11.0), and category III (n=22; 11.0%≤HbA1c) (Table 3). In addition to different HbA1c level (8.1% vs. 9.9% vs. 11.6%; P<0.001), HOMA-β (34.2 vs. 25.6 vs. 19.8; P=0.008), and HOMA-IR (2.8 vs. 3.6 vs. 3.5; P=0.005) were also significantly different among the categories. The daily dose of metformin was higher in category III than in the other two categories (1,000 mg vs. 1,000 mg vs. 1,700 mg; P<0.001). Despite the difference in baseline HbA1c level and HOMA, no statistically significant difference was observed among the categories after 24 weeks (6.4% [6.1 to 6.8] vs. 6.6% [6.2 to 6.7] vs. 6.0% [5.7 to 6.6)], P=0.051) (Fig. 4). The proportion of individuals who achieved HbA1c ≤7% at 24 weeks was 83.7%, 87.0%, and 86.4% in categories I, II, and III, respectively, with no statistically significant difference among the categories (P=1.000) (Fig. 5A). The proportion of individuals with overall successful diabetes control, as defined above, was 75.0%, 81.5%, 79.2% and similar among categories I, II, and III, respectively (P=0.819) (Fig. 5B).
DISCUSSION
It is well known that significant prevention and reduction of microvascular and macrovascular complications can be achieved with early intensive glycemic control in subjects with newly detected T2D [1,3]. However, to date, scientific studies investigating an optimal combination regimen for metformin-based OHA therapy and its glucose-lowering efficacy have been especially lacking in Korean subjects with T2D. On the basis of previous research, this study focused on the practical implications of a combination regimen for metformin-based OHA therapy in newly diagnosed or drug-naïve Korean T2D patients. Therefore, we attempted to investigate: 1) the tolerability and efficacy of metformin-based dual combination therapy with OHAs by assessing the reduction of HbA1c level as well as the proportion of subjects reaching a target HbA1c level ≤7%; and 2) the appropriateness of current guidelines established by the NHIC of Korea, which mandates the number of OHAs prescribed by analyzing the proportion of subjects reaching a target HbA1c level ≤7% according to initial HbA1c.
In this study, 99 Korean T2D subjects who were newly diagnosed with the disease or who were drug-naïve underwent dual therapy with a combination of metformin and OHA (SU [either gliclazide-MR or glimepiride], 15 mg pioglitazone, or 100 mg sitagliptin) over a 24-week study period. By the end of the study, the percentage of subject with initial HbA1c level ≥7.5% decreased by 2.5% to 2.7%. In previous studies, most OHAs decreased HbA1c level by about 1% when used as a monotherapy, and by about 2% when used as a combination therapy [8,9]. The differences between our results and those of previous studies might be due to the higher baseline HbA1c levels, drug-naïve characteristics, and lower insulin resistance of our subjects. Our study did not exclude subjects with very high HbA1c level, unlike many previous studies which set an upper limit of initial HbA1c [10-12]. Moreover, the baseline HbA1c (9.1%) of our study was higher than those of most previous studies (7.6% to 8.8%) [10-15]. Because initial HbA1c level did not alter the endpoint HbA1c level in our study, this higher baseline HbA1c seems to have mostly affected the degree of HbA1c reduction. Contrary to many studies evaluating patients taking OHA prior to the study, which reported higher HbA1c (6.9% to 7.2%) at endpoint than our study [13,14], several studies evaluating drug-naïve diabetes patients observed final HbA1c levels of about 6.5% after using a combination of two drugs, which is similar to our results [10-12]. The HOMA-IR of our study (3.2) was lower than those of previous studies (3.6 to 7.0) [12-14,16]. Even though HOMA-IR has limited value when compared across different populations [17], this finding may suggest that our subjects had better insulin sensitivity than subjects in previous studies.
In the aspects of tolerability and glycemic effectiveness, the three dual therapies using a combination of metformin and either sulfonylurea, pioglitazone, or sitagliptin led to similar proportions of subjects adhering to the initial regimen, similar degrees of HbA1c improvement, and similar proportions of subjects reaching the target HbA1c level. However, after adjustment of daily metformin dose, which was determined according to physician judgment in usual practice, sulfonylurea reduced HbA1c by a greater magnitude than did pioglitazone. This finding suggests that pioglitazone and metformin combination could partially overcome the lower intrinsic potency of pioglitazone by using a higher dose of metformin in real practice.
Interestingly, baseline HbA1c level did not affect the endpoint HbA1c level in this study. Moreover, the proportion of individuals who reached a target HbA1c level ≤7.0% was similar across the groups, although their baseline HbA1c levels were significantly different. It is well known that patients with higher baseline HbA1c level have greater reduction of HbA1c irrespective of drug class [18,19]. Because each drug results in a greater reduction of HbA1c according to higher baseline HbA1c, when two drugs are used simultaneously, the increased reduction of HbA1c according to higher baseline HbA1c might show a greater magnitude due to the additive effect. This tendency was also shown in previous studies, even though statistical analysis was not performed [10,19]. Another possible explanation is preserved insulin sensitivity of the study patients. HOMA-IR of subjects with the highest initial HbA1c level was 3.5 in this study, which was relatively lower than reported in other studies (3.6 to 7.0) which have assessed the efficacy of dual regimens [12-15]. In our study, a one unit increase of HOMA-IR resulted in a 0.066%, increase of HbA1c at endpoint. The other explanation is the higher metformin dose for patients with higher initial HbA1c level. These results indicate that, even at a very high baseline HbA1c level, therapy with a combination of two drugs may still be effective in drug-naïve subjects whose insulin sensitivity remains preserved. This finding supports the current guidelines for OHA selection, which do not recommend initial therapy using a combination of three OHAs [4-6].
This study has several limitations. The patients were not randomized, and the criteria for changing medications were not uniform because all treatment decisions were determined by diabetologists specifically for each patient. However, the baseline characteristics of the three groups did not show statistically significant differences. Furthermore, supplemental analysis of all subjects, except for those who did not continue with follow-up observation, showed similar statistical results to the analysis of subjects who did not change their medications throughout the study. In addition, the number of participants was small, and the rate of follow-up loss was 14.7% at the end of the study. Therefore, the reliability of our trial was lower than originally expected at the time the study was first designed.
In conclusion, metformin-based dual combination therapies with OHAs including sulfonylurea, pioglitazone, or sitagliptin showed similar glycemic effectiveness in drug-naïve Korean subjects with newly diagnosed T2D. Combination therapy using these OHA drugs was similarly effective in patients with a wide range of initial HbA1c level. Based on these results, we suggest the appropriateness of the current guidelines established by the NHIC of Korea, which do not allow initial three drug combinations and recommend metformin-based dual combination therapy with OHAs including sulfonylurea, pioglitazone, or DPP4-inhibitor in subjects with initial HbA1c level ≥7.5%. This study is the first to compare the glycemic effectiveness of dual combination agents commonly used as primary medications in Korean T2D patients. An additional randomized study with a larger number of subjects is warranted to obtain more detailed information including glucose variability.
 XML Download