

 PDF
PDF ePub
ePub Citation
 Print
Print


INTRODUCTION
Type 2 diabetes mellitus is often accompanied by an increase in free fatty acids. High concentrations of glucose and fatty acids are known to cause dysfunction of insulin secretion and to adversely affect survival in pancreatic beta cells [1-4]. Insulin synthesized in beta cells is secreted and controlled in an elaborate way. The insulin gene promoter plays an important role in the expression of insulin [5-8]. Many transcription factors bind to the insulin promoter, and among them, pancreatic and duodenal homeobox 1 (Pdx1) is the most important. It is also well known that Pdx1 is an essential transcription factor in the developments of the pancreas and islets. Pdx1 binds to the insulin gene promoter and also interacts with other transcription factors and proteins (e.g., MafA, BETA2, E47) in order to regulate the expression of insulin [9-12].
Oxidative stress is considered to be one of the main causes of chronic complications in type 2 diabetes; however, it also has adverse effects on the function and survival of beta cells. According to recent studies, oxidative stress in beta cells activates JNK MAP kinase and induces Pdx1 nucleo-cytoplasmic translocation, while also reducing the expression of the insulin gene [13-16]. However, in cases in which beta cells are simultaneously exposed to high levels of glucose and fatty acids, few reports have indicated that nucleo-cytoplasmic translocation of Pdx1 occurs. Therefore, we investigated whether high levels of glucose and fatty acids in beta cells cause oxidative stress and nucleo-cytoplasmic translocation of Pdx1.
METHODS
Materials
H2-dichlorodihydroflurescein diacetate (DCFDA) was obtained from Molecular Probes Inc. (Eugene, OR, USA). pGEM-T Easy Vector, pGL3 Luciferase Reporter Vector and CMV-driven β-galactosidase expression vector were from Promega (Madison, WI, USA), and Top-PfuTM DNA polymerase from Bio-online (Seoul, Korea). Anti-mouse Pdx1 antibody was obtained from Developmental Studies Hybridoma Bank (Iowa City, IA, USA). Western blotting and luminal reagents were from Santa Cruz Biotechnology (Santa Cruz, CA, USA). INS-1 mice beta cells were donated by Professor Kyu-Jang Won at Yeungnam University. Pdx1 plasmids fused with insulin promoter, Pdx1 promoter plasmid, and GFP were donated by Professor Myung-Jun Kim at the Catholic University College of Medicine.
Culture of INS-1 cell
INS-1 cells were cultured in RPMI-1640 culture medium containing 10% FBS, 11.1 mM glucose and 2 mM L-glutamine at 37℃ with 5% CO2. After the cells were cultured in six-well plates at 70-80% confluency, they were incubated in the absence of FBS for 16 hours. Then, 30 mM glucose, 0.25 mM palmitate, and 1% BSA were added to the medium for 48 hours. Some experiments involved pretreatment with N-acetyl-L-cysteine (NAC), an antioxidant, or SP600125, a JNK inhibitor.
Intracelluar production of reactive oxygen species (ROS)
In order to measure the intracellular production of ROS, cells were exposed to 25 µM H2-DCFDA for 2 hours. Fluorescently stained cells were subjected to fluorescence-activated cell sorting (FACS).
Reverse transcription-polymerase chain reaction (RT-PCR)
RNA extraction, cDNA synthesis and PCR were performed using commercial kits. The primers were designed based on the sequences of the mouse genes (for insulin, forward: 5'-TCTTCTACACACCCATGTCCC-3'; reverse: 5'-GGTGCAGCACTGATCCAC-3'; for Pdx1, forward: 5'-CGGACATCTCCCCATACG-3'; reverse: 5'-AAAGGGAGATGAACGCGG-3'). Cyclophillin was used as the control gene (forward: 5'-AACCCCACCGTGTTCTTC-3'; reverse: 5'-TGCCTTCTTTCACCTTCCC-3'). Semi-quantitative analysis of the PCR products was done.
Extraction of nuclear proteins
Extraction of nuclear proteins was done as reported previously [17]. The cells were removed by a cell lifter and centrifuged at 1,500 g at 4℃ for 5 minutes. Then, they were resuspended in 300 µL buffer solution A (10 mM HEPES, pH 7.9, 1.5 mM MgCl2, 10 mM KCl, 0.5 mM DTT, 0.5 mM PMSF) to a final concentration of 0.6%. Nonidet P-40 was then added, and the cells were placed on ice for 15 minutes to destroy the cytoplasmic membranes. After the precipitation, the samples were centrifuged at 12,000 g for 30 seconds, resuspended in 100 µL hypertonic buffer solution B (20 mM HEPES, pH 7.9, 25% [v/v] glycerol, 420 mM NaCl, 1.5 mM MgCl2, 0.2 mM EDTA, 1 mM DTT, 0.5 mM PMSF) and incubated on ice for 30 minutes before being centrifuged again at 12,000 g for 30 minutes at 4℃. All samples were stored at -80℃ for use when needed.
Western blot analysis
Western blot analysis was done as reported previously [18]. Cells were incubated in RIPA buffer (25 mM Tris-HCl, pH 7.4, 0.1% SDS, 0.1% Triton X-100, 1% sodium deoxycholate, 150 mM NaCl, 1 mM EDTA, 1 mM Na3VO4, 1 mM PMSF, 10 µg/mL aprotinin and 5 µg/mL leucopeptin) and then centrifuged at 10,000 g for 30 minutes at 4℃. After electrophoresis in 10% SDS-polyacrylamide gel, the proteins were transferred to a nitrocellulose membrane in a transfer tank filled with transfer buffer (20% methanol, 25 mM Tris, and 192 mM glycine) for 2 hours at 70 V. In order to block the nonspecific binding, the nitrocellulose membrane was incubated with 5% skim milk in TTBS (20 mM Tris-HCl, pH 7.4, 500 mM NaCl, and 0.1% Tween 20) for 1 hour. Pdx1 antibody (0.5 µg/mL) was added at 4℃ for 16 hours. Then, a peroxidase-conjugated secondary antibody (0.5 µg/mL) was added at room temperature for 1 hour. Equal loading and transfer of samples were verified by the band intensity of β-tubulin.
Measurement of promoter activity
We measured the activity of each promoter by performing co-transfection of insulin promoter plasmid or Pdx1 promoter plasmid and pCMV/β-gal plasmid. INS-1 cells were cultured at a density of 2 × 10⁵ cells/mL in 12-well plates for 24 hours. The DNA was mixed with OPTI-MEM medium and incubated for 15 minutes at room temperature. The mixture of 50 µL OPTI-MEM medium and 2 µL FuGENE6 was added and incubated for 30 minutes. The mixture of DNA and FuGENE6 was added to the cultured cells and incubated for 16 hours. After washing the cells with PBS, 30 mM glucose and 0.25 mM palmitate were incubated for 48 hours. Cells were washed with PBS and dissolved with 1 × reporter lysis buffer and repeatedly frozen and thawed. The samples were centrifuged at 12,000 g for 10 minutes at 4℃, and then the supernatant was extracted. The activities of luciferase and β-galactosidase were each measured using a luminometer (TD20/20; Turner Designs Instrument, Sunnyvale, CA, USA) and a MR700 microplate reader (Dynatech Laboratories Inc., Chantilly, VA, USA). Transfection efficiencies were normalized by a ratio of luciferase activity to β-galactosidase activity.
Observation of nucleo-cytoplasmic translocation
To investigate the intracellular nucleo-cytoplasmic translocation of Pdx1 in beta cells, Pdx1 plasmid fused with GFP was transiently transfected with FuGENE6 transfection solution. After INS-1 cells were cultured at a concentration of 2 × 10⁵ cells/mL in six-well plates for 24 hours, DNA (1 µg) was mixed with 100 µL OPTI-MEM medium and incubated for 15 minutes. Then, a mixture of 100 µL OPTI-MEM medium and 6 µL FuGENE6 solution was added and incubated for 30 minutes at room temperature. After the prepared mixture of DNA and FuGENE6 solution was added to the cultured cells, they were incubated for 16 hours. The cells were washed with PBS, 30 mM glucose and 0.25 mM palmitate were added and then the cells were cultured for 48 hours. After incubation, cells were fixed in 4% PFA, and GFP antibodies (1:100) were used to stain the cells. The translocate of Pdx1 in the cells was observed using confocal microscopy.
Statistical analysis
The experimental results are presented as the average ± standard deviation, and the comparison between experimental groups was analyzed using Prism software (GraphPad Software, San Diego, CA, USA) and one-way ANOVA. A Bonferroni multiple range t-test was used for the post test. Statistical significance was set at P < 0.05.
RESULTS
Changes of insulin and Pdx1 mRNA expression by high levels of glucose and palmitate
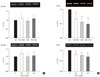
To investigate how high levels of glucose and palmitate affect to the expression of insulin and PDX-1 genes, we treated INS-1 cells with 30 mM glucose and 0.25 mM palmitate both separately and combined. After 48 hours, the expression of insulin gene was not significantly changed and expression of Pdx1 gene was decreased by high levels of glucose and palmitate. The combined treatment had a greater inhibitory effect on gene expression than did the single treatment (Fig. 1A). Also, to investigate whether ROS was affected to expression of insulin and PDX-1 gene, hydrogen peroxide was treated to INS-1 cells. The expression of insulin gene was not significantly changed and expression of Pdx1 gene was decreased in concentration dependent manner (Fig. 1B).
Generation of ROS by high levels of glucose and palmitate
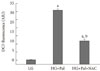
To investigate whether high levels of glucose and palmitate induced ROS generation in INS-1 cells, we exposed INS-1 cells to high levels of glucose and palmitate for 48 hours and then, treated with H2-DCFDA for two hours, we measured intracellular ROS using FACS. We were known that the high levels of glucose and palmitate increased the generation of ROS in INS-1 cells. We also observed partial inhibition of ROS generation by treatment with the antioxidant NAC (Fig. 2).
Changes in the activities of insulin and Pdx1 promoter by high levels of glucose and palmitate
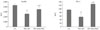
To investigate whether high levels of glucose and palmitate affect to the activities of the insulin and Pdx1 promoters, we performed promoter luciferase assay. The high levels of glucose and palmitate induced a significant decrease in the promoter activities of both genes. Also, we observed that the antioxidant NAC prevented the decrease in promoter activity. Therefore, these results suggest that ROS is involved in the decrease of insulin and Pdx1 gene expressions induced by high levels of glucose and palmitate (Fig. 3).
Changes in the expression and nucleo-cytoplasmic translocation of Pdx1 protein caused by high levels of glucose and palmitate
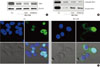
The decrease in the expression of Pdx1 protein in response to high levels of glucose and palmitate was confirmed using Western blot analysis (Fig. 4A). The decrease in Pdx1 protein expression was not prevented by NAC or JNK inhibitor (SP6 00125). However, decrease of Pdx1 protein in the nucleus was observed, and this decrease was prevented by treatment with NAC or SP600125 (Fig. 4B). To confirm these results, we infected beta cells with a GFP: Pdx1 plasmid and observed the nucleo-cytoplasmic translocation of Pdx1 by high levels of glucose and palmitate. Through confocal microscopy, we observed that Pdx1 proteins are presented to the cytoplasm by high levels of glucose and palmitate (Fig. 4C).
DISCUSSION
The chronic increases in blood glucose and fatty acids in type 2 diabetes are known to cause impairment or damage to beta cells. Oxidative stress is one causal factor; however, ROS are generated due to mitochondrial dysfunction regarding the production of intracellular energy. Normally, the generation of ROS in the cell is a naturally occurring process. The majority of normal cells have the ability to remove ROS generated in this manner using antioxidant enzymes [1-4]. However, the expressions of antioxidant enzymes in beta cells are lower than those in other cells and tend to be more sensitive to damage from these types of ROS [19,20]. In this study, we observed the increased generation of ROS after exposure of INS-1 cells to high levels of glucose and palmitate. Therefore, we think that ROS induced by the high levels of glucose and fatty acids may cause dysfunction of the beta cells.
Many studies exist on the subject of the diabetes states, illustrating mechanisms causing decrease of insulin and Pdx1 gene expression in beta cells. Recently, it has been reported that oxidative stress is related to the regulation of insulin gene [14,21,22]. The decrease in Pdx1 gene expression caused by high levels of glucose and palmitate was observed by analyzing RT-PCR and promoter activity. Also, hydrogen peroxide decreased Pdx1 gene expression in concentration dependent manner. Therefore, these results indicate that the increase in ROS induced by high levels of glucose and palmitate lead to the decrease of Pdx1 protein. It is thought that the inhibition of Pdx1 gene expression occurs by an oxidative stress caused through this manner. However, in high levels of glucose and palmitate, insulin gene expression as measured by RT-PCR does not change and measured by promoter activity decreases. This result may be due to the long half-life of the insulin gene (29 to 77 hours) compared to the 48 hours of exposure in the experimental conditions.
Forkhead box O1 (FoxO1) responds to various stimuli, and in cellular metabolism, differentiation, and at the various stages, the involved transcription factor is known. In beta cell, FoxO1 regulates Pdx1 expression [14,21,22]. Depending on the state of phosphorylation, FoxO1 is known to accumulate in the nucleus or cytoplasm. The phosphorylation of FoxO1 is mediated by activated AKT induced by various growth factors (IGF-1, EGF, NGF), and the phosphorylated FoxO1 is translocated from the nucleus to the cytoplasm. Oxidative stress induces dephosphorylation of FoxO1, and dephosphorylated FoxO1 is translocated to the nucleus.
In beta cells, activated JNK by oxidative stress induces the dephosphorylation of FoxO1, and decrease of Pdx1 and insulin gene expressions through dephosphorylated FoxO1 have also been reported. In other words, dephosphorylated FoxO1 moves to the nucleus, leading to exclusion of Pdx1 from the nucleus [13,21,22]. In this study, high levels of glucose and palmitate caused the nucleo-cytoplasmic translocation of Pdx1 protein. Also, the nucleo-cytoplasmic translocation of Pdx1 protein was inhibited by the antioxidant NAC and the inhibitor of JNK (SP600125).
High levels of glucose and palmitate induce the nucleo-cytoplasmic translocation of Pdx1 protein via generation of ROS in the beta cells. Therefore, Pdx1 protein is involved in the transcriptions of insulin and Pdx1 genes in this manner. However, antioxidant (NAC) or JNK inhibitor did not inhibit the decrease of Pdx1 protein, and additional research on this result is required.
In conclusion, this study show that high levels of glucose and free fatty acids in beta cells cause adverse effects on the cellular functions of beta cells via oxidative stress, which causes nucleo-cytoplasmic translocation of Pdx1 protein and leads to decrease in Pdx1 gene expression.
 XML Download