

 PDF
PDF ePub
ePub Citation
 Print
Print


Abstract
It was sometimes difficult to differentiate between acute-onset chronic inflammatory demyelinating polyneuropathy (A-CIDP) and subacute inflammatory demyelinating polyneuropathy (SIDP). The CNS involvement of these polyneuropathies has rarely reported in the literature. We present the case of a 42-year-old man who developed rapidly developing inflammatory demyelinating polyneuropathy followed by right optic neuritis. This case showed progressive motor weakness and sensory dysfunction with time to nadir at 8 weeks, demyelination in nerve conduction study, no other etiology of neuropathy, no relapse during follow-up of 18 months, good response to steroid and complete recovery which favor SIDP more than A-CIDP. We experienced the case of SIDP associated with optic neuritis.
Go to : 
REFERENCES
1.Oh SJ., Kurokawa K., de Almeida DF., Ryan HF Jr., Claussen GC. Subacute inflammatory demyelinating polyneuropathy. Neurology. 2003. 61:1507–1512.

2.Laura M., Leong W., Murray NM., Ingle G., Miszkiel KA., Altmann DR, et al. Chronic inflammatory demyelinating polyradiculoneuropathy: MRI study of brain and spinal cord. Neurology. 2005. 64:914–916.
3.Stojkovic T., de Seze J., Hurtevent JF., Arndt C., Beaume A., Hache JC, et al. Visual evoked potentials study in chronic idiopathic inflammatory demyelinating polyneuropathy. Clin Neurophysiol. 2000. 111:2285–2291.
4.Gartzen K., Katzarava Z., Diener HC., Putzki N. Peripheral nervous system involvement in multiple sclerosis. Eur J Neurol. 2011. 18:789–791.
5.Misawa S., Kuwabara S., Mori M., Hayakawa S., Sawai S., Hattori T. Peripheral nerve demyelination in multiple sclerosis. Clin Neurophysiol. 2008. 119:1829–1833.
6.Holtkamp M., Zschenderlein R., Bruck W., Weber JR. Chronic inflammatory demyelinating polyradiculoneuropathy with histologically proven optic neuritis. Acta Neuropathol. 2001. 101:529–531.
7.Berger T., Weerth S., Kojima K., Linington C., Wekerle H., Lassmann H. Experimental autoimmune encephalomyelitis: the antigen specificity of T lymphocytes determines the topography of lesions in the central and peripheral nervous system. Lab Invest. 1997. 76:355–364.
8.Ruts L., Drenthen J., Jacobs BC., van Doorn PA. Distinguishing acute-onset CIDP from fluctuating Guillain-Barre syndrome: a prospective study. Neurology. 2010. 74:1680–1686. 9. Chowdhury D, Arora A. Axonal Guillain-Barre syndrome: a critical review. Acta Neurol Scand 2001;103: 267-277.
9.Kim DH., Yoon YC., Lee KK., Kwon OS. Guillain-Barre syndromes accompanied by optic neuritis. J Korean Neurol Assoc. 1997. 15:1199–1202.
Go to :
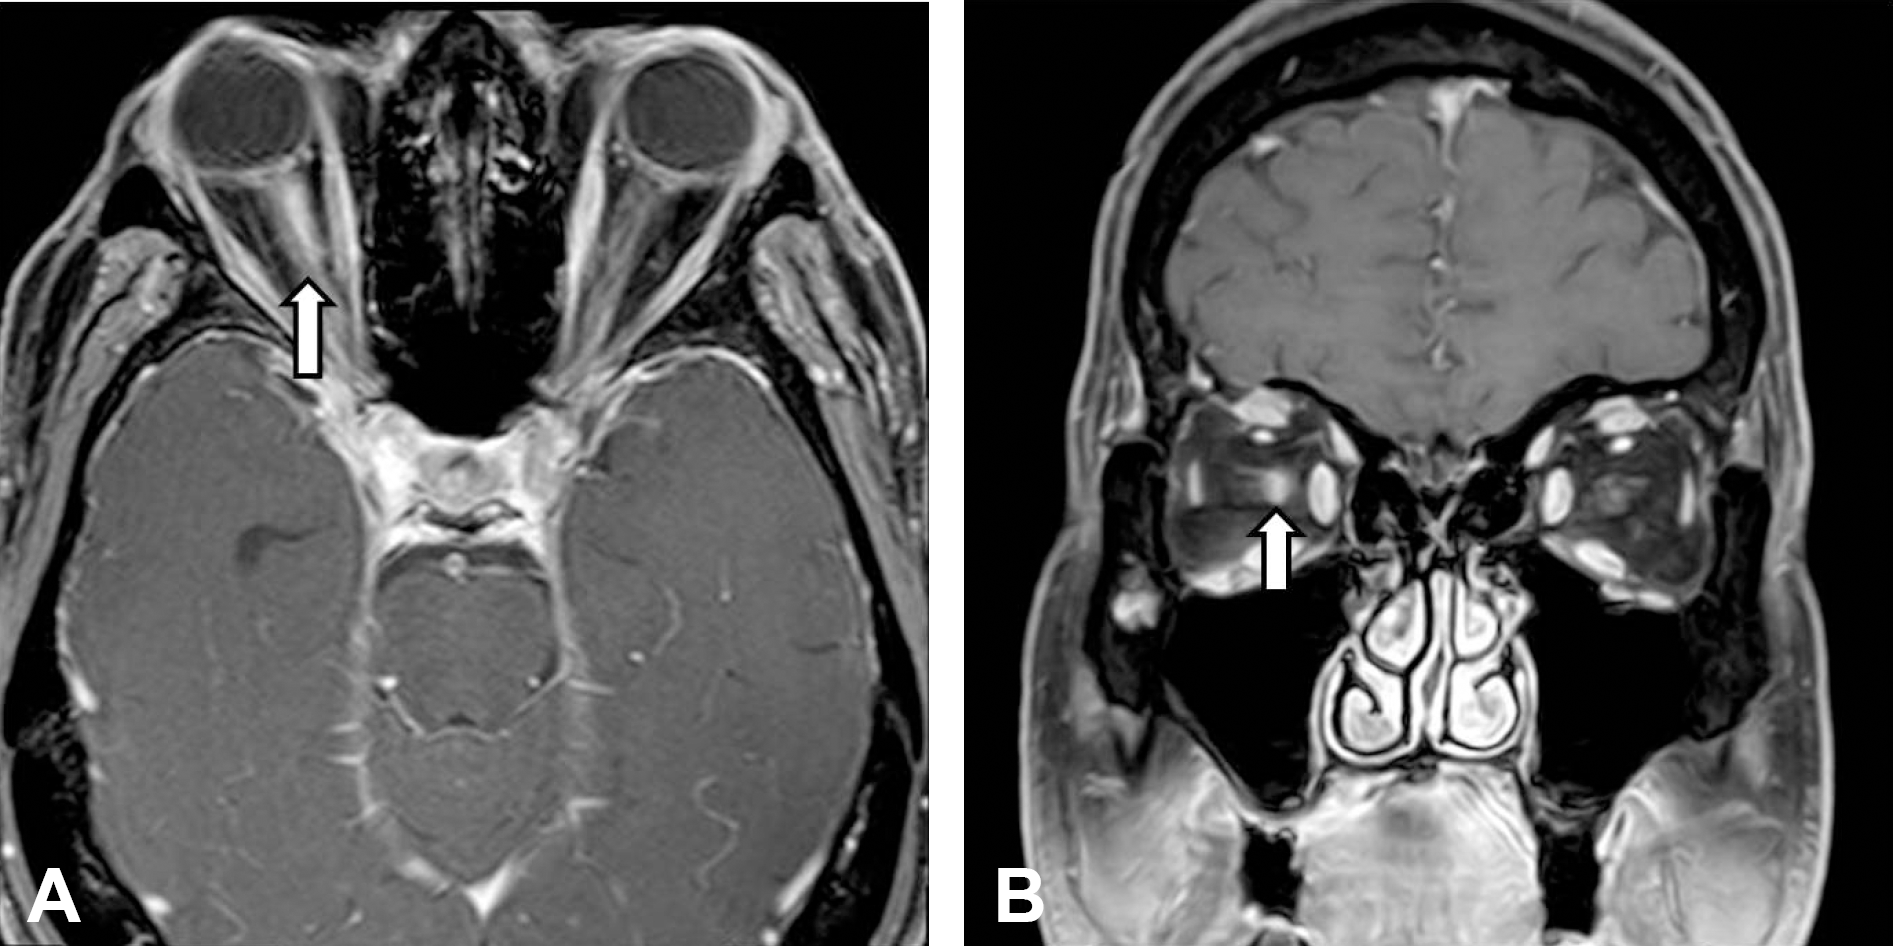 | Figure 1.Brain MRI of patient. Fat suppression T1 post-gadolinium scan showed the edema and enhancement of the right optic nerve (arrow) (A: axial, B: coronal). |
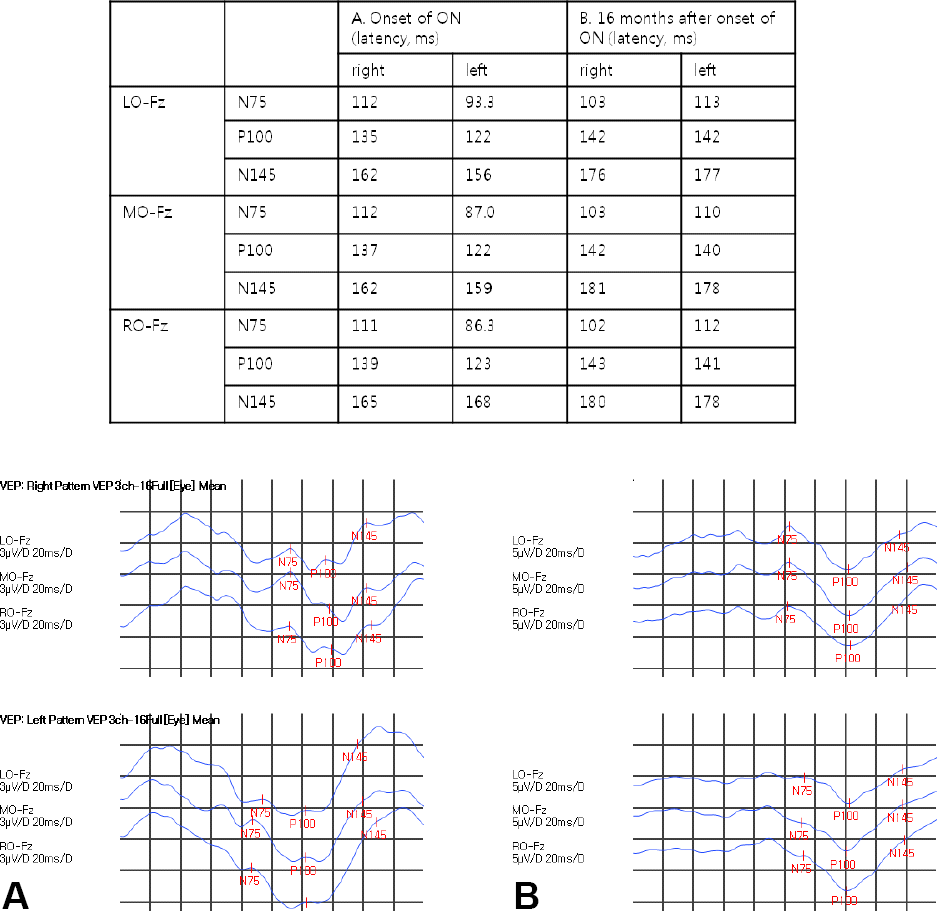 | Figure 2.Pattern shift visual evoked potential of patient. The graph showed “W” shaped P100 wave formation and bilateral prolonged P100 latency at onset of optic neuritis (A), and normal wave formation and prolonged P 100 latency bilaterally after 16 months (B). LO; left occipital, Fz; fontal zero, MO; midline occipital, RO; right occipital, ON; optic neuritis. |
Table 1.
Nerve conduction studies of the patient
All tests were performed in the right side.
SNAP amplitude (µV), CMAP amplitude (mV).
Lat; latency, Amp; amplitude, CV; conduction velocity, MS f-w; median sensory finger-wrist, MS w-e; median sensory wrist-elbow, US f-w; ulnar sensory finger-wrist, US w-e; ulnar sensory wrist-elbow, SS; sural sensory, SPS; superficial peroneal sensory, MM-W; median motor wrist, MM-E; median motor elbow, UM-W; ulnar motor wrist, UM-E; ulnar motor elbow, CPM-A; common peroneal motor ankle, CPM-F; common peroneal motor fibular head, PTM-A; posterior tibial motor ankle, PTM-K; posterior tibial motor knee, M-F; median F-wave, U-F; ulnar F-wave, CP-F; commo peroneal F-wave, PT-F; posterior tibial F-wave, H; H-reflex, NR; no response.
 XML Download