Abstract
Background and Objectives
The extent of weight gain and its association with clinical factors in patients undergoing radioiodine therapy for differentiated thyroid cancer remain unclear. We analyzed clinical factors related to sustained weight gain after serum thyroid-stimulating hormone (TSH) stimulation for radioiodine (I-131) therapy.
Materials and Methods
The study population included 301 adult patients who underwent total thyroidectomy followed by radioiodine therapy and visited the thyroid clinic regularly. Group 1 received a single radioiodine therapy treatment, while group 2 received multiple radioiodine treatment. Data on transient weight gain, defined as weight gain that resolved (±5%) within 1 year after radioiodine therapy, were collected from medical records. Sustained weight gain was defined as body mass index after treatment (BMI post) – BMI before treatment (BMI pre) ≥2 kg/m2 more than 1 year following radioiodine therapy. Subjective symptoms were scored by questionnaire. Logistic regression analysis was performed using various clinical and laboratory factors to identify risk factors associated with sustained weight gain.
Results
Two hundred and fifty-nine (86%) patients showed transient weight gain and 23 (8%) patients showed sustained weight gain. TSH at therapy and T4-on TSH differed significantly in all patients and in the patients in group 1 with sustained weight gain. The proportion of patients with basal BMI≥25 kg/m2 in group 1 with sustained weight gain also differed significantly. Univariate analysis revealed that high serum levels of TSH at therapy (≥100 μ IU/mL) and hypercholesterolemia were associated with sustained weight gain in group 1. Multivariate analysis showed that TSH at therapy levels ≥100 μ IU/mL was associated with sustained weight gain in group 1. Of 283 patients remaining after excluding those with insufficient TSH suppression during follow-up, T4-on TSH levels were lower in the sustained weight gain group compared to those without sustained weight gain. TSH at therapy levels ≥100 μ IU/mL were significantly associated with sustained weight gain in multivariate analysis.
Conclusion
Most patients (86%) had transient weight gain after TSH at therapy, while 8% of patients showed sustained weight gain. Univariate and multivariate analysis revealed relatively high TSH levels (≥100 μ IU/mL) to be a risk factor for patients that received a single dose of radioiodine therapy. Insufficient T4 dose was not associated with sustained weight gain.
Go to : 
References
1. Wartofsky L, Van Nostrand D. Radioiodine treatment of well-differentiated thyroid cancer. Endocrine. 2012; 42(3):506–13.

2. Handkiewicz-Junak D, Wloch J, Roskosz J, Krajewska J, Kropinska A, Pomorski L, et al. Total thyroidectomy and adjuvant radioiodine treatment independently decrease locoregional recurrence risk in childhood and adolescent differentiated thyroid cancer. J Nucl Med. 2007; 48(6):879–88.

3. Sohn SY, Joung JY, Cho YY, Park SM, Jin SM, Chung JH, et al. Weight changes in patients with differentiated thyroid carcinoma during postoperative longterm follow-up under thyroid stimulating hormone suppression. Endocrinol Metab (Seoul). 2015; 30(3):343–51.

4. Yoo ID, Kim SH, Seo YY, Oh JK, O JH, Chung SK. The success rate of initial (131)i ablation in differentiated thyroid cancer: comparison between less strict and very strict low iodine diets. Nucl Med Mol Imaging. 2012; 46(1):34–40.

5. Goh VH, Tain CF, Tong TY, Mok HP, Wong MT. Are BMI and other anthropometric measures appropriate as indices for obesity? A study in an Asian population. J Lipid Res. 2004; 45(10):1892–8.

6. Virdis A, Neves MF, Duranti E, Bernini G, Taddei S. Microvascular endothelial dysfunction in obesity and hypertension. Curr Pharm Des. 2013; 19(13):2382–9.

7. Forte V, Pandey A, Abdelmessih R, Forte G, Whaley-Connell A, Sowers JR, et al. Obesity, diabetes, the cardiorenal syndrome, and risk for cancer. Cardiorenal Med. 2012; 2(2):143–62.

8. Jee SH, Yun JE, Park EJ, Cho ER, Park IS, Sull JW, et al. Body mass index and cancer risk in Korean men and women. Int J Cancer. 2008; 123(8):18926.

9. Wang YC, McPherson K, Marsh T, Gortmaker SL, Brown M. Health and economic burden of the projected obesity trends in the USA and the UK. Lancet. 2011; 378(9793):81525.

10. Fagour C, Gonzalez C, Pezzino S, Florenty S, Rosette-Narece M, Gin H, et al. Low physical activity in patients with type 2 diabetes: the role of obesity. Diabetes Metab. 2013; 39(1):85–7.

12. Rathi MS, Miles JN, Jennings PE. Weight gain during the treatment of thyrotoxicosis using conventional thyrostatic treatment. J Endocrinol Invest. 2008; 31(6):505–8.

13. Brunova J, Bruna J, Joubert G, Koning M. Weight gain in patients after therapy for hyperthyroidism. S Afr Med J. 2003; 93(7):529–31.
14. Pears J, Jung RT, Gunn A. Long-term weight changes in treated hyperthyroid and hypothyroid patients. Scott Med J. 1990; 35(6):180–2.

15. Watts MR, Moore A, Alexander WD. Weight gain and treatment for thyrotoxicosis. QJM. 2002; 95(1):57–8.

16. Jonklaas J, Nsouli-Maktabi H. Weight changes in euthyroid patients undergoing thyroidectomy. Thyroid. 2011; 21(12):134351.

17. Giuffrida FM, Guedes AD, Rocco ER, Mory DB, Dualib P, Matos OS, et al. Heterogeneous behavior of lipids according to HbA1c levels undermines the plausibility of metabolic syndrome in type 1 diabetes: data from a nationwide multicenter survey. Cardiovasc Diabetol. 2012; 11:156.

18. Sorisky A, Bell A, Gagnon A. TSH receptor in adipose cells. Horm Metab Res. 2000; 32(11–12):46874.

19. Bell A, Gagnon A, Grunder L, Parikh SJ, Smith TJ, Sorisky A. Functional TSH receptor in human abdominal preadipocytes and orbital fibroblasts. Am J Physiol Cell Physiol. 2000; 279(2):C335–40.

20. Murakami M, Kamiya Y, Morimura T, Araki O, Imamura M, Ogiwara T, et al. Thyrotropin receptors in brown adipose tissue: thyrotropin stimulates type II iodothyronine deiodinase and uncoupling protein-1 in brown adipocytes. Endocrinology. 2001; 142(3):1195–201.
21. Davies T, Marians R, Latif R. The TSH receptor reveals itself. J Clin Invest. 2002; 110(2):161–4.

22. Lu S, Guan Q, Liu Y, Wang H, Xu W, Li X, et al. Role of extrathyroidal TSHR expression in adipocyte differentiation and its association with obesity. Lipids Health Dis. 2012; 11:17.

23. Ambrosi B, Masserini B, Iorio L, Delnevo A, Malavazos AE, Morricone L, et al. Relationship of thyroid function with body mass index and insulin-resistance in euthyroid obese subjects. J Endocrinol Invest. 2010; 33(9):640–3.

24. de Lloyd A, Bursell J, Gregory JW, Rees DA, Ludgate M. TSH receptor activation and body composition. J Endocrinol. 2010; 204(1):13–20.

25. Valyasevi RW, Erickson DZ, Harteneck DA, Dutton CM, Heufelder AE, Jyonouchi SC, et al. Differentiation of human orbital preadipocyte fibroblasts induces expression of functional thyrotropin receptor. J Clin Endocrinol Metab. 1999; 84(7):): 2557–62.

26. Crisp M, Starkey KJ, Lane C, Ham J, Ludgate M. Adipogenesis in thyroid eye disease. Invest Ophthalmol Vis Sci. 2000; 41(11):3249–55.
27. Starkey KJ, Janezic A, Jones G, Jordan N, Baker G, Ludgate M. Adipose thyrotrophin receptor expression is elevated in Graves' and thyroid eye diseases ex vivo and indicates adipogenesis in progress in vivo. J Mol Endocrinol. 2003; 30(3):369–80.

28. Arora S. Anubhuti. Role of neuropeptides in appetite regulation and obesity–a review. Neuropeptides. 2006; 40(6):375401.
29. Valcavi R, Zini M, Peino R, Casanueva FF, Dieguez C. Influence of thyroid status on serum immunoreactive leptin levels. J Clin Endocrinol Metab. 1997; 82(5):16324.

30. Kapadia KB, Bhatt PA, Shah JS. Association between altered thyroid state and insulin resistance. J Pharmacol Pharmacother. 2012; 3(2):156–60.
Go to : 
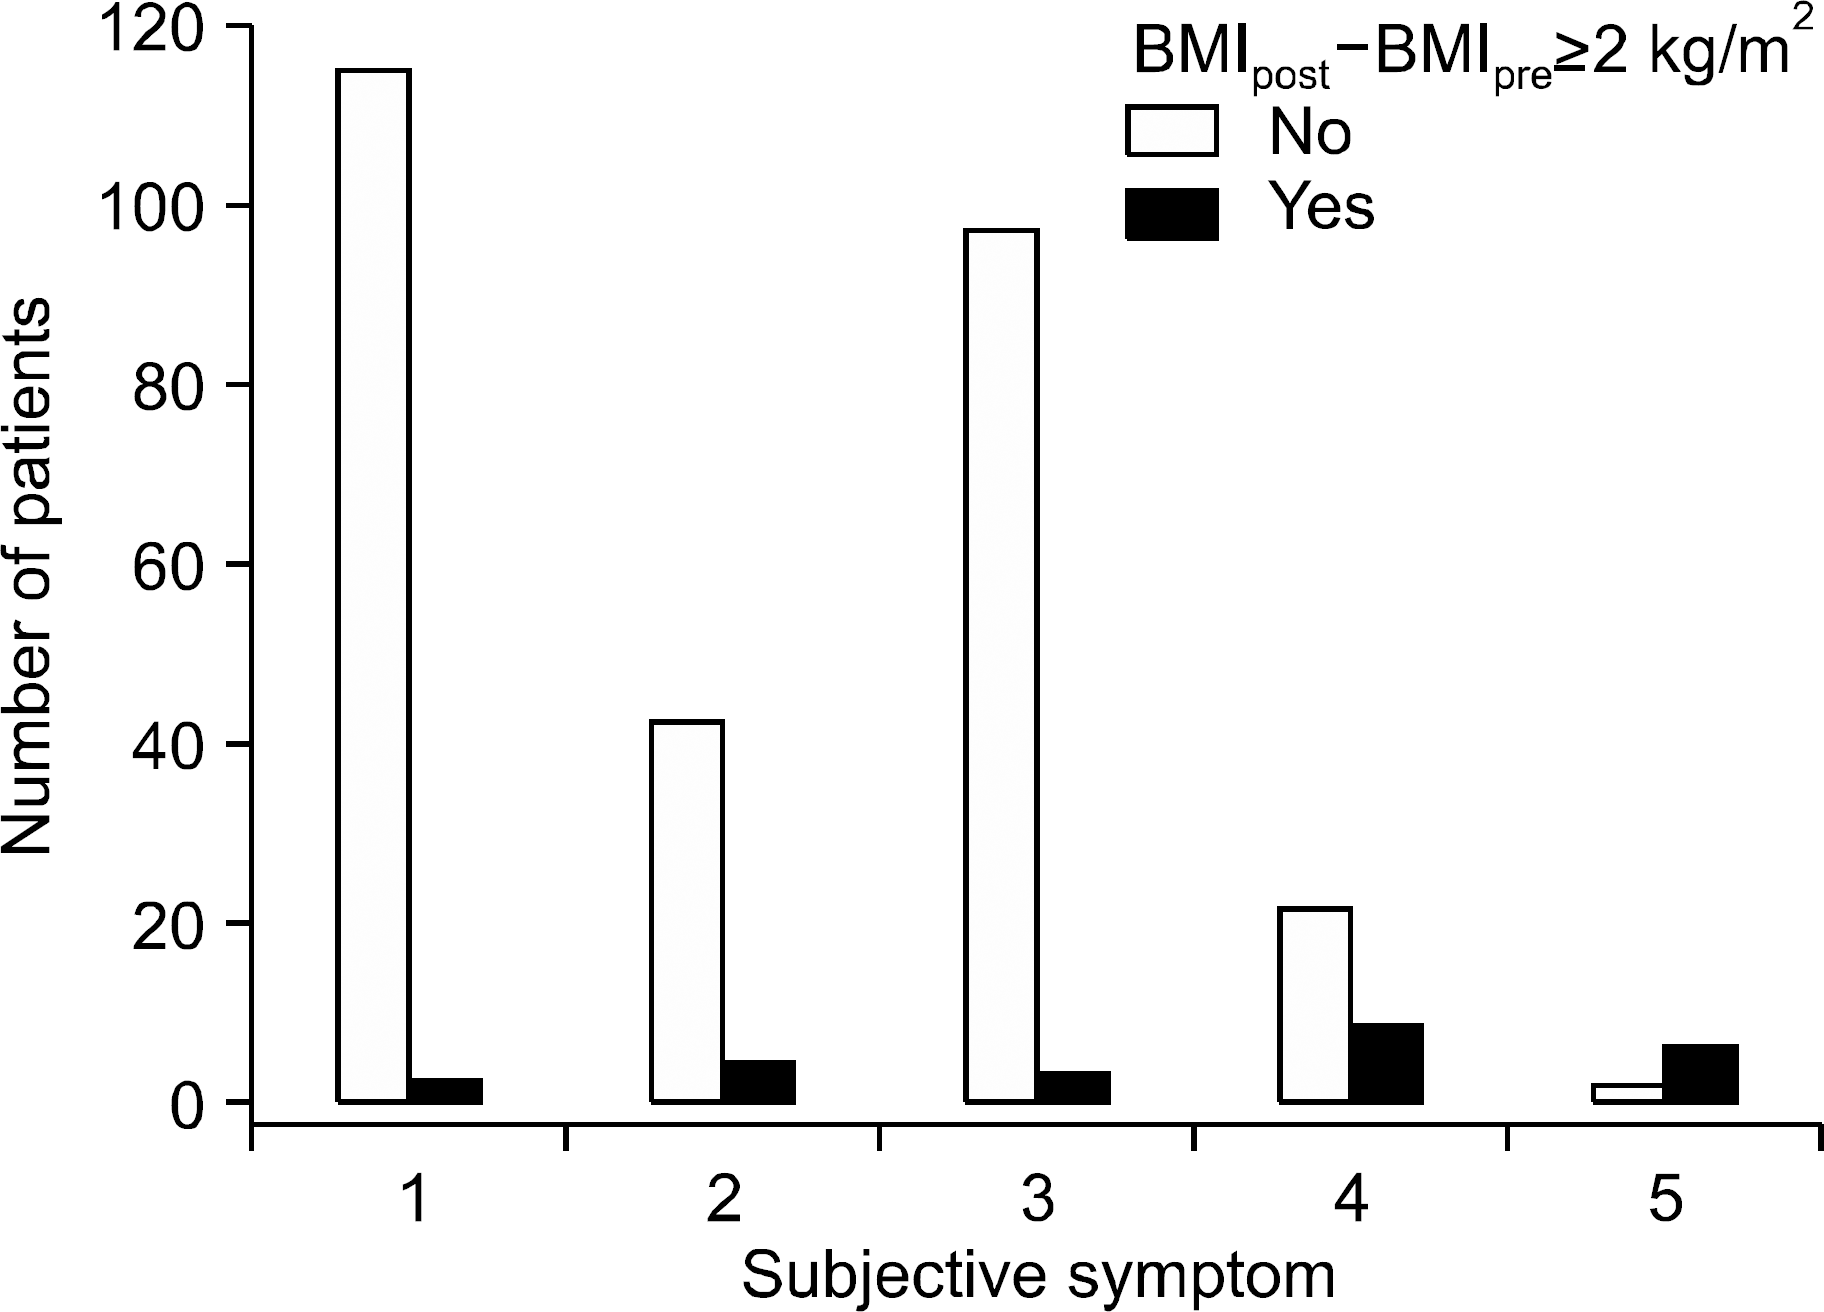
 | Fig. 1.Number of patients with and without sustained weight gain according to subjective symptom scores. Subjective discomfort scores were categorized using a visual analog scale: 1, none; 2, mild; 3, moderate; 4, severe; and 5, extreme discomfort. The numbers of patients with and without sustained weight gain for each score were: 115 vs. 2 (1.7%) in score 1, 42 vs. 4 (8.7%) in score 2, 97 vs. 3 (3%) in score 3, 22 vs. 8 (26.7%) in score 4, and 2 vs. 6 (75%) in score 5. |
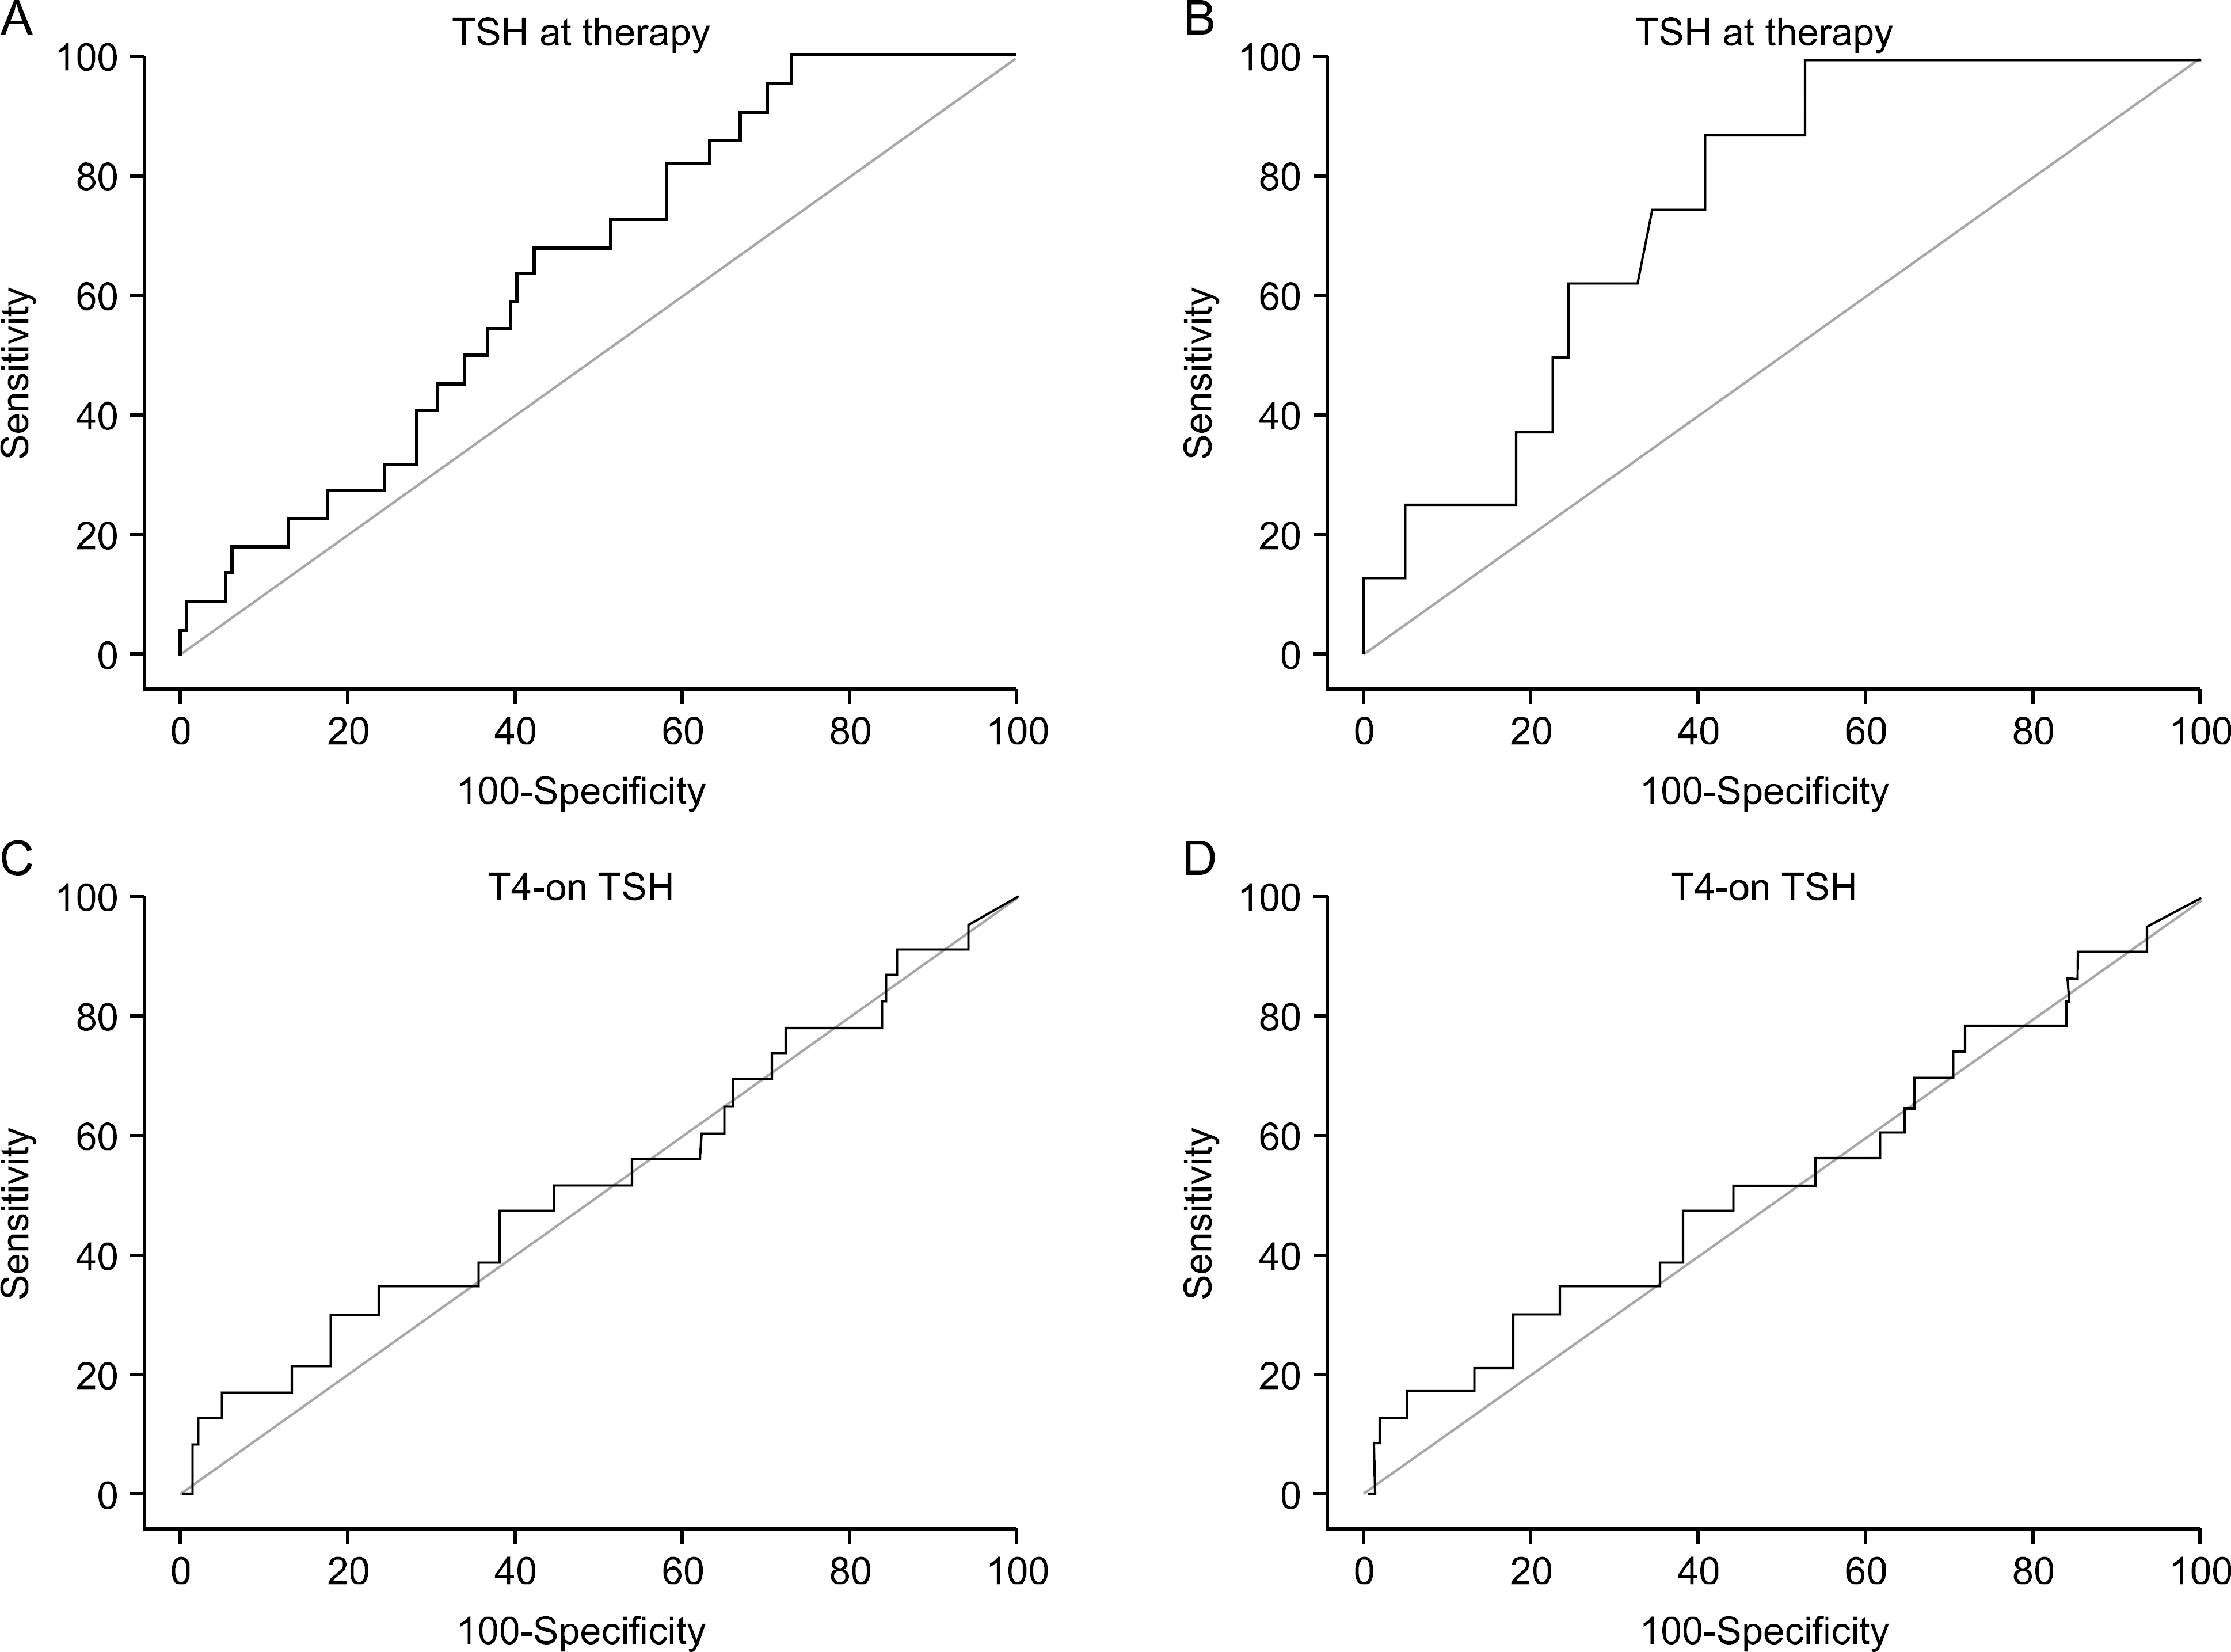
 | Fig. 2.ROC curves for the evaluation TSH cutoff values. (A) The TSH at therapy cutoff value overall was 87.35 μ IU/mL (sensitivity 100 and specificity 27.17). (B) The TSH at therapy cutoff value in group 1 was 100 μIU/mL (sensitivity 100 and specificity 47.54). (C) The T4-on TSH cutoff value overall was 1.73 μIU/mL (sensitivity 30.43 and specificity 82.37). (D) The T4-on TSH cutoff value in group 1 was >0.90 μ IU/mL (sensitivity 100 and specificity 27.17). |
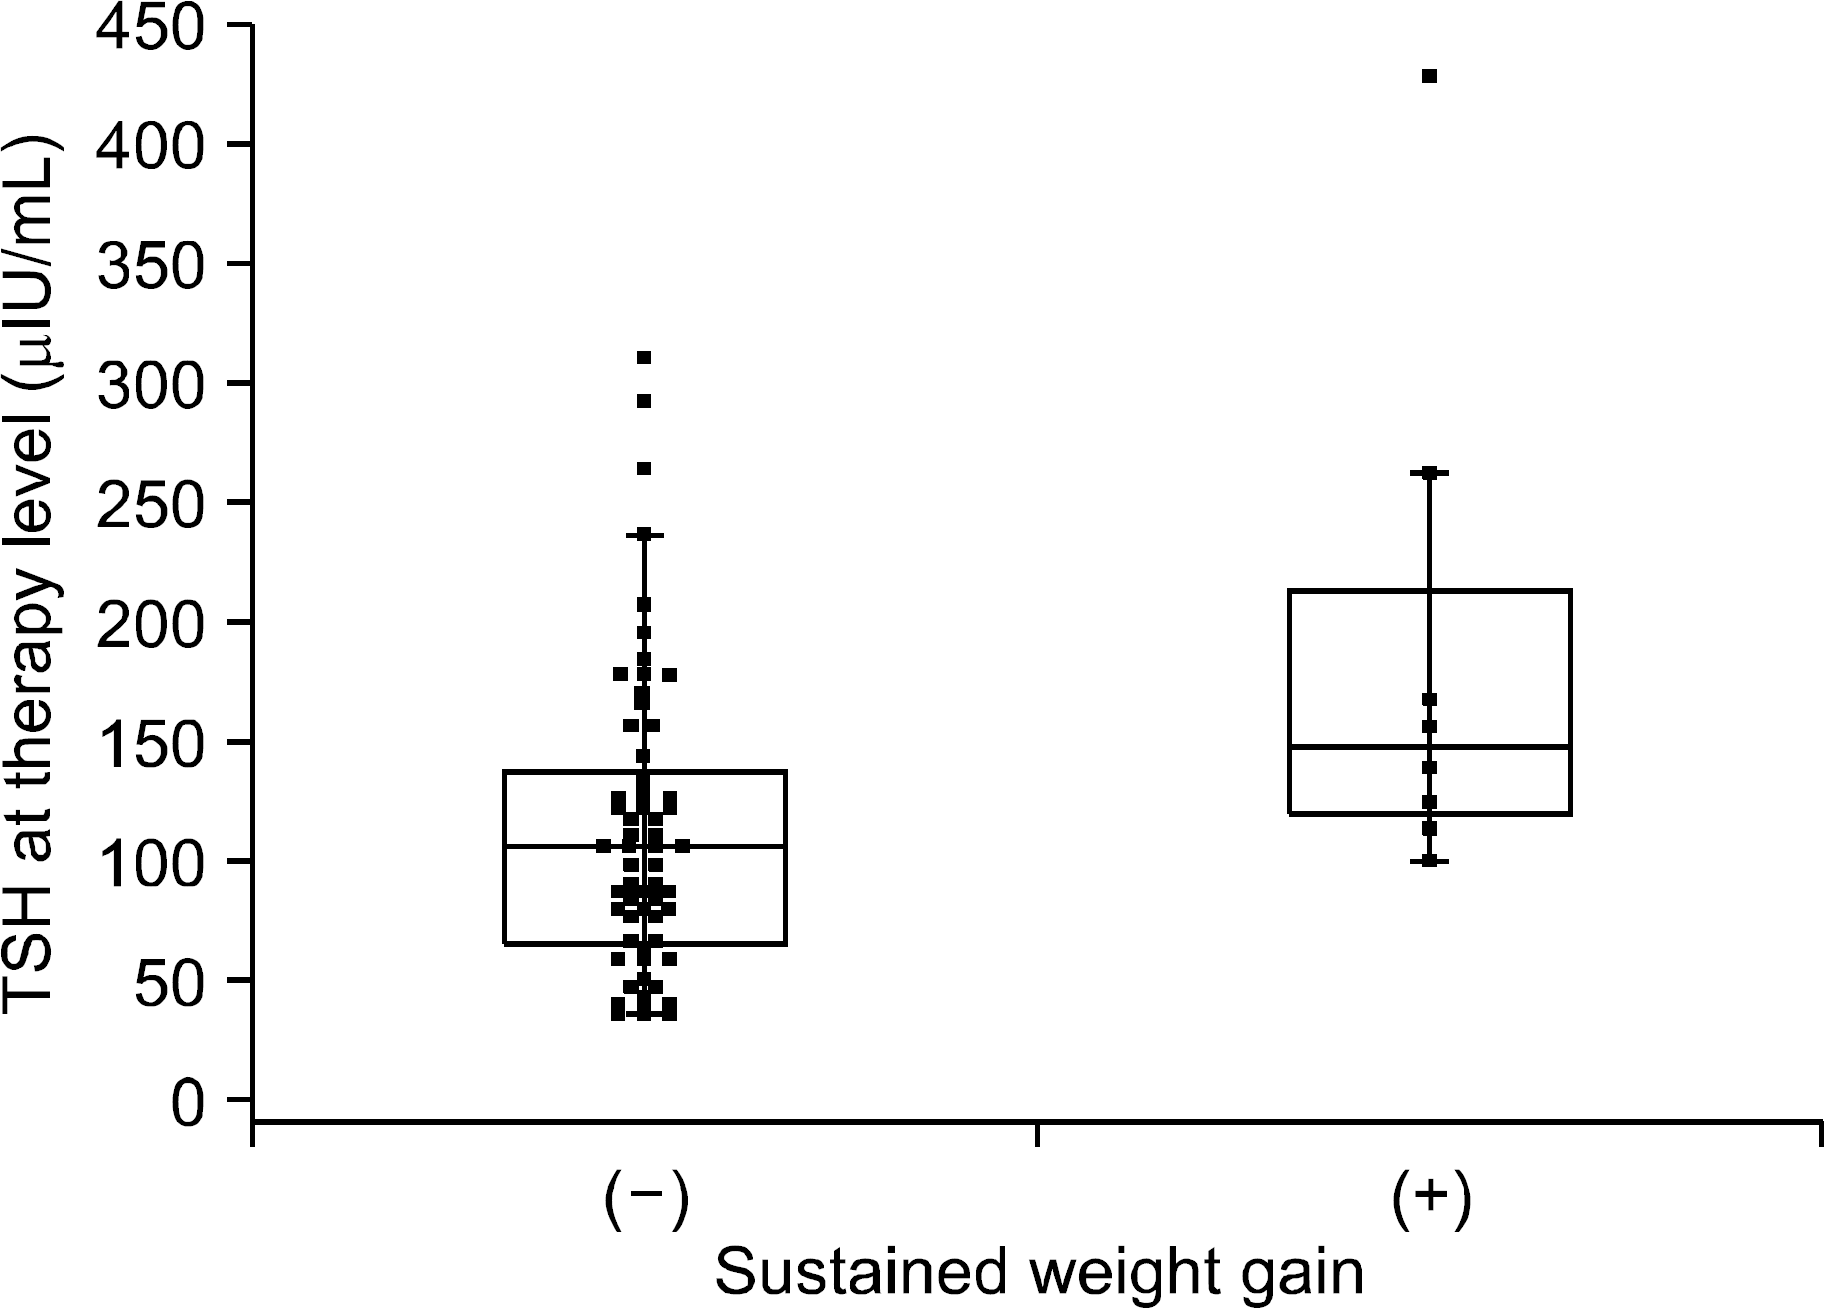
 | Fig. 3.TSH at therapy levels differed significantly between patients in group 1 with (185.8±109.9 μ IU/mL) and without sustained weight gain (112.9±62.4 μIU/mL) (p=0.015). The central box in the plot represents the TSH at therapy values from the lower to upper quartiles (25 to 75 percentiles). The middle line represents the median of stimulated TSH. The horizontal line extends from the minimum to the maximum value, excluding outlier values, which are displayed as separate points. |
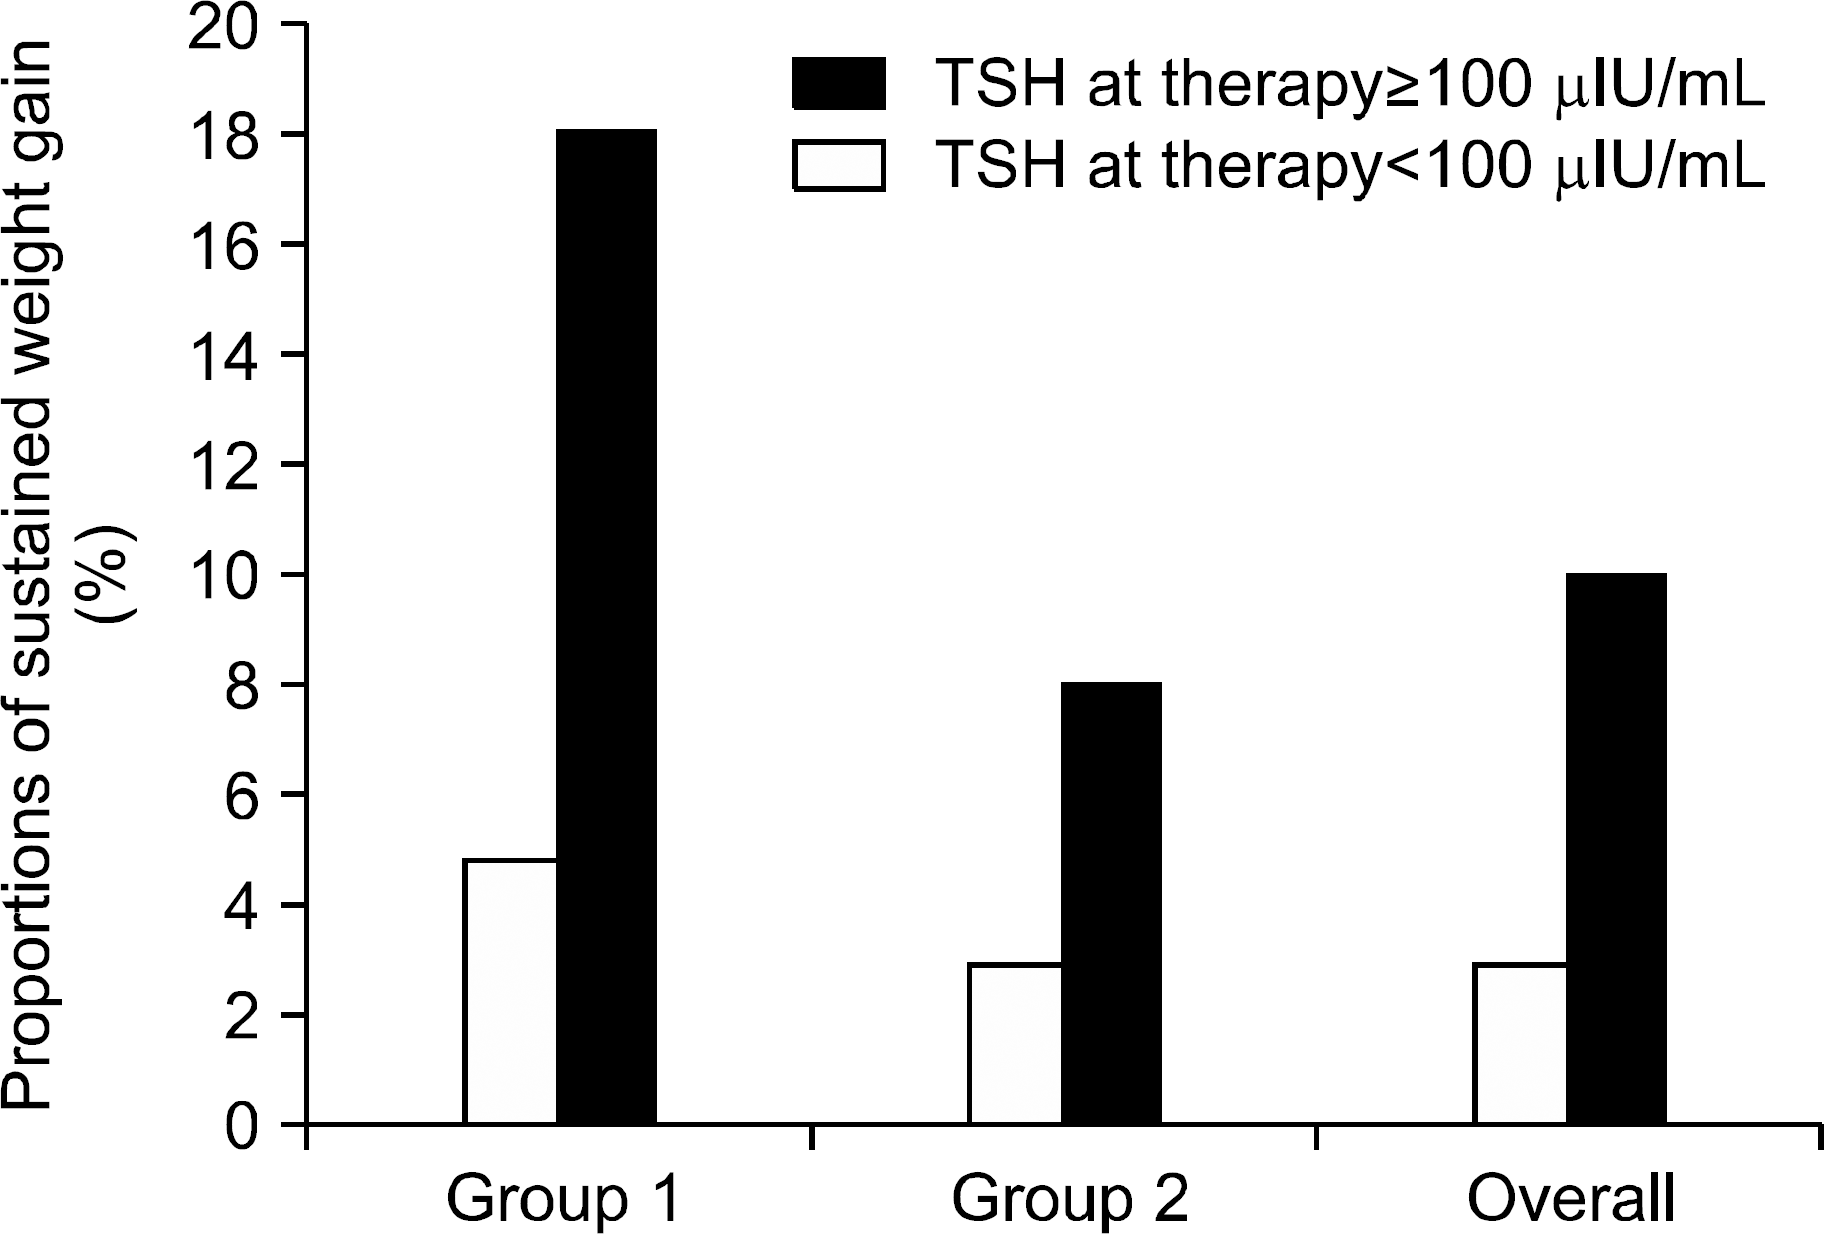
 | Fig. 4.Proportions of sustained weight gain (BMI post− BMI pre≥2 kg/m2) were higher in TSH at therapy levels ≥100 μ IU/mL in group 1, group 2, and overall. The values for the pro-portions of patients in groups 1 and 2 with sustained weight gain for TSH at therapy levels above and below 100 μ IU/mL were 5% and 18%, and 3% and 8%, respectively, and 3% and 10% overall. |
Table 1.
Patient clinical characteristics (n=301)
Table 2.
Patient characteristics related to weight gain
Table 3.
Subjective discomfort scores for sustained weight gain after TSH at therapy
| Subjective discomfort | Sustained weight gain | p | |
|---|---|---|---|
| (−) | (+) | ||
| No – moderate | 254 | 9 | <0.0001∗ |
| Severe and extreme | 24 | 14 | |
Table 4.
Comparisons of clinical factors according to the presence of sustained weight gain
Table 5.
Univariate analysis of risk factors associated with sustained weight gain
| Factors | Group 1 | p | Group 2 | p |
|---|---|---|---|---|
| Odds ratio (95% CI) | Odds ratio (95% CI) | |||
| TSH at therapy ≥100 μ IU/mL | 3.15 (1.05–9.53) | 0.041∗ | 2.20 (0.22–22.20) | 0.474 |
| T4-on TSH >0.9 μ IU/mL | 0.00 (0.00–0.00) | 0.986 | 0.87 (0.26–2.90) | 0.827 |
| Sex (male) | 2.58 (0.57–11.78) | 0.241 | 1.12 (0.11–11.34) | 0.926 |
| Age (50–59 years) | 1.02 (0.24–4.43) | 0.979 | 0.47 (0.06–3.55) | 0.471 |
| Recurrent or metastatic thyroid cancer | 0.00 (0.00–0.00) | 0.329 | 0.00 (0.00–0.00) | 0.544 |
| Diabetes mellitus | 0.00 (0.00–0.00) | 0.231 | 0.00 (0.00–0.00) | 0.356 |
| Hypertension | 2.58 (0.57–11.78) | 0.241 | 1.05 (0.10–10.62) | 0.967 |
| Hypercholesterolemia | 5.67 (1.12–28.57) | 0.049∗ | 0.00 (0.00–0.00) | 0.496 |
| Exercise | 2.21 (0.26–18.97) | 0.432 | 1.14 (0.11–11.53) | 0.910 |
| Calorie restriction | 0.39 (0.05–3.32) | 0.339 | 3.53 (0.47–26.72) | 0.234 |
| Basal BMI ≥25 kg/m2 | 2.90 (0.70–12.08) | 0.154 | 2.78 (0.37–20.92) | 0.326 |
Table 6.
Multivariate analysis of risk factors associated with sustained weight gain in group 1
| Factors | Odds ratio (95% CI) | p |
|---|---|---|
| TSH at therapy ≥100 μ IU/mL | 3.22 (1.06–9.79) | 0.039∗ |
| Hypercholesterolemia | 1.77 (0.46–6.79) | 0.404 |
| Basal BMI ≥25 kg/m2 | 1.61 (0.64–4.06) | 0.317 |
Table 7.
Comparisons of clinical factors according to the presence of sustained weight gain in 283 patients with well-controlled T4-on TSH levels
| Characteristics | Sustained weight gain | p | |
|---|---|---|---|
| (−) | (+) | ||
| Overall | |||
| Basal BMI ≥25 kg/m2 | 65 | 5 | 0.869 |
| TSH at therapy (μ IU/mL) | 136.5 (95% CI 127.3–145.6) | 185.8 (95% CI 136.0–235.5) | 0.015§ |
| T4-on TSH (μ IU/mL) | 0.740 (95% CI 0.628–0.851) | 0.605 (95% CI 0.240–0.967) | 0.332 |
| Group 1 | |||
| Basal BMI ≥25 kg/m2 | 15 | 3 | 0.188 |
| TSH at therapy (μ IU/mL) | 113.8 (95% CI 97.3–130.2) | 188.5 (95% CI 78.9–298.1) | 0.010§ |
| T4-on TSH (μ IU/mL) | 0.578 (95% CI 0.391–0.765) | 0.093 (95% CI −0.003–0.189) | <0.001§ |
Table 8.
Univariate and multivariate analysis of risk factors associated with sustained weight gain in 78 patients in group 1 with well-controlled T4-on TSH level
| Factors | Odds ratio (95% CI) | p |
|---|---|---|
| Univariate | ||
| TSH at therapy >100 μ IU/mL | 7.50 (0.86–65.52) | 0.069 |
| T4-on TSH <0.303 μ IU/mL | 0.00 (NA) | 0.997 |
| Hypertension | 3.75 (0.74–18.95) | 0.110 |
| Hypercholesterolemia | 8.25 (1.49–45.82) | 0.016∗ |
| Basal BMI ≥25 kg/m2 | 2.85 (0.57–14.14) | 0.200 |
| Multivariate | ||
| TSH at therapy ≥100 IU/mL | 16.33 (1.21–220.26) | 0.035∗ |
| Hypercholesterolemia | 2.48 (0.26–23.23) | 0.426 |
| Hypertension | 5.27 (0.54–51.42) | 0.153 |
| Basal BMI ≥25 kg/m2 | 6.14 (0.76–49.64) | 0.089 |


 PDF
PDF ePub
ePub Citation
 Print
Print


 XML Download