Abstract
Background and Objectives
Iodine is essential for thyroid hormone production and the iodine intake of Koreans is high. Few studies have examined the association between iodine intake and thyroid disease in the Korean population due to the lack of an iodine database. Therefore, this study established an iodine database, evaluated iodine intake levels, and explored the association between iodine intake and thyroid disease.
Materials and Methods
We obtained data for 9998 subjects who had both biochemical and dietary data from the 2007–2009 Korea National Health and Nutrition Examination Survey.
Results
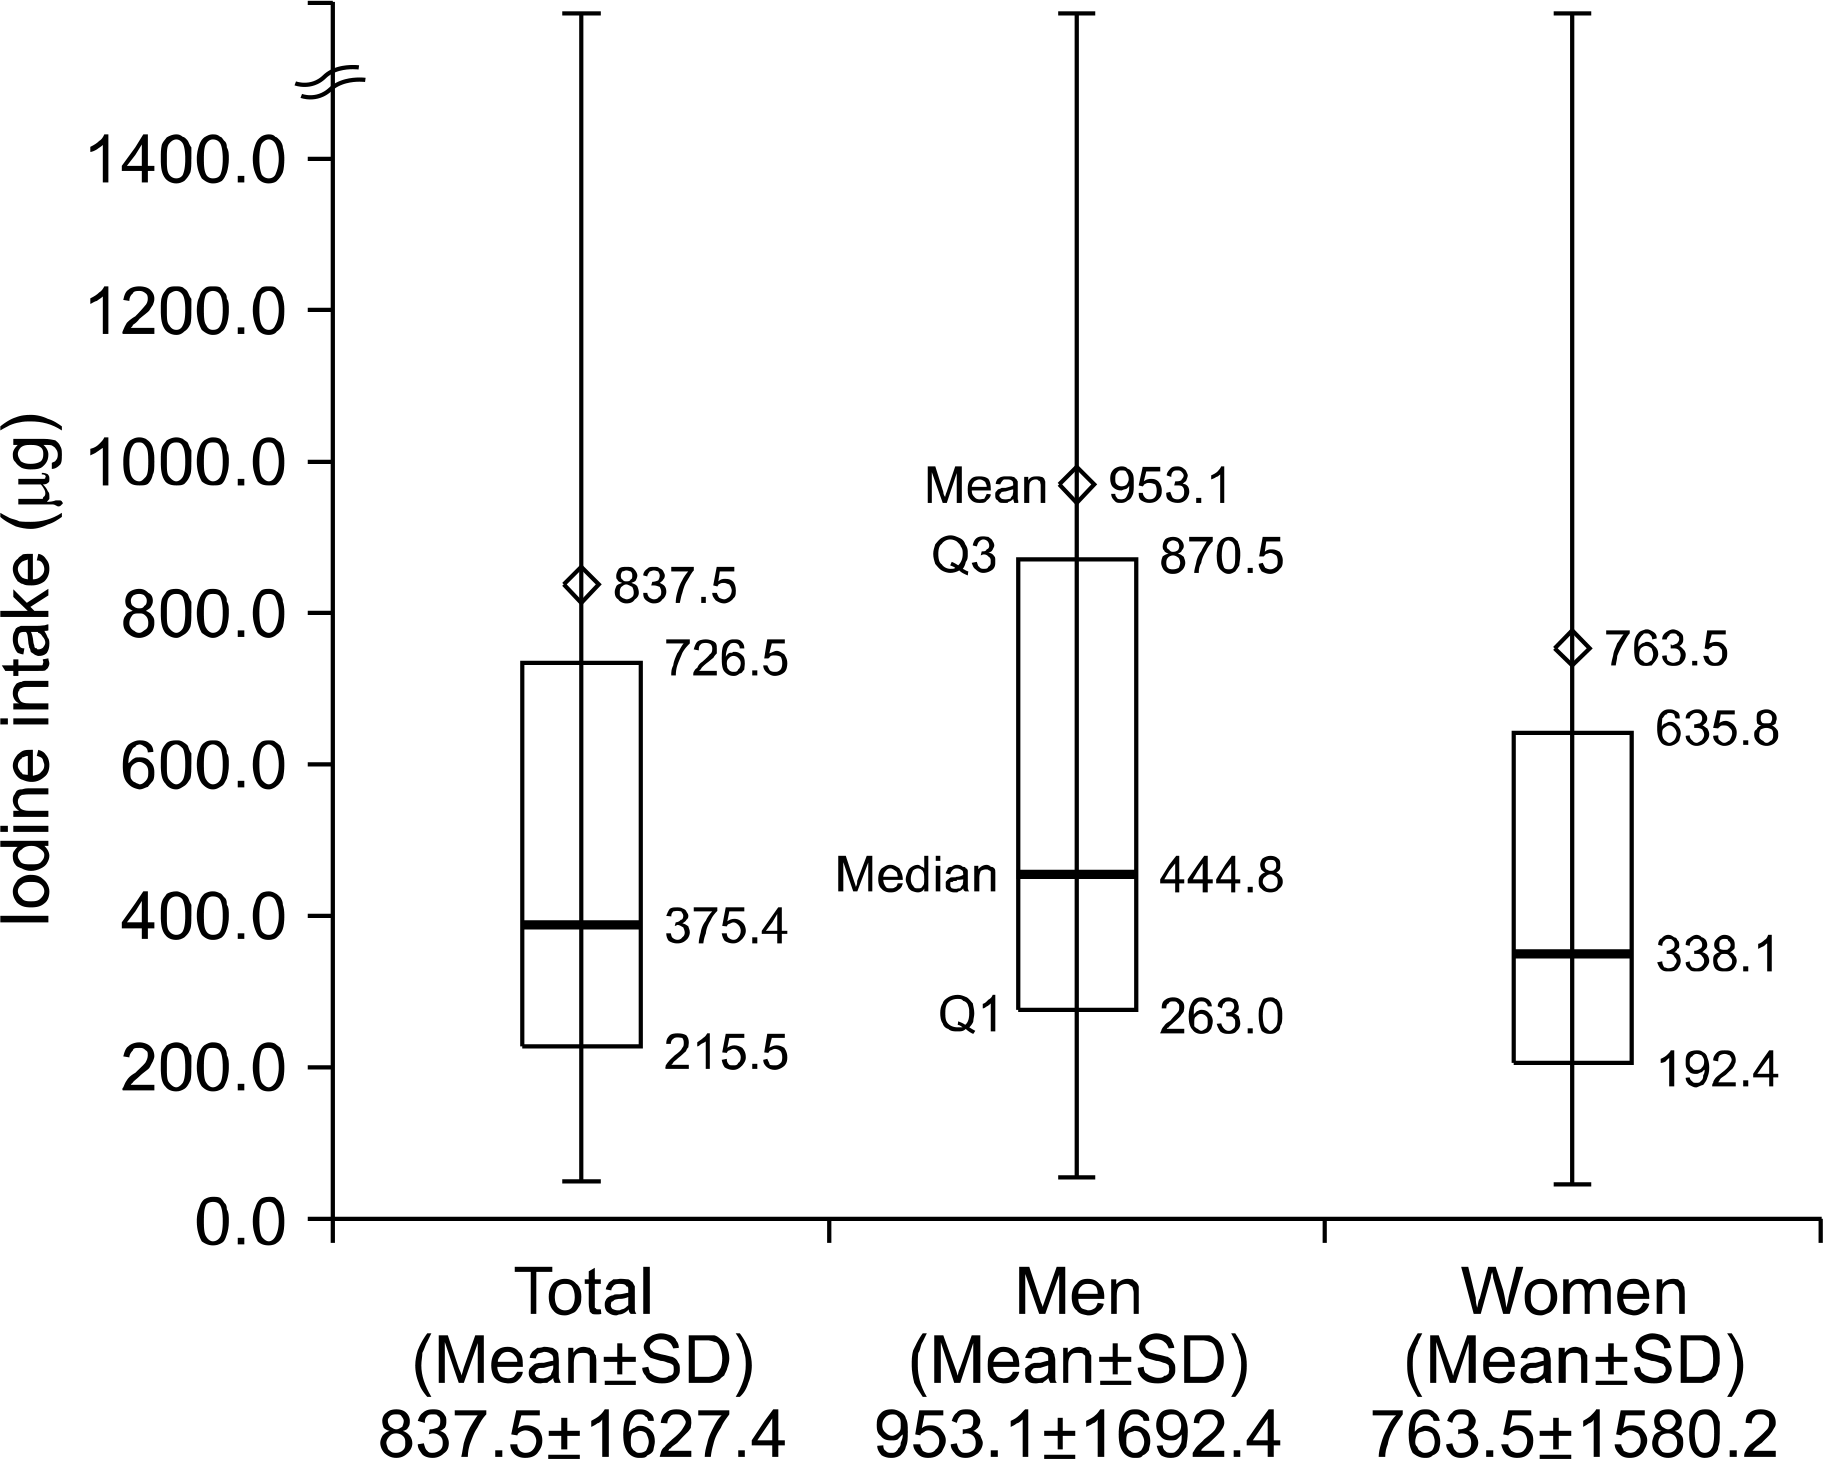
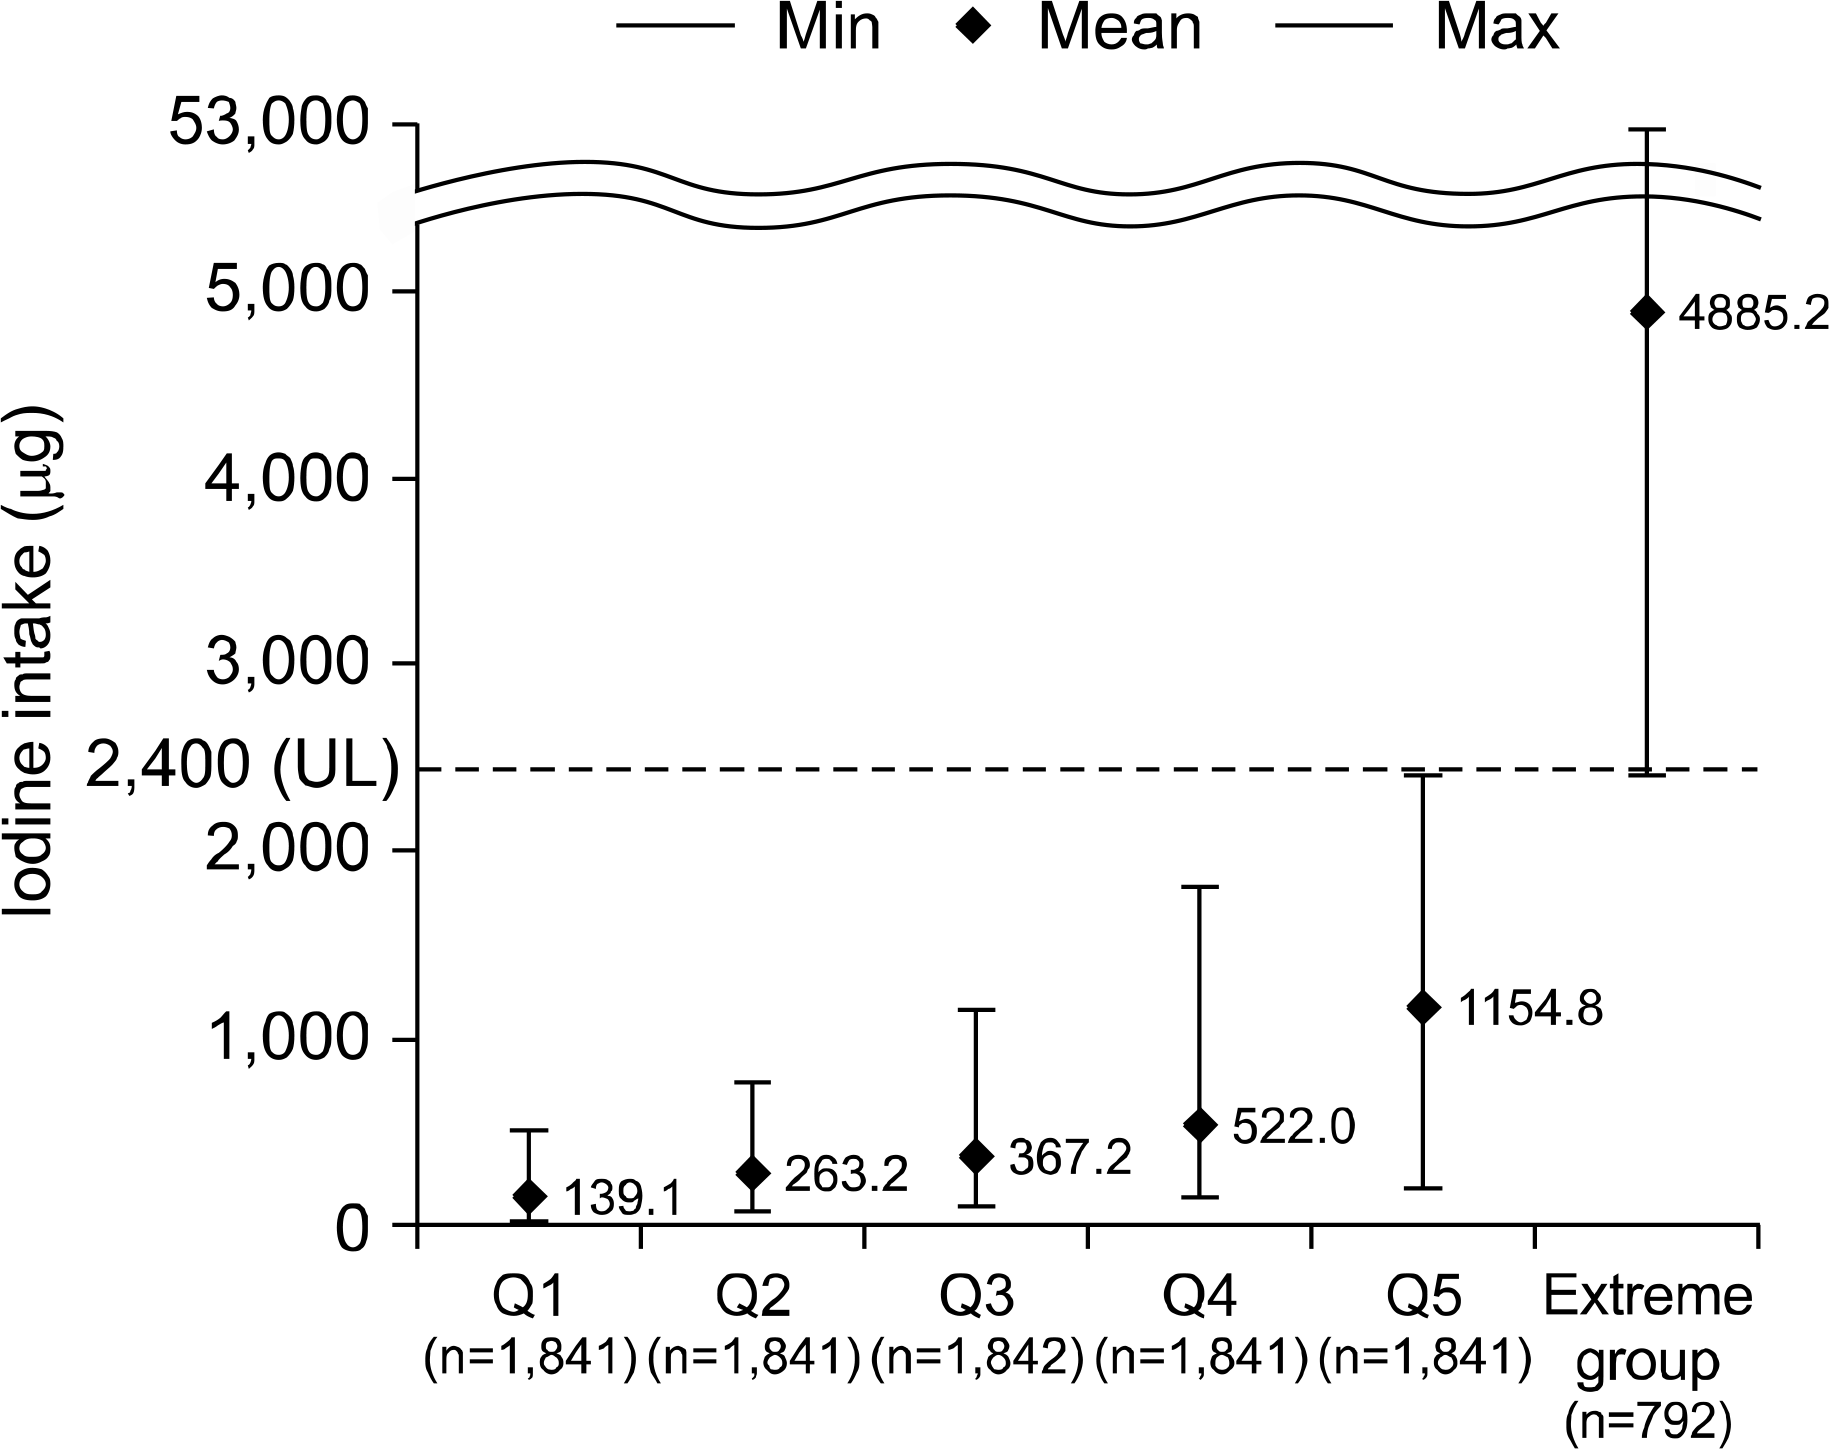
An iodine database was established for 667 food items. The median iodine intake in the population was 375.4 μ g per day. The iodine contribution by food group was 65.6% from seaweed, 18.0% from salted vegetables, and 4.8% from fish. When subjects were divided into five groups across quintiles of iodine intake per 1000 kcal, excluding extreme subjects who consumed above the upper limit, age, sex, income, education, drinking, and smoking differed across the groups. While the energy and fat intakes decreased, other nutrients increased across the quintile groups. The consumption of seaweeds, fish, eggs, and salted vegetables increased across the quintile groups. After adjusting for all potential confounding variables, the odds ratio for thyroid disease in the highest quintile was 1.63 compared to that in the lowest quintile (p for trend=0.0352).
References
1. Kim JH, Park SJ, Kim SE, Lee KH, Cho IK, Jang SI, et al. Prevalence of thyroid nodules detected by ultrasonography in adult men attending health check-ups. J Korean Endocr Soc. 2007; 22(2):112–7.

2. Suk JH, Kim TY, Kim MK, Kim WB, Kim HK, Jeon SH, et al. Prevalence of ultrasonographically-detected thyroid nodules in adults without previous history of thyroid disease. J Korean Endocr Soc. 2006; 21(5):389–93.

3. Yim CH, Oh HJ, Chung HY, Han KO, Jang HC, Yoon HK, et al. Prevalence of thyroid nodules detected by ultrasonography in womens attending health check-ups. J Korean Soc Endocrinol. 2002; 17(2):183–8.
4. Kim SY, Hyun MK. A evidencebased study on the effectiveness of thyroid cancer screening test. National Evidence-based Healthcare Collaborating Agency (NECA). Seoul, Korea;. 2012.
5. Choi HS, Park YJ, Kim HK, Choi SH, Lim S, Park DJ, et al. Prevalence of subclinical hypothyroidism in two population based-cohort: Ansung and KLoSHA cohort in Korea. J Korean Thyroid Assoc. 2010; 3(1):32–40.
6. Jung KW, Won YJ, Kong HJ, Oh CM, Cho H, Lee DH, et al. Cancer statistics in Korea: incidence, mortality, survival, and prevalence in 2012. Cancer Res Treat. 2015; 47(2):127–41.

7. Laurberg P, Cerqueira C, Ovesen L, Rasmussen LB, Perrild H, Andersen S, et al. Iodine intake as a determinant of thyroid disorders in populations. Best Pract Res Clin Endocrinol Metab. 2010; 24(1):13–27.

8. Lee HS, Min H. Iodine intake and tolerable upper intake level of iodine for Koreans. Korean J Nutr. 2011; 44(1):82–91.

9. Teng W, Shan Z, Teng X, Guan H, Li Y, Teng D, et al. Effect of iodine intake on thyroid diseases in China. N Engl J Med. 2006; 354(26):2783–93.

10. Vejbjerg P, Knudsen N, Perrild H, Laurberg P, Carle A, Pedersen IB, et al. Lower prevalence of mild hyperthyroidism related to a higher iodine intake in the population: prospective study of a mandatory iodization programme. Clin Endocrinol (Oxf). 2009; 71(3):440–5.

11. Konno N, Makita H, Yuri K, Iizuka N, Kawasaki K. Association between dietary iodine intake and prevalence of subclinical hypothyroidism in the coastal regions of Japan. J Clin Endocrinol Metab. 1994; 78(2):393–7.

12. Kim JY, Moon SJ, Kim KR, Sohn CY, Oh JJ. Dietary iodine intake and urinary iodine excretion in normal Korean adults. Yonsei Med J. 1998; 39(4):355–62.

13. Kim JY, Kim KR. Dietary iodine intake and urinary iodine excretion in patients with thyroid diseases. Yonsei Med J. 2000; 41(1):22–8.

14. Imaeda N, Kuriki K, Fujiwara N, Goto C, Tokudome Y, Tokudome S. Usual dietary intakes of selected trace elements (Zn, Cu, Mn, I, Se, Cr, and Mo) and biotin revealed by a survey of four-season 7-consecutive day weighed dietary records in middle-aged Japanese dietitians. J Nutr Sci Vitaminol (Tokyo). 2013; 59(4):281–8.

15. Kang TS. Monitoring of iodine in foods for estimation of dietary intake. Naterional Institute of Food and Drug Safety Evaluation;2012.
16. Lee JY. Iodine analysis method establishment and content monitoring of food. Global Health Care. Korea National Institute of Food and Drug Safety;2006.
17. Kim BH. Development of nutrient database – 3. Mineral composition of foods −. Korea Health Industry Development Institute;2003.
18. Moon SJ, Kim JY, Chung YJ, Chung YS. The iodine content in common Korean foods. Korean J Nutr. 1998; 31(2):206–12.
19. National Rural Living Science Institute. Food composition table. Rural Development Administration;2006.
20. Chang NS, Cho YW, Kim WJ. Iodin intake and excretion of the patients with thyroid disease. Korean J Nutr. 1994; 27(10):1037–47.
21. The Korean Nutrition Society. Food values. The Korean Nutrition Society;2009.
22. Kim EH, Choi TI, Park YK. Dietary iodine intake and the association with subclinical thyroid dysfunction in male workers. Korean J Nutr. 2012; 45(3):218–28.

23. Ristic-Medic D, Dullemeijer C, Tepsic J, Petrovic-Oggiano G, Popovic T, Arsic A, et al. Systematic review using metaanalyses to estimate dose-response relationships between iodine intake and biomarkers of iodine status in different population groups. Nutr Rev. 2014; 72(3):143–61.

24. Luo Y, Kawashima A, Ishido Y, Yoshihara A, Oda K, Hiroi N, et al. Iodine excess as an environmental risk factor for autoimmune thyroid disease. Int J Mol Sci. 2014; 15(7):12895–912.

25. Michikawa T, Inoue M, Shimazu T, Sawada N, Iwasaki M, Sasazuki S, et al. Seaweed consumption and the risk of thyroid cancer in women: the Japan Public Health Center-based Prospective Study. Eur J Cancer Prev. 2012; 21(3):254–60.
26. Matsubayashi S, Mukuta T, Watanabe H, Fuchigami H, Taniguchi J, Chinen M, et al. Iodine-induced hypothyroidism as a result of excessive intake of confectionery made with tangle weed, Kombu, used as a low calorie food during a bulimic period in a patient with anorexia nervosa. Eat Weight Disord. 1998; 3(1):50–2.

27. Cho NH, Choi HS, Kim KW, Kim HL, Lee SY, Choi SH, et al. Interaction between cigarette smoking and iodine intake and their impact on thyroid function. Clin Endocrinol (Oxf). 2010; 73(2):264–70.
Fig. 1.
The distribution of iodine intake in the Korean adults population aged 20 or more using the data from 2007–2009 Korea National Health and Nutrition Examination Survey. Box: Q3-Q1 (Interquartile range), Q1: 25 th percentile, Q3: 75 th percentile,

Fig. 2.
The average and range of iodine intake across quintile and extreme group. †Quintile group was classified based on the iodine intake per 1000 kcal.

Table 1.
Composition of the table of iodine values for common Korean foods
Table 2.
The contribution of iodine intake according to food groups in total population
Table 3.
Socio-demographic characteristics of study subjects
Table 4.
Nutrient intake of study subjects
Table 5.
Food group intakes across quintile of iodine intake including extreme group
Table 6.
The odds ratio for thyroid disease across the quintile of iodine intakes
| Quintile of iodine intake (per 1,000 kcal) | Extreme group | P for trend2) | p for trend3) | |||||
|---|---|---|---|---|---|---|---|---|
| Q1 | Q2 | Q3 | Q4 | Q5 | ||||
| Age, sex-adjusted | 1.00 |
1.19 (0.76–1.86) |
1.50 (0.97–2.31) |
1.37 (0.89–2.11) |
1.84 (1.17–2.88) |
1.31 (0.72–2.40) |
0.0066 | 0.0202 |
| Multivariate1) | 1.00 |
1.10 (0.70–1.72) |
1.40 (0.91–2.16) |
1.27 (0.82–1.96) |
1.63 (1.03–2.59) |
1.20 (0.65–2.21) |
0.0352 | 0.0735 |


 PDF
PDF ePub
ePub Citation
 Print
Print


 XML Download