Abstract
Background and Objectives
Materials and Methods
Results
References
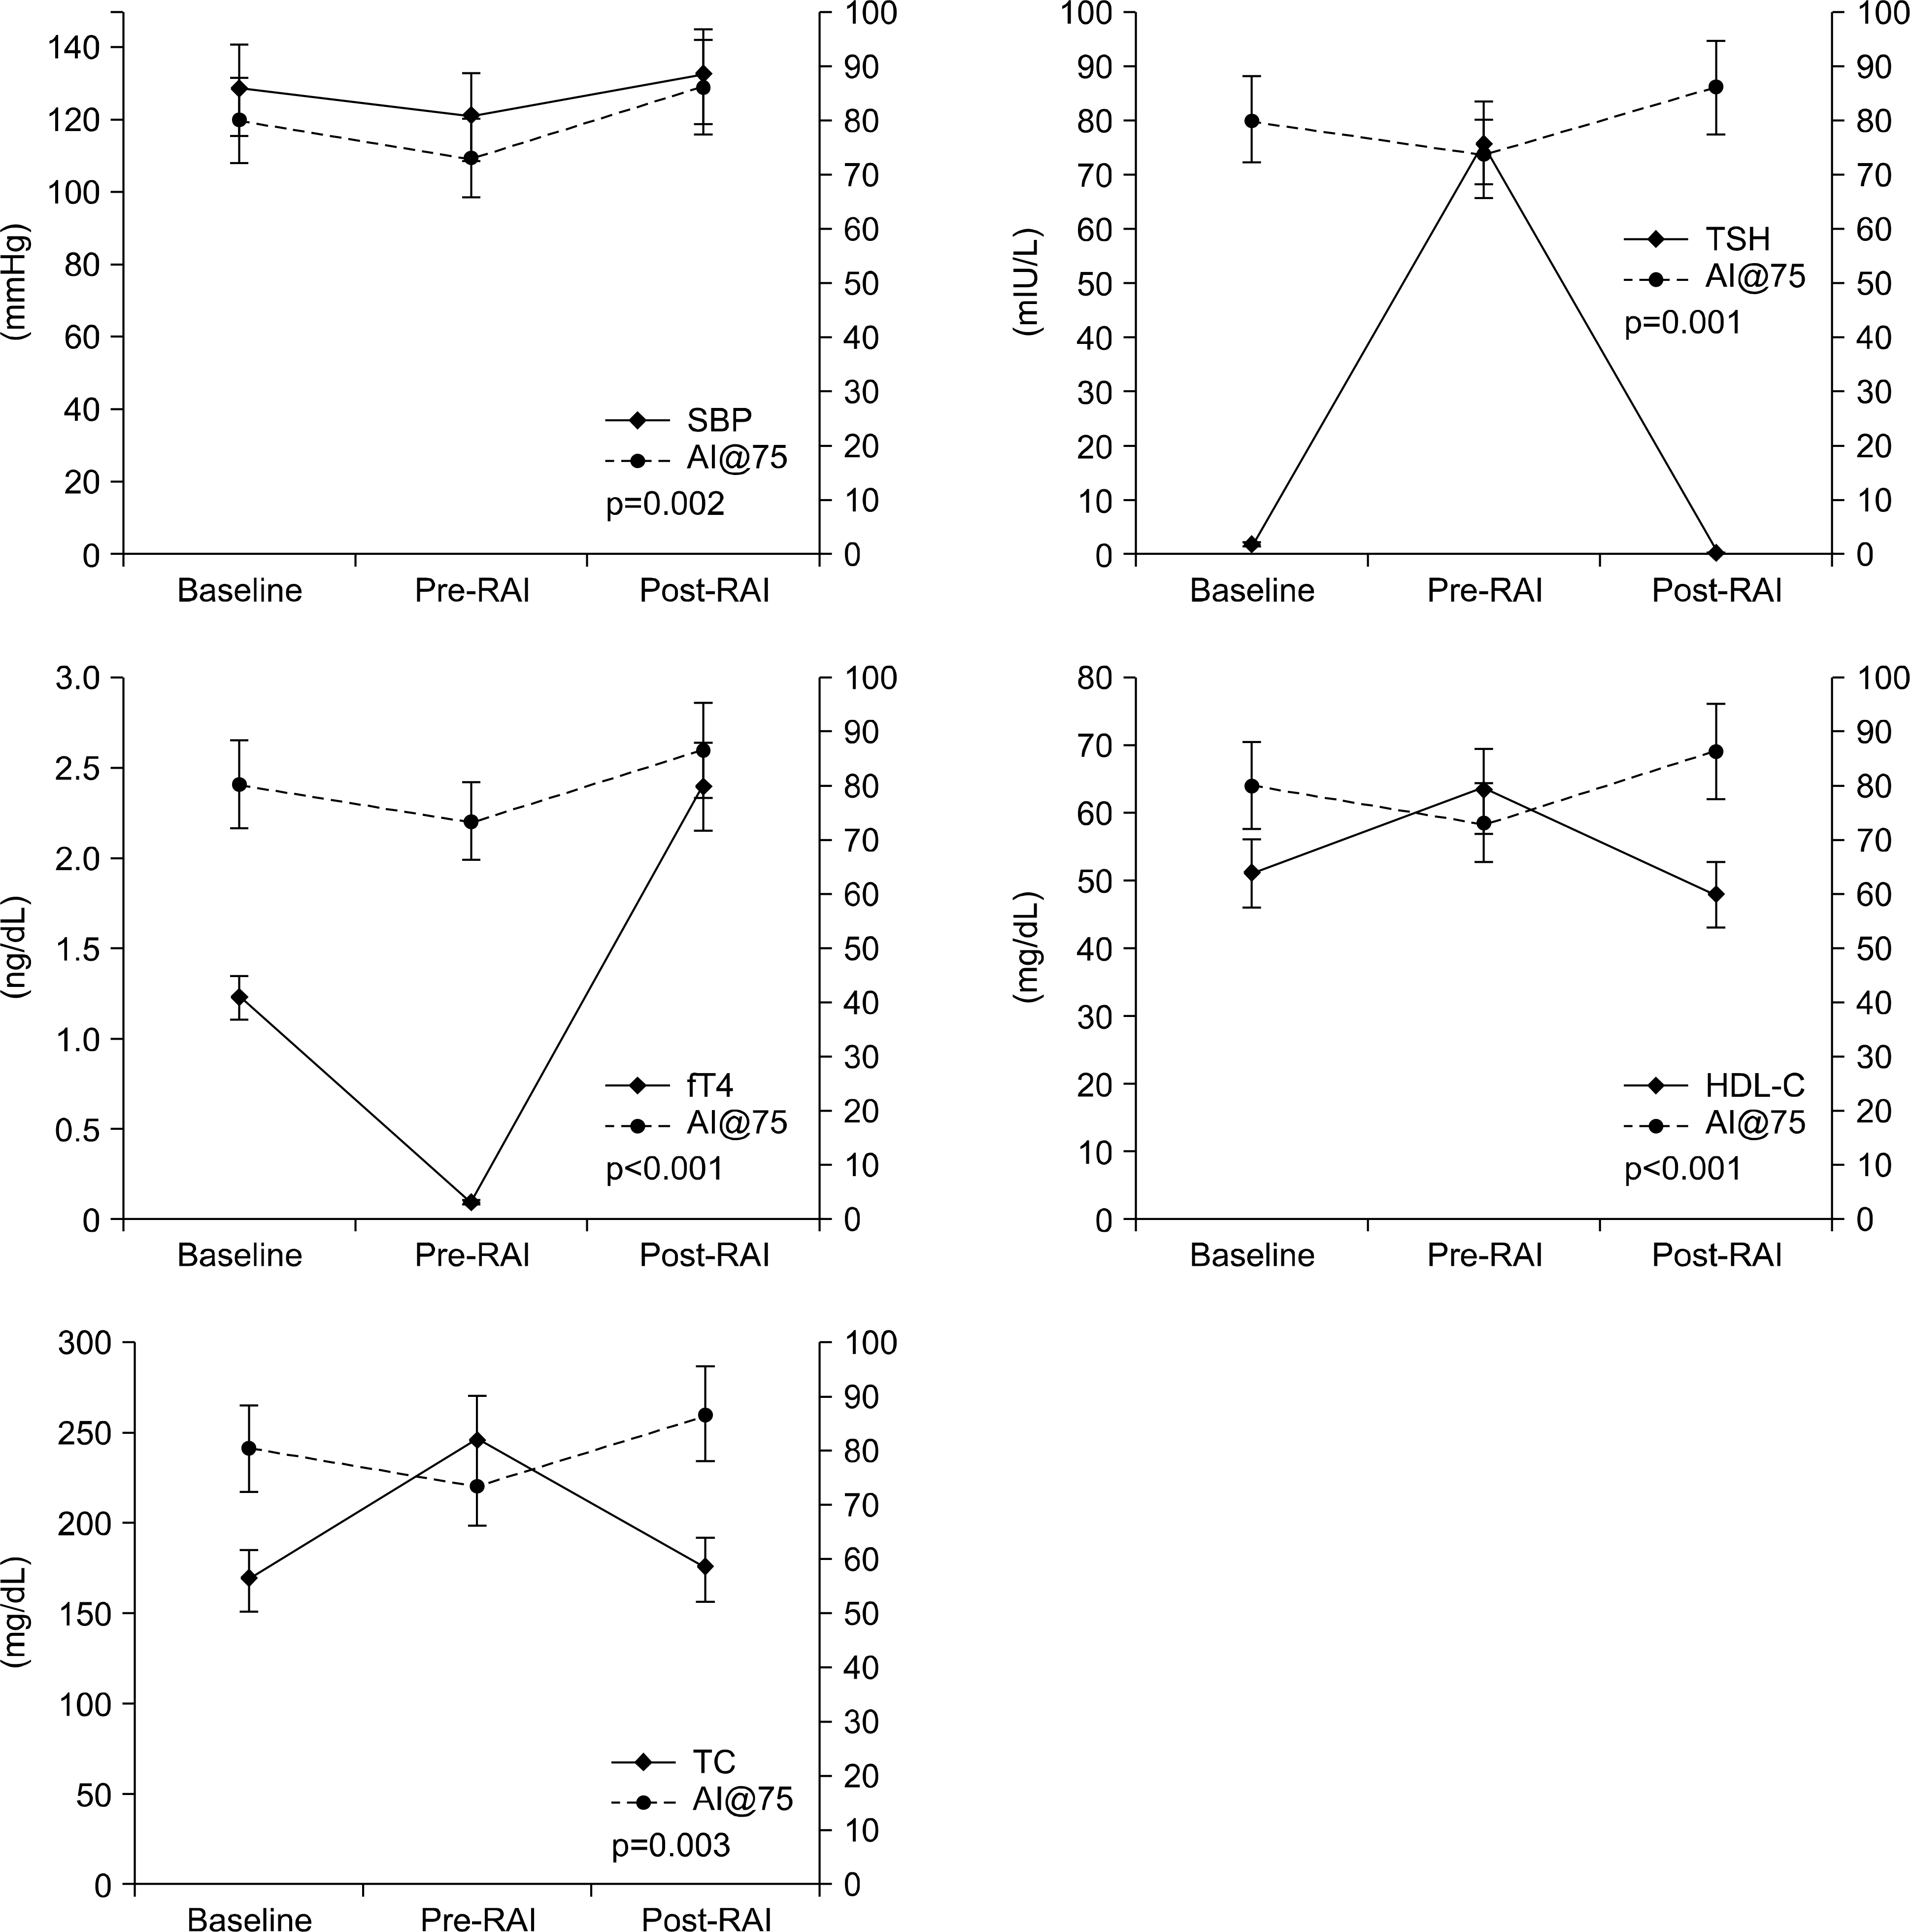
 | Fig. 1.The changes in AI@75 levels and correlated factors at each visit. Baseline was the euthyroid state, pre-RAI was the hypothyroid state and post-RAI was the mild thyrotoxic state. Statistical significance was evaluated using univariate analysis with the generalized estimating equation. AI@75: correction of augmentation index for heart rate, fT4: free thyroxine, HDL-C: high-density lipoprotein cholesterol, RAI: radioactive iodine therapy, SBP: systolic blood pres-sure, TC: total cholesterol, TSH: thyroid stimulating hor-mone. |
Table 1.
| Variables | Visit 1 | Visit 2 | Visit 3 | ∗p value | † p value | ‡ p value |
|---|---|---|---|---|---|---|
| TSH (mIU/L) | 2.1±0.9 | 76.1±23.0 | 0.5±0.9 | <0.001 | 0.002 | <0.001 |
| T3 (ng/dL) | 108.0±17.4 | 21.5±3.8 | 147.3±42.0 | <0.001 | 0.006 | 0.001 |
| fT4 (ng/dL) | 1.2±0.2 | 0.1±0.1 | 2.4±0.9 | <0.001 | <0.001 | <0.001 |
| SBP (mmHg) | 128.7±16.8 | 121.4±17.7 | 132.5±18.5 | 0.097 | 0.286 | 0.297 |
| DBP (mmHg) | 78.9±11.7 | 77.6±10.7 | 78.2±12.7 | 0.736 | 0.831 | 0.811 |
| HR (bpm) | 72.7±10.3 | 69.8±10.3 | 82.1±11.3 | 0.155 | 0.001 | <0.001 |
| CBP (mmHg) | 134.2±20.4 | 125.7±19.9 | 137.1±19.8 | 0.109 | 0.722 | 0.517 |
| AI (%) | 81.2±13.3 | 75.5±12.3 | 83.4±12.4 | 0.070 | 0.622 | 0.054 |
| AI@75 (%) | 80.2±11.4 | 73.2±10.1 | 86.4±11.2 | 0.039 | 0.019 | 0.021 |
| BaPWV, Rt (m/s) | 13.8±2.9 | 13.6±2.5 | 13.7±2.4 | 0.722 | 0.906 | 0.692 |
| BaPWV, Lt (m/s) | 13.9±2.7 | 13.8±2.4 | 13.8±2.2 | 0.981 | 0.687 | 0.607 |
| TC (mg/dL) | 167.4±23.8 | 244.6±44.5 | 174.2±46.3 | 0.001 | 0.865 | 0.322 |
| HDL-C (mg/dL) | 51.2±13.6 | 63.2±15.2 | 48.0±11.7 | 0.004 | 0.878 | 0.685 |
| LDL-C (mg/dL) | 110.1±28.5 | 154.5±41.2 | 112.0±46.4 | 0.019 | 0.239 | 0.784 |
| TG (mg/dL) | 106.9±69.7 | 194.1±139.6 | 151.8±110.9 | 0.002 | 0.239 | 0.135 |
| Glu (mg/dL) | 112.2±32.7 | 107.3±36.4 | 106.6±19.0 | 0.451 | 0.593 | 0.499 |
| Hb (mg/dL) | 13.0±1.1 | 13.4±1.3 | 12.6±1.2 | 0.038 | 0.180 | 0.195 |
| Cr (mg/dL) | 0.73±0.1 | 0.69±0.1 | 0.68±0.1 | 0.348 | 0.093 | 0.041 |
| CRP (mg/dL) | 0.44±0.3 | 0.51±0.6 | 0.68±0.6 | 0.959 | 0.125 | 0.120 |
Values are means±standard deviation. Statistical significance was evaluated using generalized estimating equation analysis Visit 1 reflects baseline euthyroid state. Visit 2 reflects pre-RAI hypothyroid state. Visit 3 reflects post-RAI thyrotoxic state
AI: augmentation index, AI@75: corrected augmentation index for heart rate, BaPWV: brachial-ankle pulse wave velocity, CBP: central systolic blood pressure, Cr: creatinin, CRP: C-reactive protein, DBP: diastolic blood pressure, fT4: free thyroxine, Glu: glucose, Hb: hemoglobin, HDL-C: high density lipoprotein cholesterol, HR: heart rate, LDL-C: low density lipoprotein cholesterol, Lt: left, RAI: radioactive iodine, Rt: right, SBP: systolic blood pressure, T3: triiodothyronine, TC: total cholesterol, TG: triglyceride, TSH: thyroid stimulating hormone
Table 2.
| Changes in variables | Δ AI@75 | Δ TSH | Δ fT4 | |||
|---|---|---|---|---|---|---|
| 1 st phase | 2 nd phase | 1 st phase | 2 nd phase | 1 st phase | 2 nd phase | |
| Δ TSH | 0.119 | 0.442∗ | – | – | – | – |
| Δ fT4 | 0.040 | −0.092 | – | – | – | – |
| Δ T3 | −0.228 | −0.119 | – | – | – | – |
| Δ Heart rate | −0.570∗ | −0.056 | 0.021 | −0.148 | 0.102 | −0.242 |
| Δ SBP | 0.502∗ | 0.234 | 0.591∗ | 0.529∗ | −0.099 | −0.898∗ |
| Δ DBP | 0.437 | 0.219 | 0.580∗ | 0.511∗ | 0.218 | −0.115 |
| Δ CBP | 0.740∗ | 0.489∗ | 0.528∗ | 0.634∗ | 0.183 | −0.049 |
| Δ TC | −0.062 | −0.079 | 0.291 | 0.396 | 0.376 | −0.293 |
| Δ LDL-C | −0.042 | −0.049 | 0.209 | 0.236 | −0.230 | −0.422 |
| Δ HDL-C | −0.371 | −0.232 | 0.537∗ | 0.234 | 0.302 | −0.071 |
| Δ TG | 0.449 | 0.209 | −0182 | 0.022 | 0.064 | 0.193 |
| Δ Glucose | −0.100 | −0.240 | 0.118 | −0.343 | 0.118 | −0.547∗ |
| Δ Creatinin | −0.242 | −0.026 | −0.254 | −0.163 | 0.280 | −0.402 |
| Δ CRP | −0.027 | 0.163 | 0.147 | 0.299 | −0.173 | −0.047 |
All values are correlation coefficients (r) of correlation analysis. Univariate analysis was performed using Spearmanʼ s or Pearsonʼ s correlation analysis. The changes in variables were obtained by subtracting the pre-radioactive iodine (RAI) therapy values from the baseline values (1 st phase) and the post-RAI therapy values from the pre-RAI values (2 nd phase)
AI: augmentation index, AI@75: corrected augmentation index for heart rate, CBP: central systolic blood pressure, CRP: C-reactive protein, DBP: diastolic blood pressure, fT4: free thyroxine, HDL-C: high density lipoprotein cholesterol, LDL-C: Low density lipoprotein cholesterol, PWV: pulse wave velocity, SBP: systolic blood pressure, T3: triiodothyronine, TC: total cholesterol, TG: triglyceride, TSH: thyroid stimulating hormone


 PDF
PDF ePub
ePub Citation
 Print
Print


 XML Download