Abstract
Acknowledgements
References
Supplementary Material
Supplementary Figure 1
Figure 1
Schematic diagram of study flow. FTS, fluticasone propionate; SM, salmeterol; TTP, tiotropium.
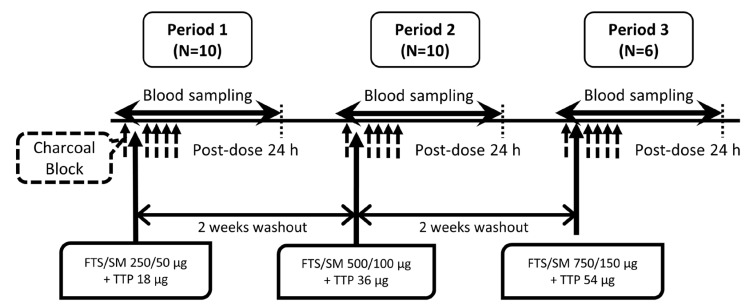
Figure 2
Mean plasma concentration-time profiles of FTS (A, B), SM (C, D) and TTP (E, F) after concomitant inhalation (A, C, and E in linear scale; and B, D, and F in log-linear scale). The closed circles represent FTS/SM 250/50 µg + TTP 18 µg (n=10), the open circles represent FTS/SM 500/100 µg + TTP 36 µg (n=10), and the closed triangles represent FTS/SM 750/150 µg + TTP 54 µg (n=6). The dotted lines represent lower limit of quantification. FTS, fluticasone; SM, salmeterol; TTP, tiotropium.
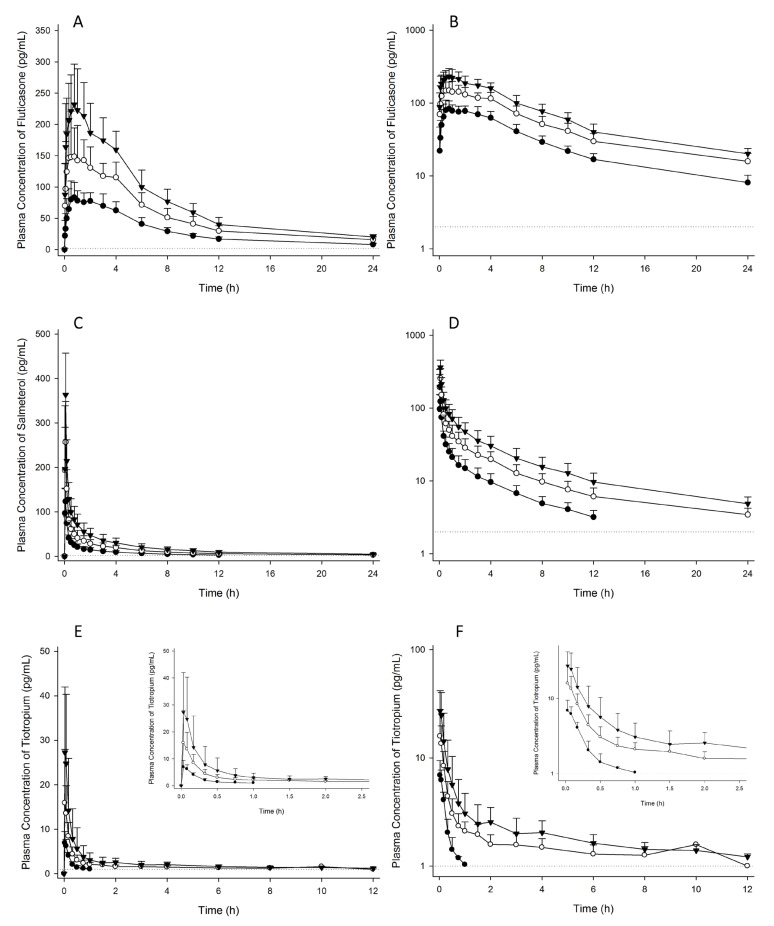
Figure 3
Scatterplot of dose-proportionality assessment for fluticasone (FTS), salmeterol (SM), and tiotropium (TTP). The circles represent pharmacokinetic parameters of each subject. The solid line denotes the predicted line from the power model. The dotted line indicates 95% confidence intervals for the predicted line. Cmax, maximum plasma concentration; AUClast, area under the plasma concentration-time curve from time zero to the last observed time point; AUCinf, AUC from time zero to infinity; AUC0-30min, AUC from time zero to 30 minute.
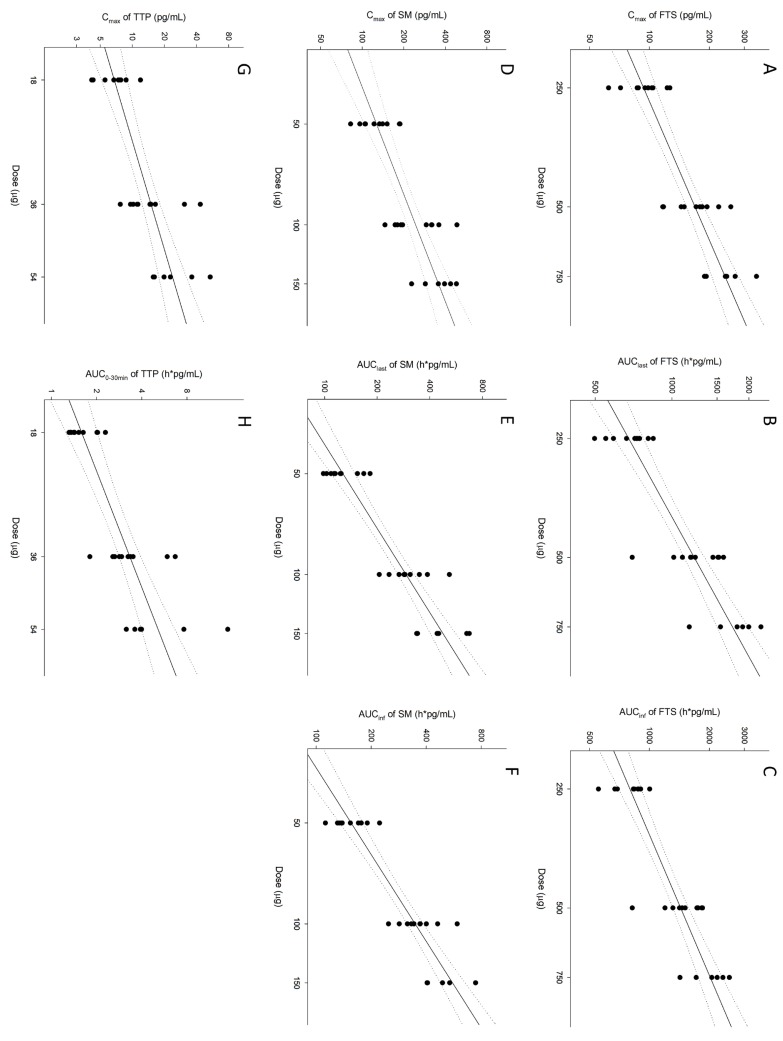
Table 1
Summary of pharmacokinetic parameters for fluticasone (FTS), salmeterol (SM), and tiotropium (TTP) after concomitant inhalation
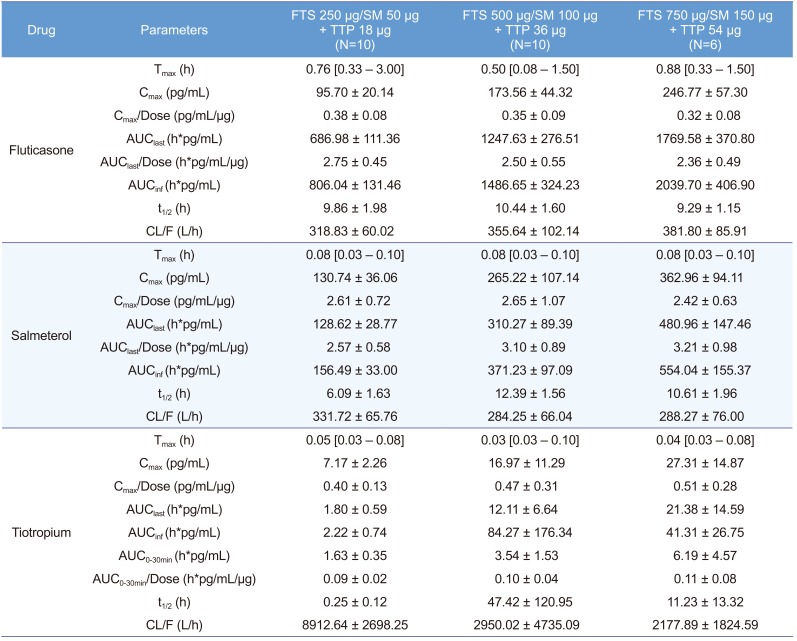
Pharmacokinetic parameters are represented as mean±SD except for Tmax, which is represented as median [minimum-maximum]. Tmax, time to achieve Cmax; Cmax, maximum plasma concentration; Cmax/Dose, dose normalized Cmax; AUClast, area under the plasma concentration-time curve from time zero to the last observed time point; AUClast/Dose, dose normalized AUClast; AUCinf, AUC from time zero to infinity; t1/2, elimination half-life; CL/F, apparent clearance; AUC0-30min, AUC from time zero to 30 minute; AUC0-30min/Dose, dose normalized AUC0-30min.
Table 2
Assessment of dose-proportionality for pharmacokinetics of fluticasone, salmeterol, and tiotropium using power model regression
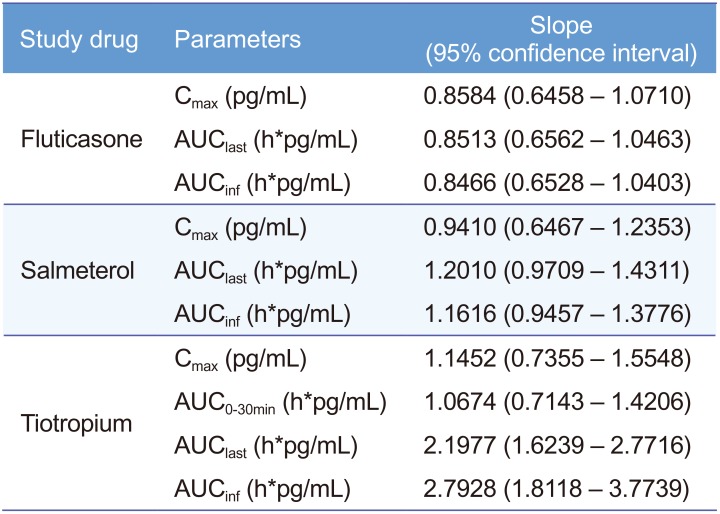
Power model: ln(Y) = (Intercept) + (Slope) × ln(Dose), Y: pharmacokinetic parameter. Cmax, maximum plasma concentration; AUClast, area under the plasma concentration-time curve from time zero to the last observed time point; AUCinf, AUC from time zero to infinity; AUC0-30min, AUC from time zero to 30 minute.


 PDF
PDF ePub
ePub Citation
 Print
Print


 XML Download