

 PDF
PDF ePub
ePub Citation
 Print
Print


Introduction
Metabolomics is becoming a novel ‘omics’ approach to performing the quantitative and comprehensive analysis of diverse small molecules present in biological samples such as cells, tissues, and organisms.[1] There have been several attempts to apply metabolomics to the fields of medicine, toxicology, and pharmacology.[2] The pharmacometabolomic approach enables us to understand the effects of drugs on metabolomic mechanisms and may predict drug responses by profiling endogenous metabolites.[3]
Diabetes mellitus (DM) is a worldwide prevalent metabolic disease that leads to serious health problems globally.[4] Patients with DM experience hyperglycemia, resulting from defective insulin action and production, which in turn cause disturbances in metabolism. Type 2 diabetes mellitus (T2DM), also known as noninsulin-dependent DM, comprises approximately 90% of diabetes cases. T2DM is characterized by insulin resistance and a relative insulin deficiency caused by imperfections of insulin secretion.[5]
Sulfonylureas (SUs) are antihyperglycemic agents used to treat patients with T2DM. These drugs bind to the SU receptors containing adenosine triphosphate (ATP)-sensitive potassium (KATP) channels and then close the channels. This action induces depolarization of the cell, thereby promoting insulin release from the pancreatic β cells. Despite the beneficial effects on diabetes, SUs are known to have unfavorable cardiac effects.[6] These drugs block the opening of KATP channels on the myocardial cells and provoke cardiovascular complications by abrogating endogenous cardioprotective mechanisms.[7]
Glimepiride is a third generation SU that is widely used in the treatment of T2DM.[8] This drug is known to have fewer cardiac actions than other SUs, including glibenclamide, indicating that glimepiride represents lower incidence of cardiovascular complications than that of other SUs.[9] In addition, a previous study demonstrated that glimepiride also has a lower incidence of hypoglycemia than other SUs such as glibenclamide.[10] For these reasons, glimepiride is widely prescribed to decrease blood glucose level.[11]
Quantitative analysis of glimepiride, using liquid chromatography, has been reported in previous studies. Lehr and Damm analyzed, for the first time, glimepiride and its metabolite in human serum and urine by high-performance liquid chromatography (HPLC).[12] Subsequently, several research groups developed the liquid chromatography-tandem mass spectrometry (LC-MS/MS) method for quantitative determination of glimepiride in human plasma.[1314] Recently, the effect of SUs on biochemical changes in patients with T2DM was investigated through the metabolomic approach.[15] However, the effects of glimepiride on endogenous metabolomic alterations in healthy subjects remain poorly understood.
In the present study, we performed a pharmacometabolomic analysis to analyze the metabolomic profile of urine samples before and after glimepiride administration in healthy humans. The analysis was performed using the LC-MS/MS platform. This pharmacometabolomic approach might provide useful information on metabolomic alterations influenced by glimepiride administration.
Methods
Chemicals and Reagents
The organic solvents acetonitrile and methanol (LC grade) were purchased from Merck (Darmstadt, Germany). Formic acid was purchased from Junsei Chemical Co., Ltd. (Tokyo, Japan). Distilled water was produced through a Milli-Q system (Millipore, Billerica, MA, USA). The metabolite standard compounds, adenosine 3′, 5′-cyclic monophosphate (cAMP), quercetin, tyramine, and urocanic acid were purchased from Sigma-Aldrich (St. Louise, MO, USA).
Subjects
Twelve healthy Korean male volunteers who met all of the eligibility criteria were enrolled in the present study after submitting a written informed consent. Each volunteer was orally administered 2 mg glimepiride tablets (Handok Pharmaceuticals Co., Ltd, Seoul, Republic of Korea) with 240 mL of water. All volunteers were asked to fast overnight, and were subjected to a standardized diet, medication restrictions, exercise restrictions, and smoking prohibition during the hospitalization period. The urine samples obtained from the study subjects were collected within a 12-h interval prior to and following the administration of glimepiride over a 24-h period. The 12-h pre- and 12-h post-dose samples were prepared for a metabolomics analysis. Samples were stored at -70℃ until analysis. The study protocol was approved by the Kyungpook National University Hospital (Daegu, Republic of Korea) Institutional Review Board (CRIS No. KCT0001829). All of the subjects were hospitalized during this clinical trial at Kyungpook National University Hospital Clinical Trial Center.
Sample Preparation
Urine samples collected for metabolomic profiling were thawed slowly at room temperature. Quality control (QC) samples were pooled by mixing equal aliquots from each urine sample. All 100 µL urine samples and QC samples were deproteinized with 200 µL of acetonitrile. The protein precipitated samples were vortex mixed for 10 min and then incubated for 30 min at -20℃. The samples were centrifuged at 16,168 g for 10 min at 4℃. The supernatant (150 µL) was transferred safely to the vial.
LC-MS/MS Analysis
Five microliters of samples was directly injected into a Kinetex C18 column (150×2.1 mm, 2.6 µm; Phenomenex, Torrance, CA, USA) equipped with an Alliance 2695 HPLC (Waters Corp., Milford, MA, USA). The Security Guard ULTRA Cartridge (UHPLC C18 for 2.1 mm ID Columns; Phenomenex, Torrance, CA, USA) guard column was placed before the reverse phased column. The flow rate was 0.150 mL/min. The analysis was carried out using 0.1% formic acid in water (mobile phase A) and 0.1% formic acid in acetonitrile (mobile phase B) under the gradient condition. The elution gradient profile was as follows: 10% B for 3.0 min; 3.0–12.0 min to 80% B; 12.0–25.0 min to 90% B; 90% B for 25.0–29.0 min; 29.0–29.5 min to 10% B; 10% B for 29.5–35.0 min. The autosampler was kept cool at 5℃, and the column oven was maintained at 40℃. The LC system was coupled with the Finnigan LXQ ion trap mass spectrometer (Thermo Fisher Scientific, San Jose, CA, USA). Ion trap was performed using electrospray ionization (ESI) interface that operated in positive ion mode. The profiling was acquired from mass range 50.00 to 1000.00 mass to charge ratio (m/z) with the full scan mode. The MS instrument parameters were set as follows. The electrospray voltage was set at 5.0 kV, the spray current was set at 5 µA, the capillary temperature was set at 280℃, the capillary voltage was set at 38 V, the sheath gas flow rate was set at 10 arbitrary units, the tube lens voltage was set at 120 V, and the normalized collision energy was set at 35 eV.
Data Analysis
The raw chromatographic data were converted to the netCDF format with the use of Xcalibur (Thermo Fisher Scientific, San Jose, CA, USA). The XCMS package on the open source R (version 2.9.0, https://www.r-project.org) was employed to process the converted data via the peak detection, nonlinear retention time alignment.[16] Quantile normalization was also conducted by R for metabolomic data processing.[17] The preprocessed dataset was imported to SIMCA software (version 14, Umetrics, Umeå, Sweden) and a multivariate statistical analysis was performed. Principal component analysis (PCA) and orthogonal partial least squares discriminant analysis (OPLS-DA) were used according to Bylesjö et al.[18] Variable importance in the projection (VIP) value was used to account for which metabolite contributed to the alteration after the glimepiride administration. Permutation tests (n=100) were conducted to ensure model validity and predictability. For assessing statistical significance, Wilcoxon signed rank test was also conducted by using R. Statistical significance for comparison between two groups was set at p<0.05
Metabolite Identification
The putative metabolites were selected according to the VIP value>1.0. The putative metabolites were searched and selected based on the fragment pattern and m/z obtained from human metabolome database (HMDB, http://www.hmdb.ca), METLIN (https://metlin.scripps.edu), Kyoto Encyclopedia of Genes and Genomes (KEGG, http://www.genome.jp/kegg), and PubChem (http://pubchem.ncbi.nlm.nih.gov). After metabolite selection, the putative metabolites were identified with authentic chemicals in the same LC-MS/MS condition.
Results
Untargeted Urinary Metabolomics Analysis
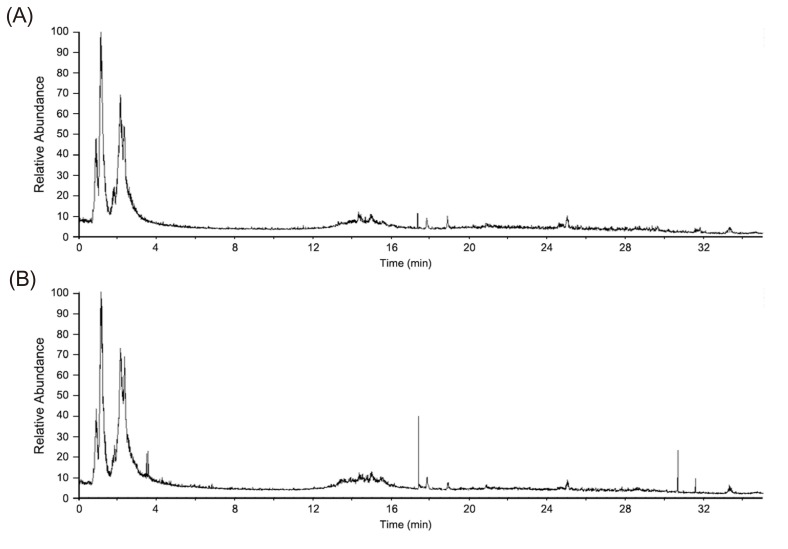
To identify the endogenous metabolites that contributed to the metabolomic alterations resulting from the effects of glimepiride in healthy Korean males, an untargeted metabolomic profiling was conducted. After the oral administration of glimepiride, urine samples were obtained from all the subjects, and analyzed using the LC-MS/MS method. Figure 1 shows the base peak chromatogram of urine samples obtained from the untargeted metabolomics analysis in a positive ion mode. Peaks corresponding to glimepiride and major metabolite features of glimepiride were excluded from the data set prior to the multivariate analysis in order to identify endogenous metabolomic alterations.
Multivariate Statistical Analysis
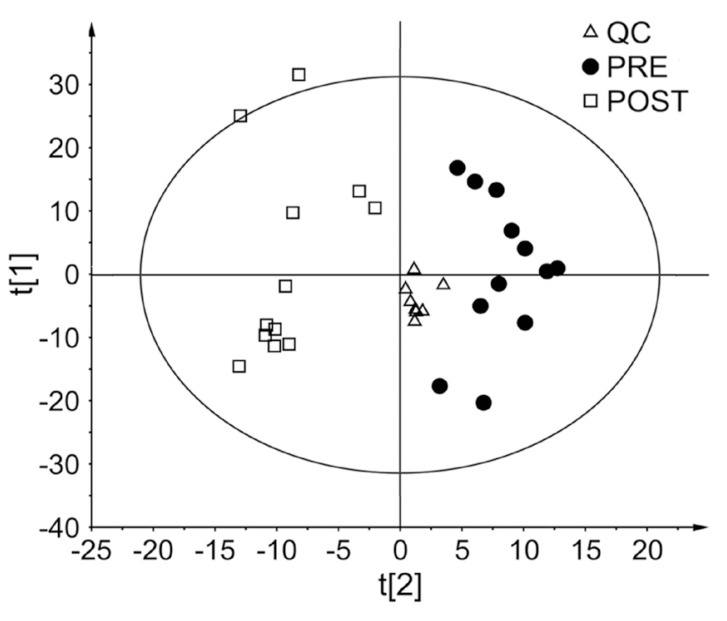
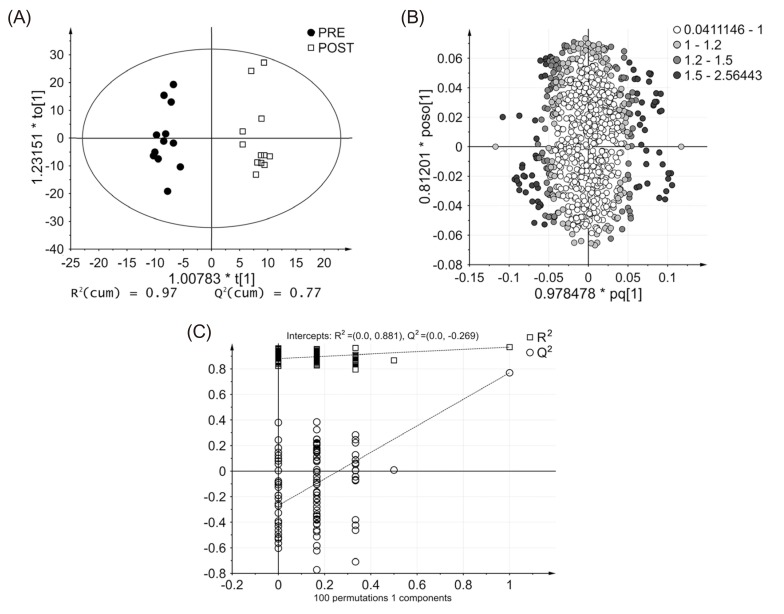
To obtain the statistically significant endogenous metabolites, multivariate statistical analysis (PCA and OPLS-DA) was conducted. As shown in Figure 2, the PCA score plot displays the clustering of pooled QC samples, confirming the validity of our analytical method. Importantly, pre- and post-dose urine samples are clearly divided into two clusters on the PCA score plot. To further analyze the influence of glimepiride administration on metabolomic changes, a supervised method was constructed. Thus, the OPLS-DA model was performed to identify the discriminant between two classes. The OPLS-DA score plot also presents a significant separation between two groups (Fig. 3A), indicating marked metabolomic changes after glimepiride administration. To assess the validity of the OPLS-DA model, R2 (cum) and Q2(cum) were determined as model parameters. The R2 (cum), goodness of fit, was 0.97 and Q2 (cum), predictability, was 0.77 (Fig. 3A). In addition, the OPLS-DA loading plot shows the variables contributed to the separation of the two groups (Fig. 3B). Next, an OPLS-DA internal validation with 100-permutation tests was conducted to ensure the model validity and predictability (Fig. 3C). Based on the randomly permuted test, the R2 and Q2 regression lines were constructed to validate overfitting. The OPLS-DA model showed that the y-axis intercept of R2 and Q2 regression lines were 0.881 and -0.269, respectively.
Metabolite Identification
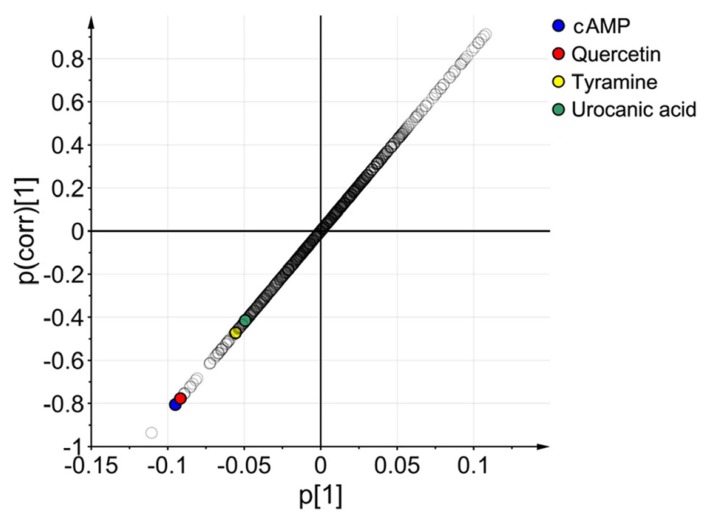
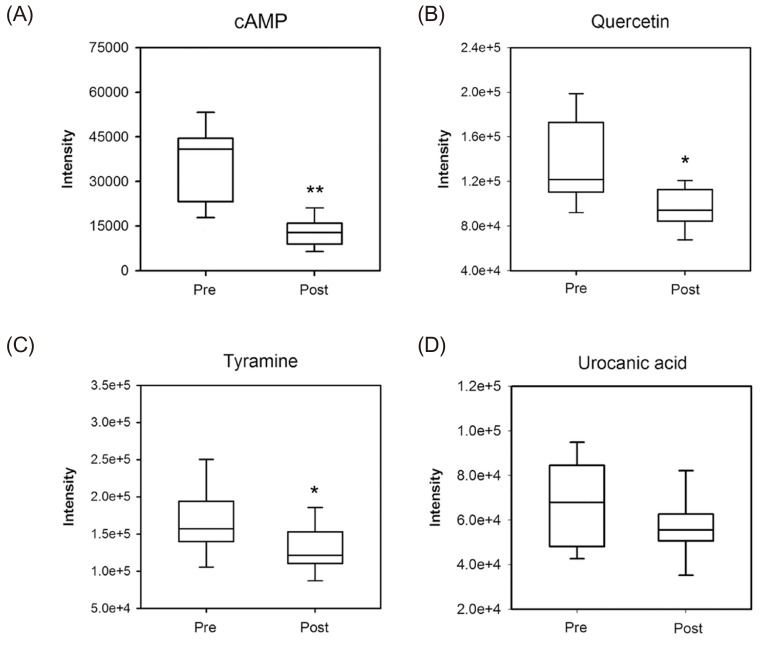
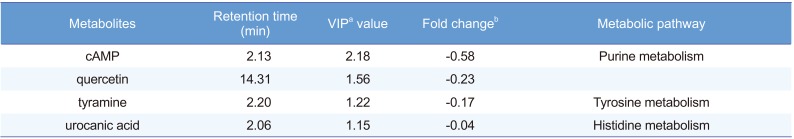
In accordance with VIP value (VIP>1.0), the 288 ion peaks were searched through HMDB, METLIN, KEGG, and PubChem databases based on accurate mass values, mass fragment pattern, and compound structure information. The putative metabolites were then obtained, compared, and analyzed against their standard compounds at identical LC-MS/MS conditions. Based on that comparison, we identified four endogenous metabolites including cyclic AMP (cAMP), quercetin, tyramine, and urocanic acid resulting from the metabolomic alteration following glimepiride administration (Table 1). An S-plot of the OPLS-DA was also constructed and all identified metabolites were in the lower left regions of the plot (Fig. 4). The box and whisker plots in Figure 5 represent the intensity of identified metabolites compared with pre- and post-dose groups. All the identified metabolites were decreased in the post-dose group. The information of four identified metabolites is summarized in Table 1. Based on the KEGG database, we conclusively found that purine metabolism (cAMP), tyrosine metabolism (tyramine), and histidine metabolism (urocanic acid) were changed by the pharmacological effect of glimepiride in healthy human subjects.
Discussion
Glimepiride is a widely used antihyperglycemic agent to treat patients with T2DM. Recently, Huo et al. reported the effect of SUs, including glimepiride, on metabolomic changes.[15] They used urine samples collected from normal group, non-treated patients with T2DM and SU-treated patients with T2DM. The samples were analyzed using the ultra-performance liquid chromatography/mass spectrometry method. In our study, we analyzed urine samples obtained from healthy Korean male volunteers before and after glimepiride administration under controlled conditions to minimize the effect of confounding variables. The conditions included a standardized diet and medication restrictions.
Multivariate statistical analysis methods have been used to get the comprehensive information of statistically significant endogenous metabolites that contribute to metabolomic alterations. Analysis methods such as PCA and OPLS-DA can visualize the correlation between each class by clustering or separating observations on the score plot.[19] In this study, the score plots of PCA and OPLS-DA methods showed a significant separation between pre- and post-dose groups. These results provide clear evidence that there were marked metabolomic alterations following glimepiride administration. In OPLS-DA model, R2(cum) indicates the goodness of fit and Q2(cum) indicates the predictability of the model. The result of OPLS-DA [R2(cum) = 0.97, Q2(cum) = 0.77] is significantly high, demonstrating that the constructed OPLS-DA model is reliable for a glimepiride metabolomic profiling. In addition, the permutation test plot shows that two permuted R2 and Q2 values were lower than the value of the original model, and also represents negative y-intercept (Q2), indicating that this OPLS-DA model is not overfitting and is valid for this metabolomic profiling.[20] Together, these results indicate that this analytical method is valid and that the urinary metabolomic profiling following glimepiride administration is reproducible. The metabolomic alterations induced by the pharmacological effects of glimepiride were clearly demonstrated.
VIP value reflects the importance of variables in the OPLS-DA model. From the calculated OPLS-DA data, 288 variables that played important roles in the separation were selected according to the VIP>1.0. After confirming with analysis authentic compound, we identified four endogenous metabolites associated with the metabolomic alteration after glimepiride administration. It is known that S-plot obtained from OPLS-DA model represents the influence of variables on group discrimination by combining variable contribution and confidence.[21] In this study, the four identified metabolites were shown in the lower left regions of the S-plot, demonstrating that these metabolites were significantly down-regulated by the administration of glimepiride. These results clearly indicate that these four identified metabolites contributed to the metabolomic alterations observed between the pre- and post-dose groups following glimepiride administration.
Among the identified metabolites, cAMP values were highest in significance when comparing to differences between preand post-dose groups. cAMP is a second messenger that plays an essential role in insulin secretion by amplifying signaling. cAMP also cooperates with exchange protein directly activated by cAMP-2 (Epac2)/repressor-activator protein 1 (Rap1) signaling in insulin secretion induced by the effect of SUs.[22] In the present study, we observed that the cAMP level is markedly lower in the post-dose group. These results are in accordance with previous reports in terms of the intracellular action of SUs on cAMP. SUs are known to activate low Km cAMP-specific phosphodiesterase (PDE) in adipocytes,[2324] which causes cAMP degradation. More importantly, other studies revealed that glimepiride not only stimulates cAMP-PDE but also decreases protein kinase A (PKA) activity, possibly due to reduced intracellular cAMP concentration.[2526] These results indicate that glimepiride decreases cytosolic cAMP levels via the regulation of cAMP-PDE and PKA. Furthermore, insulin has been reported to reduce cytosolic cAMP level by activating cAMP-PDE[272829] and inhibiting adenylcyclase synthesis.[30] As glimepiride is an antihyperglycemic agent that enables the stimulation of insulin secretion, healthy volunteers who were administered glimepiride may have experienced a hyperinsulinemic state. Therefore, we speculate that the decreased cAMP level from the post-dose group might be seen due to hyperinsulinemic state after administration of glimepiride.
previous study demonstrated that insulin administration in rats resulted in a reduction of p-tyramine and an increase in m-tyramine.[31] As glimepiride stimulates insulin secretion from β-cells, one could expect that tyramine levels may change in the subjects who were administrated glimepiride. In fact, we observed that the total tyramine level was significantly decreased after glimepiride administration. These results indicate that tyrosine metabolism was altered in response to glimepiride. Quercetin is a flavonoid found in many fruits and vegetables. Previous studies reported that quercetin has anti-diabetic and anti-oxidative effects in the diabetic rat. In our study performed in healthy human subjects, quercetin levels were decreased after glimepiride administration. Further studies are needed to elucidate the factors which affect the quercetin level in response to glimepiride.[32]
In this study, we used the LC-MS/MS system to profile the metabolomic alterations in healthy Korean males who were administered glimepiride. We found that there were significant metabolomic changes after glimepiride administration. This study identified cAMP, which is related to insulin secretion, as the most significantly altered metabolite, induced in response to the pharmacological effects of glimepiride. Collectively, this study reveals that this pharmacometabolomic approach is appropriate for profiling metabolomic changes caused by glimepiride. Furthermore, the pharmacometabolomic profiling data could offer insights on how glimepiride influences biochemical changes in healthy humans.
 XML Download