

 PDF
PDF ePub
ePub Citation
 Print
Print


Introduction
Increased portal pressure is related to multiple complications in liver cirrhosis, and the renin–angiotensin–aldosterone system plays important roles in portal hypertension.[1] Fimasartan is a nonpeptide angiotensin II receptor blocker with a selective type 1 receptor blocking effect.[2] It is rapidly absorbed after oral administration with a peak plasma concentration at 0.5–3.0 h,[3] and its exposure is dose proportional with a terminal elimination half-life ranging from 5 to 16 h in healthy subjects. [3] The absolute bioavailability of orally administered fimasartan in healthy subjects is 18.6%,[4] and its protein binding is about 96%.[5] Most of the circulating fimasartan in plasma is in the parent form, although fimasartan is catabolized by multiple cytochrome P450s (CYP), mainly CYP3A4, UDP-glucuronosyltransferases, and other enzymes.[6] The urinary excretion of unchanged fimasartan is <3% over the first 24 h after administration, and it is mostly excreted into the bile as either parent or in a glucuronide conjugated form.[7]
We have reported the pharmacokinetics (PK) and safety of fimasartan in patients with hepatic impairment compared with healthy subjects.[8] After a single oral administration of fimasartan, subjects with mild hepatic impairment appeared to show exposure similar to that of healthy individuals, whereas subjects with moderate hepatic impairment exhibited approximately 6.6-fold and 5.2-fold increase in the peak concentration (Cmax) and area under the time–concentration curve (AUC) of fimasartan, respectively.[8] Based on the results of this study, the Ministry of Food and Drug Safety in Korea approved the label of fimasartan stating that it should not be administered to subjects with moderate-to-severe hepatic impairment. However, the change in blood pressure showed a pattern similar to those of healthy individuals despite the Cmax and AUC of fimasartan being higher in subjects with moderate hepatic impairment. Results of this study imply that fimasartan might not cause serious BP reduction despite the higher exposure in those with moderate hepatic impairment. Thus, we aimed to clarify the long-term influence of increased fimasartan exposure on the BP of patients quantitatively by developing a population PK-pharmacodynamic (PD) model using previously published data.[8]
Go to : 
Methods
The PK and PD (blood pressure) data of fimasartan reported previously[8] was used to develop PK and PK-PD models. The design of the clinical trial is summarized as following.
An open-label, single-dose, parallel study was conducted using a total of 18 subjects in three groups (mild hepatic impairment, moderate hepatic impairment, and healthy group). Six subjects were each assigned to the mild and moderate hepatic impairment group depending on their Child–Pugh score: 5–6 for mild and 7–9 for moderate hepatic impairment. Six healthy individuals participated after completion of hepatic impairment group schedule. After a single administration of fimasartan (120 mg orally), serial blood samples for PK were collected in heparinized tubes before dosing, and 0.25, 0.5, 1, 1.5, 2, 3, 4, 6, 8, 10, 12, 16, 24, 32, and 48 h after dosing. SBP and DBP were measured before dosing, and 1, 2, 3, 4, 8, 12, 24, 32, and 48 h after dosing. All subjects had rested in a sitting position for at least 5 min before BP was measured.
Model development
NONMEM version 7.2 (Icon Development Solutions, Ellicott City, MD, USA) was used to conduct population PK-PD modeling based on the first-order conditional estimation with interaction method (FOCE-INTER). The population PK–PD model was developed sequentially. Population PK model was initially developed, and then the population PD model was developed using a dataset added to the individual PK parameters estimated from the final PK model.
Population PK model
Drug elimination was assumed to follow the first-order kinetics. Based on the first-order kinetics, one- or two-compartment distribution models were assessed. First-order, zero-order, mixed first-order and zero-order, transit compartment, and enterohepatic recycling models were explored to identify the best one to describe the absorption of fimasartan. Each parameter was assumed to be log–normally distributed and described as: Pij = θj exp(ηij) where Pij is the j-th parameter for the i-th individual, θj is typical value for the j-th population parameter, and ηij is a random variable following a Gaussian distribution with a mean of 0 and variance of ω2. An additive, proportional, and combined residual error model were tested. The appropriateness of the model was comprehensively evaluated by considering: likelihood-ratio tests, physiological plausibility, goodness-of-fit diagnostics, and measures of model stability and adequacy including condition number, successful convergence, significant digits, and matrix singularity. Likelihood-ratio test results were considered statistically significant if decreases in the objective function value (OFV) of nested models were more than 3.84 (P < 0.05, one degree of freedom) and 5.99 units (P < 0.05, two degrees of freedom).
After the base structural model was built, covariates were explored to develop the model with the best overall performance using a stepwise forward selection and backward elimination process. Covariates included age, body weight, albumin, total bilirubin, aspartate transaminase (AST), alanine transaminase (ALT), γ-glutamyl transpeptidase, creatinine, and prothrombin time (INR units). All of these covariates were continuous and were centered on their median values. The covariate was considered significantly associated with the PK parameter if both of the OFV decrease and physiological plausibility were satisfied. With those significant covariates, the forward selection and backward elimination process was used.
Population PD model
The circadian rhythm of BP over 24 h was incorporated into the baseline PD model using a method reported previously.[9]
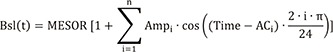
where Bsl(t) represents the baseline BP as a function of clock time (t), MESOR is the rhythm-adjusted 24 h mean BP, Ampi is the i-th amplitude parameter of the cosine function, and ACi is the i-th phase shift parameter of the cosine function. In this step, Ampi and ACi were fixed to the estimates in the report,[9] and MESOR in each subject was calculated using the measured Bsl(0) (the baseline BP at time 0) of each subject and the fixed Ampi and ACi on the right-hand side of the equation above.
Fimasartan is an antihypertensive drug, and the effect of the drug was applied in the model as an inhibitory function. Interindividual variability of PD parameters were assumed to follow a log–normal distribution with a mean 0 and variance ω, and the residual error was described by an additive model. The turnover, effect compartment, and transduction models were compared. Because the turnover model best described the time delay between plasma concentration and BP responses, BP of subjects was described by an equilibrium between endogenous tendencies (stimuli) to elevate and to lower BP.
Rate of BP change = kin·E(C) – Kout·A(4),
where Kin is the zero-order constant for BP increase and E(C) is the drug effect, Kout is the first-order rate constant for BP decrease, and A(4) is the amount in the compartment representing BP.
Fimasartan was assumed to exert its effect by inhibiting the stimuli to elevate BP. The drug effect, E(C), was considered as an inhibitory sigmoid function:
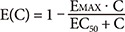
where Emax is the maximum effect (0≤Emax≤1), and EC50 is the plasma concentration required for 50% maximal inhibition. The influences of disease severity on Emax or EC50 were screened by comparing the OFVs after incorporating three combinations of subject groups: healthy, mild, moderate; healthy, (mild and moderate); (healthy and mild), moderate.
Model evaluation and simulation
Using the final PK and PD models, 1,000 bootstrap-resampled datasets were estimated to calculate the mean and 95% CIs for population PK and PD parameters. A visual predictive check (VPC) using 1,000 simulated datasets was conducted in each PK and PD model. The 90% prediction intervals of simulated data were overlaid with the observed data.
Go to :
Results
Study subject subjects
A total of 18 subject subjects (six each in healthy, mild hepatic impairment, and moderate hepatic impairment groups) completed the trial. There were 288 observation points for plasma fimasartan concentration and 180 collected datum points for BP. There were no statistical differences in age, body weight, or height between the groups (P>0.05, Table 1). Subjects in the group with moderate hepatic impairment showed significantly higher bilirubin and lower albumin than in other groups, and a prolonged prothrombin time (P<0.05, Table 1).
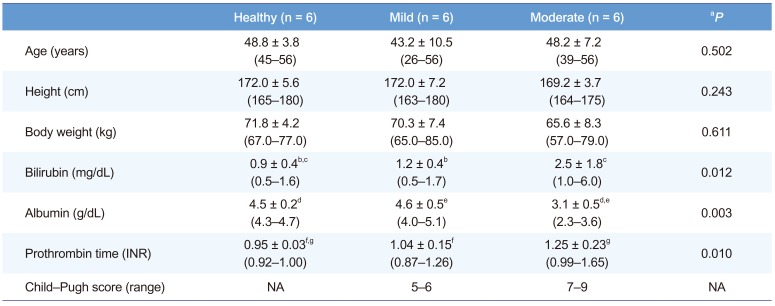
Table 1
Demographic characteristics at baseline
Data are given mean ± SD (min–max). Abbreviation: Mild, mild hepatic impairment; Moderate, moderate hepatic impairment; NA, not applicable. aP-values for differences between the healthy, mild hepatic impairment, and moderate hepatic impairment groups were calculated using a Kruskal–Wallis test. Multiple comparisons by Tukey's test were also conducted for variables, which were identified as significant by the Kruskal–Wallis test.
b, c, d, e, f, gP < 0.05 by multiple comparison analysis.
![]()
Population pharmacokinetic analysis
The plasma concentration of fimasartan was best described by a 2-compartment, first-order elimination model with a proportional residual error. Because multiple plasma concentration peaks were shown after a single oral administration of fimasartan, some absorption models were explored. Among them, the mixed zero-order absorption followed by first-order absorption with a lag time best described the absorption of fimasartan. The overall structure of PK and PD is presented in Figure 1.
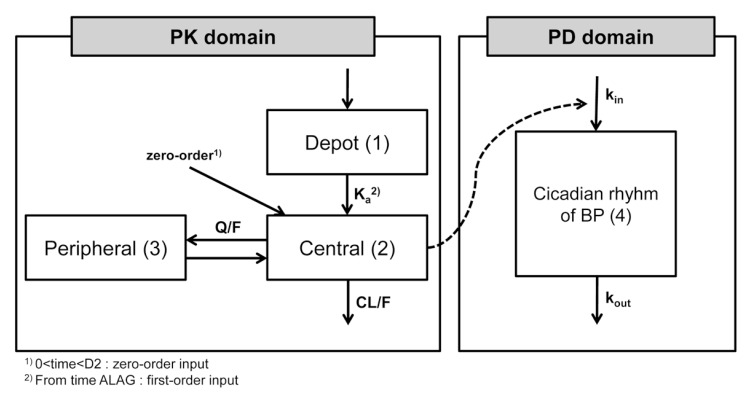 | Figure 1The structure of the pharmacokinetic and pharmacodynamics models for fimasartan. Notes: (1) 0 < time < D2, zero-order input; (2) first-order input after ALAG, Abbreviations: Ka, rate of constant for first-order absorption; Q/F, intercompartmental clearance; CL/F, clearance; kin, input rate for production of response; kout, first-order rate constant for loss of response; BP, blood pressure; D2, duration of absorption for the zero-order absorption process; ALAG, lag time before first-order absorption.
|
The mean Cmax of the group with moderate hepatic impairment was 6.6 times that of the group of healthy individuals, unlike the group with mild hepatic impairment.[8] To describe this difference of absorption characteristics according to hepatic dysfunction, we introduced another fixed effect term IL (increment by liver disease: IL1 for mild, and IL2 for moderate liver disease) into the structural PK model. Based on a previous report,[4] the absolute bioavailability (F) of fimasartan in healthy subjects was fixed to 0.18 in our PK model. Thus, F was estimated as 0.18 (fixed for healthy subjects), 0.18 + IL1 for mild and 0.18 + IL2 for moderate liver disease. F was also assumed to be the sum of F1 and F2 (F = F1 + F2), the fractions absorbed by first-order and zero-order inputs, respectively. For simplicity, the relationship was rewritten to F = F1 + F2 = (1 – α) F + αF, and we estimated α as a coefficient between 0 and 1. The final population PK parameter estimates are summarized in Table 2. Basic goodness-of-fit plots for the final PK model are shown in Figure 2.
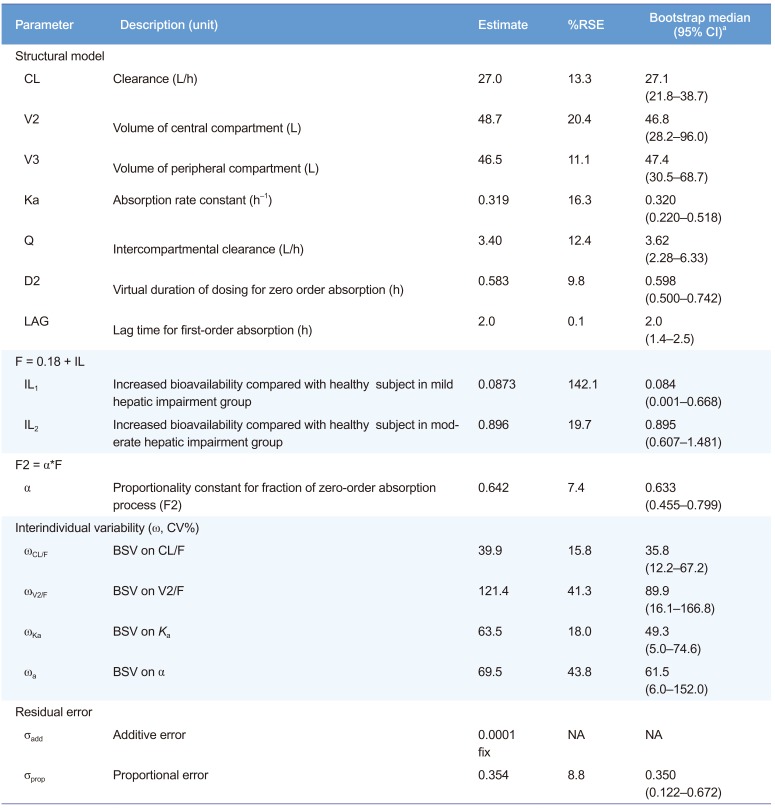
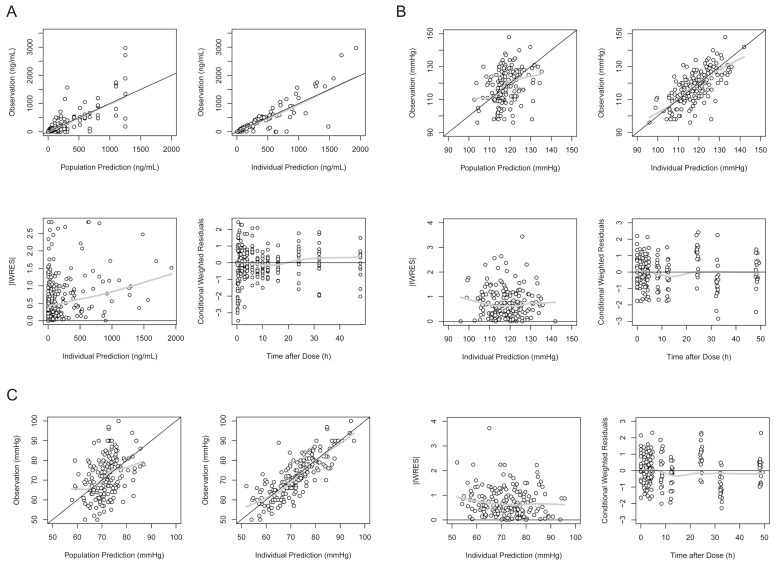 | Figure 2Goodness-of-fit plots for the final population pharmacokinetic and pharmacodynamic models of fimasartan. Notes: (A) Plasma concentration of fimasartan; (B) systolic blood pressure; (C) diastolic blood pressure. Black line indicates identity, and gray line indicates locally-weighted regression smooth line. Abbreviation: IWRES, individual weighted residuals.
|
Table 2
Final estimates of population pharmacokinetic parameters
![]()
Population pharmacodynamic analysis
The parameter estimates for the BP circadian rhythm were presented in Table 3. In our final model, the BP was the sum of circadian changes and drug effects:
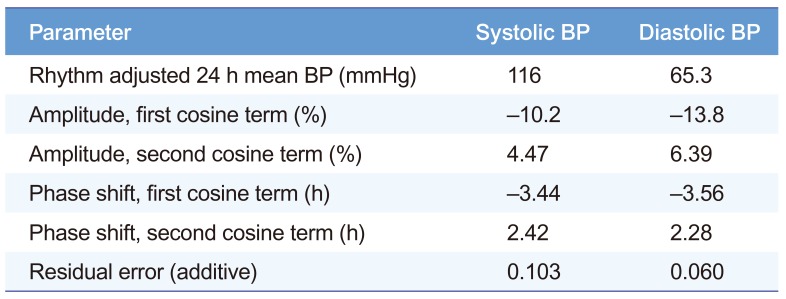
Table 3
Parameter estimates derived from the change in the blood pressure of healthy volunteers from baseline
![]()
BP(t) = Bsl(t) + A(4)(t) – MESOR
where BP(t) is the change of BP over time (t), and A(4)(t) is also a function of time. The final parameters of population PD are summarized in Table 4, and basic goodness-of-fit plots of the final PD models (SBP and DBP) are shown in Figure 2. The EC50 was found to be increased in subjects with hepatic impairment compared with that in healthy subjects (Table 4).
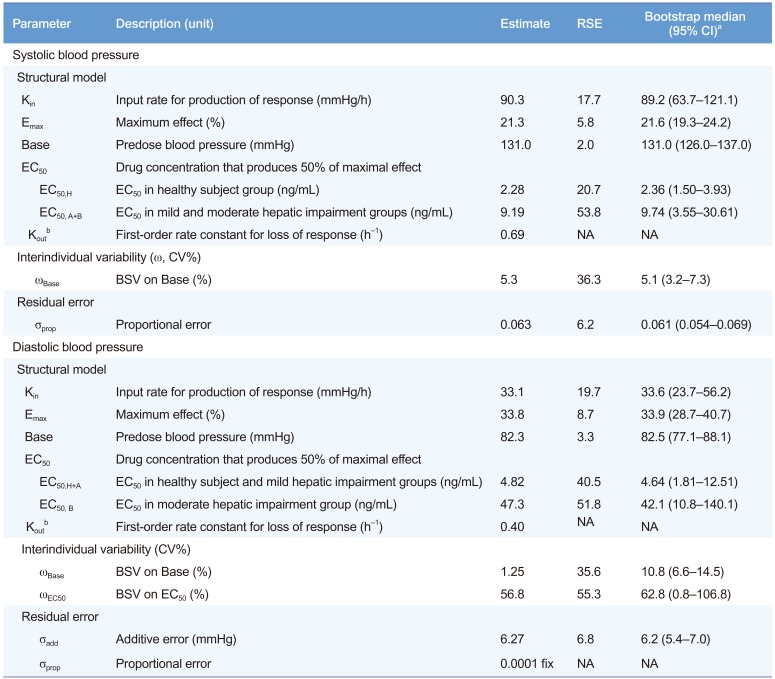
Table 4
Final estimates of population pharmacodynamic parameters
![]()
Model evaluation and simulation
The median estimates of PK and PD parameters obtained from bootstrapping were nearly identical to the final parameter estimates (Table 2 and 4). VPC plots of PK and PD model are presented in Figures 3 and 4, respectively. Most of the observed concentrations or BP data (SBP and DBP) were within the 90% prediction intervals in VPC for PK and PD.
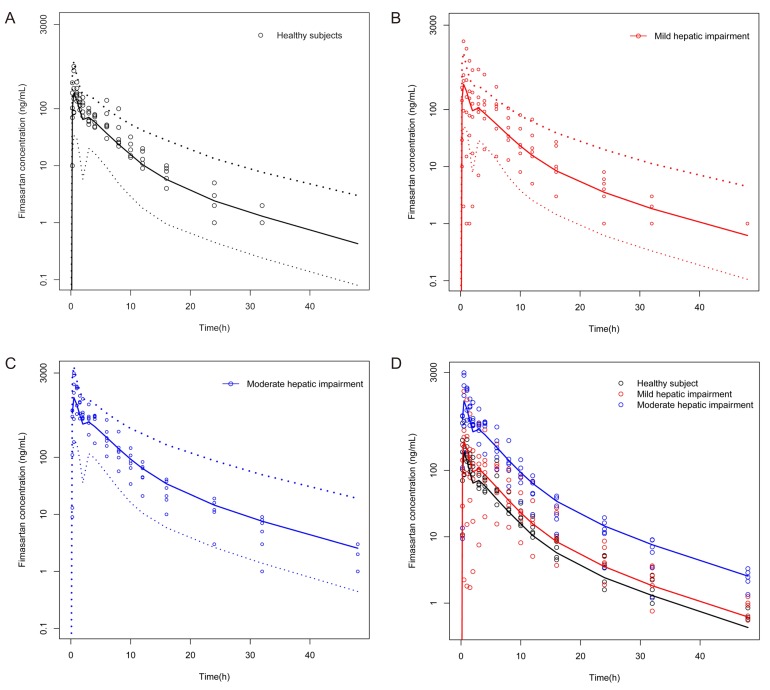 | Figure 3Visual predictive check plots for the final pharmacokinetic model. Notes: (A) Healthy subjects, (B) subjects with mild hepatic impairment, (C) subjects with moderate hepatic impairment, (D) total study population. Solid lines indicate median predicted concentration, and dotted dashed lines indicate 5th and 95th percentile predicted concentration.
|
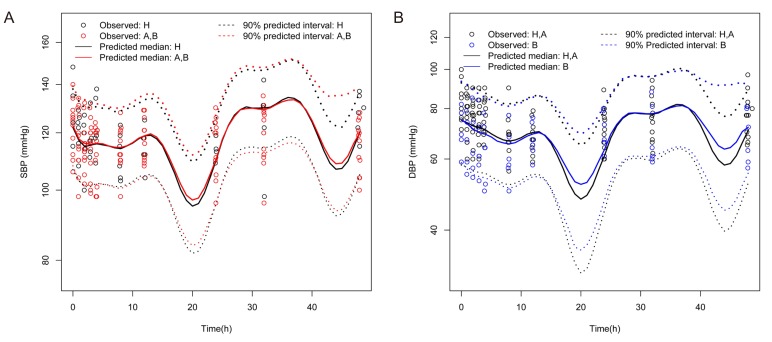 | Figure 4Visual predictive check plots for the final pharmacodynamic model. Notes: (A) SBP: Predicted median and 90% confidence interval for each group. (B) DBP: Predicted median and 90% confidence interval for each group. Abbreviations: A, group with mild hepatic impairment; B, group with moderate hepatic impairment; H, group of healthy subjects; SBP, systolic blood pressure; DBP, diastolic blood pressure.
|
Go to :
Discussion
Even though the exposure to fimasartan in subjects with moderate hepatic impairment was about 5–6 fold higher than in healthy subjects after oral administration in the previous study,[8] BP did not decrease as much as plasma concentration change. Thus, we developed a population PK-PD model of fimasartan to evaluate the effect of hepatic function on the BP reduction, and predicted the BP change after 30-day oral administration of fimasartan 120 mg once daily.
In this study, fimasartan plasma concentration–time profiles have shown a pattern of rapid initial rise, second peak, and biexponential decline after oral administration. In addition, the initial increase to Cmax was the most distinct in those subjects with moderate hepatic impairment, whereas the elimination rate constants were similar between the study groups. Fimasartan is eliminated mostly to feces via biliary excretion by organic anion-transporting polypeptides, it is also metabolized primarily by CYP3A4.[4510] Only two subjects in the group with mild hepatic impairment were diagnosed with liver cirrhosis, by contrast, all of the subjects in the group with moderate hepatic impairment group were patients with chronic liver cirrhosis. Therefore, this discrepancy in absorption profiles according to study group could be the result of the cirrhotic disease in the patient subjects. The hepatic extraction ratio of fimasartan was assumed to be approximately 0.47,[4] and in cirrhotic subjects with moderate hepatic dysfunction, liver disease could have affected fimasartan absorption and elimination via a pathophysiological change as follows: a reduction in the first-pass effect through extrahepatic or intrahepatic shunting of blood, hepatocyte dysfunction, change in serum protein levels, and changes in bile flow.[11] To explain the differences in bioavailability according to hepatic function, we applied the bioavailability relative to that of healthy subjects, IL, into the structural PK model. Based on a previous report,[4] we assumed that the bioavailability in healthy individuals was fixed to 0.18, and bioavailability in patients was estimated relative to that in healthy subjects in each group with hepatic dysfunction.
We compared a few absorption models to find the model which best describes the second peak phenomena. The second peaks were also observed after intravenous administration in other clinical trials, suggesting the presence of enterohepatic recirculation.[3712] The empirical model of two-compartment distribution and mixed zero-order absorption followed by first-order absorption with a lag time best described PK characteristics of fimasartan in this study. This may have been the result of insufficient data to develop a physiological model incorporating the enterohepatic recirculation. The absorption model selected in this study has been used for other fimasartan modeling.[13]
Age and body weight are correlated with the exposure or PK parameters of fimasartan.[1314] We explored covariates after building the structural PK model; however, none of the covariates was incorporated into the PK model. This may be the result of the strict inclusion and exclusion criteria in this study. There were no significant differences in age and body weight between the three groups (Table 1). A few laboratory variables such as total bilirubin, albumin, and PT were significantly different among study groups, but none of these was selected as a covariate.
BP fluctuates over 24 h following a circadian rhythm, and it is important to consider the circadian rhythm of BP to incorporate into the PD model with antihypertensive agents. Twenty-four-hour ambulatory blood pressure measurements (ABPM) reveal a significant circadian variation in BP, and it is recommended that the effect of drugs on BP response be evaluated.[15] Because our study did not assess 24-h ABPM, we applied the baseline circadian rhythm of BP reported in a previous study (of healthy Koreans) into our PD model.[9]
There was a counterclockwise hysteresis between the mean plasma fimasartan concentration and BP, suggesting a lag in the time to the maximum effect (data not shown). Fimasartan is an angiotensin receptor blocker, and the effect is exerted by inhibiting the renin–angiotensin–aldosterone system. Based on the pharmacological mechanism of fimasartan, a transit model would be more mechanistic than others. However, a turnover model was the best to explain our data as it was in a previous study of healthy Korean subjects.[9] The sparseness of BP data may be the reason why the PK and PD data do not support the transit model.
Using the final PK-PD model, simulations were performed to investigate the effect on BP according to the severity of hepatic dysfunction. The plasma concentrations of fimasartan have fallen below the EC50 12 h after administration in hepatic impairment patients whose EC50 values were higher than those in healthy subjects (Table 4). The discrepancy in effect by hepatic disease severity was similar to those found in a study of the angiotensin-converting enzyme (ACE) inhibitor, cilazapril. [16] Cilazapril concentrations were higher in subjects with hepatic impairment, but the BP responses were similar to those of healthy individuals. Patients with cirrhosis had significantly higher predrug plasma ACE and renin activity than that in healthy controls.[16] There are a few reports regarding the higher activity of ACE and renin in patients with cirrhosis,[117] and all of our subjects with moderate hepatic dysfunction were diagnosed as having liver cirrhosis. Therefore, we speculate that augmented BP lowering effects are not likely to occur in patients with liver cirrhosis following 120 mg of fimasartan despite their higher exposure to the drug.
Go to :
 XML Download