

 PDF
PDF ePub
ePub Citation
 Print
Print


Introduction
Tadalafil, commercialized as Cialis®, is used for treating erectile dysfunction (ED). It works by selectively inhibiting the activity of phosphodiesterase 5 (PDE5), an enzyme present predominantly in the corpus cavernosum penis.[12] PDE5 is an intracellular enzyme that hydrolyzes cyclic guanosine monophosphate (cGMP).[34] Its inhibition leads to an increase of intracellular cGMP concentrations and thereby an enhancement of the nitric oxide–cGMP cascade, causing an erection through relaxation of the smooth muscle of the erectile tissue. [1234] Currently, the PDE5 inhibitors sildenafil, vardenafil, and tadalafil are widely used clinically for ED treatment. Compared to sildenafil or vardenafil, tadalafil has a longer half-life (17.5 hours) and longer duration of action (12–36 hours). Furthermore, tadalafil's rate and extent of absorption are unaffected by food and alcohol intake.[4567] Owing to these pharmacological properties, the interest in developing a new formulation of and generic tadalafil for ED treatment has increased.[8]
Thus far, several chromatographic methods have been developed for tadalafil determination in plasma, including liquid chromatography (LC) coupled with ultraviolet (UV)[910] and fluorescence detection.[11] In recent pharmacokinetic studies, LC-tandem mass spectrometry (LC-MS/MS) has primarily been used for measuring tadalafil in plasma because of its high sensitivity and selectivity.[1213141516171819] Proença et al. published a validated ultra-performance liquid chromatography (UPLC)-MS/MS method for the analysis of sildenafil, vardenafil, and tadalafil in postmortem blood samples.[17] Lee et al. also reported an LC–MS/MS method for the determination of five ED drugs and their selected metabolites in hair to monitor abuse of mirodenafil, sildenafil, tadalafil, udenafil and vardenafil.[18] However, these methods required a relatively long run time, over 5 min,[1415161718] which is not suitable for high-throughput tadalafil determination. Thejomoorthy et al. reported a sensitive LC-MS/MS method for tadalafil determination in rat plasma with the linearity range 0.5 to 1,000 ng/ml using liquid-liquid extraction (LLE) method, but it required large amounts of extraction solvent and a time-consuming process in sample preparation.[19] Therefore, this study was aimed at developing and validating a simple, rapid, and reliable UPLC-MS/MS method for tadalafil determination in human plasma that may have applications in pharmacokinetic, bioavailability, or bioequivalence studies.
Experimental
Chemical and reagents
Tadalafil standard (CAS Number 171596-29-5), internal standard (IS, Sildenafil citrate, CAS Number 171599-83-0), ACS reagent-grade formic acid, and ammonium acetate were purchased from Sigma-Aldrich (St. Louis, MO, USA). Methanol (MeOH) and acetonitrile (ACN) were supplied by Burdick & Jackson (Muskegon, MI, USA). All other reagents were of analytical grade.
Preparation of standard and quality control (QC) samples
Tadalafil and IS stock solutions were prepared in MeOH–water (50/50, v/v) at a concentration of 1 mg/mL. The calibration standards for tadalafil were further diluted serially with blank plasma to obtain final concentrations of 5, 10, 20, 50, 100, 500, and 1000 ng/mL. Quality control (QC) samples were prepared in the same way in blank plasma at low (QCL; 15 ng/mL), medium (QCM; 400 ng/mL) and high (QCH; 800 ng/mL) concentrations. Stock solutions and aliquots of the calibration standards and QC samples were stored at −70℃ until use.
Sample preparation
Before analysis, a 20-µL aliquot of plasma sample was transferred to a 1.5-mL polypropylene tube. IS solution (sildenafil, 500 ng/mL; 10 µL) and 200 µL of acetonitrile were added. The mixture was briefly vortex-mixed for 10 s followed by centrifugation at 13,000 × g for 5 min. The supernatant (5 µL) was injected into the UPLC–MS/MS system for analysis. All prepared samples were kept at 10℃ until injection.
UPLC-MS/MS conditions
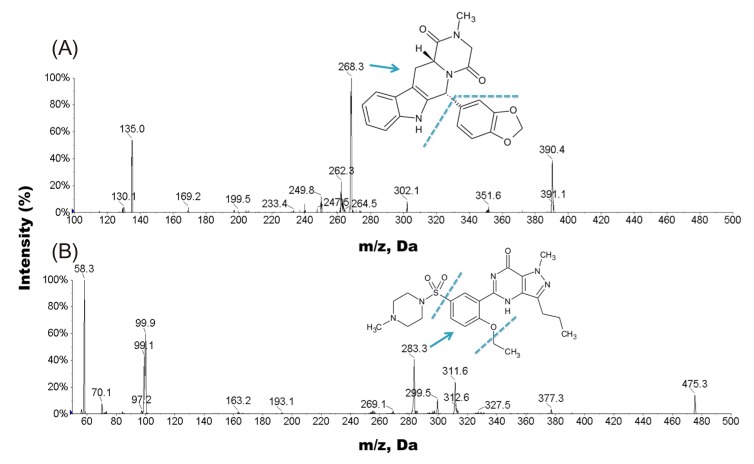
Chromatographic separation was performed with a Waters® Acquity UPLC I-Class system. The analytes were eluted from a C18 column (Shisheido C18, 2.7 µm, 2.0 × 100 mm) at a flow-rate of 0.7 mL/min with a mobile phase comprising 2.0 mM ammonium acetate and acetonitrile (55:45, v/v) with 0.1% formic acid. The analytes were detected by electrospray ionization (ESI) MS in positive ion mode on an API 4000 triple quadrupole mass spectrometer (AB SCIEX, Toronto, Canada). The quantification was performed using multiple reaction monitoring (MRM) mode of the transitions m/z 390.4 → 268.3 and 475.3 → 283.3 for tadalafil and IS, respectively. The dwell time was set to 50 ms for each MRM transition. The source parameters of the mass spectrometer were optimized and maintained as follows: collision activated dissociation (CAD) gas, 4; curtain gas (CUR), 20; gas 1 (nebulizer gas), 60; gas 2 (heater gas), 60; turbo ion spray (IS) voltage, 5300 V; and source temperature, 650℃. Other optimized compound parameters for analyte monitoring were as follows: declustering potential (DP), 80 V; entrance potential (EP), 10 V; collision energy (CE), 16 V for tadalafil and 80 V for IS; and collision cell exit potential (CXP), 20 V for tadalafil and 8 V for IS. Data acquisition and sample quantification were performed using Analyst 1.6.1 software and MultiQuant™ 3.0 (AB SCIEX, Toronto, Canada).
Method validation
The analytical method was fully validated for specificity, linearity, sensitivity, precision, accuracy, recovery, matrix effect, stability, dilution integrity, and incurred sample reanalysis (ISR) according to the FDA guidelines for bioanalytical method validation.
Specificity
Specificity was assessed by analyzing blank plasma samples from six different lots and spiked plasma samples at lower limit of quantification (LLOQ) level to determine whether the interfering substances were present at the retention times of tadalafil and IS. The peak area of the co-eluting components should be less than 20% of tadalafil response at the LLOQ level.
Linearity and lower limit of quantification
The linearity of the method was evaluated based a calibration curve in the range of 5 to 1,000 ng/mL, which was the expected concentration range after a single oral dose of tadalafil 20 mg. [12] Each calibration curve was constructed based on the least squares linear regression of the tadalafil to IS peak area ratio versus the nominal analyte concentrations with a weighting factor of 1/x. Deviations of these back-calculated concentrations from the spiked concentrations were set within ±15% (±20% for the LLOQ) of the theoretical value. The sensitivity of the method was evaluated by determining the LLOQ, which was defined as the lowest concentration on the calibration curve with the precision and accuracy within ±20%, which was evaluated in six replicates in three consecutive runs.
Precision and accurac
The precision and accuracy of the assay were assessed by determining four QC samples (LLOQ, QCL, QCM and QCH) on five separate days. Precision was expressed as the relative standard deviation (RSD) and accuracy was expressed as the relative error (RE) between the calculated and nominal concentrations. The precision for QC samples ought to be within 15%, and accuracy between ±15% except LLOQ where it should be within 20%.
Recovery and matrix effect
The extraction recovery was estimated at the three QC (QCL, QCM and QCH) levels by comparing the peak area response of extracted analytes with unextracted analytes (extracted blank sample spiked with the analytes), which represent 100% recovery. The matrix effect was measured at the three QC levels by comparing the peak area of tadalafil dissolved in the extracted blank plasma samples to that of the pure standard solutions at the equivalent concentration. The recovery and matrix effect of IS were also evaluated using the same method.
Stability
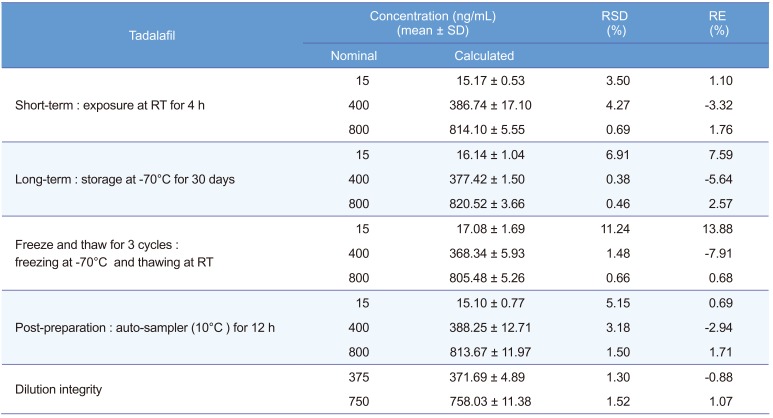
Tadalafil's stability was evaluated at the three QC levels with three determinations of each under various conditions. Shortterm stability was tested at room temperature (25℃) for 4 h, and long-term stability at −70℃ for 30 days. Freeze–thaw stability was evaluated after three freeze–thaw cycles (freezing at −70℃; thawing at room temperature) along with the freshly prepared QC samples. Post-preparation stability was also assessed by reanalyzing the same sample after storage in an autosampler (10℃) for 12 h. The plasma samples were considered stable if the results are within 15% of RE and RSD, respectively.
Dilution integrity
Dilution integrity was performed to extend the upper concentration limit with acceptable precision and accuracy. The six replicate samples at concentration of about 1.50 times of the ULOQ concentration were diluted to two- and four-fold with blank plasma. The diluted samples were processed and analyzed with un-diluted calibration curve standards.
Incurred sample reanalysis
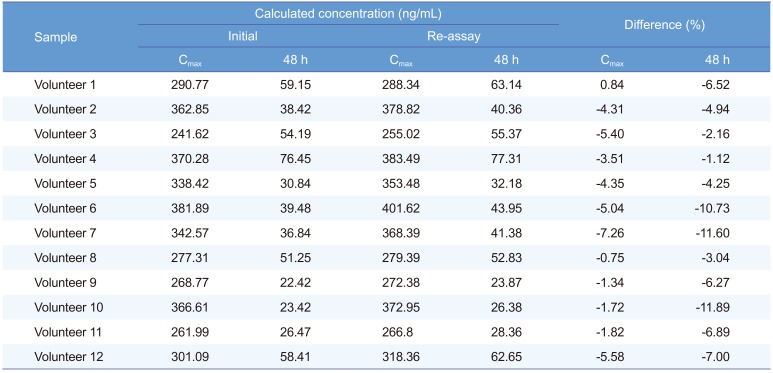
An ISR was performed by selecting the 24 samples (2 samples from each subject) near Cmax and the 48 h in the pharmacokinetic profile. The results obtained were compared with the initial values. The percent change in the value should not be more than ±20%.[20]
Application to pharmacokinetic studies
The validated UPLC-MS/MS method was applied to the pharmacokinetic study of tadalafil in Korean male healthy volunteers. The study protocol was approved by the H-plus (H) Yangji Hospital institutional review board and written informed consent was obtained from all volunteers. A single oral dose of 20 mg of the drug was given to the volunteers with 240 mL of water. Blood samples were collected in K2 EDTA tubes immediately at 0.0 (pre-dose), 0.5, 1.0, 1.5, 2.0, 3.0, 4.0, 6.0, 8.0, 12.0, 24.0, 48.0, and 72.0 h after oral administration. Plasma was separated by centrifugation (3,200 × g, 10℃, 10 min) and kept frozen at −70℃ until analysis. Tadalafil's pharmacokinetic characteristics were assessed by a non-compartmental method using the Phoenix WinNonlin 6.4 software (Certara, Princeton, NJ). Data were expressed as mean ± SD.
Results
UPLC-MS/MS conditions
The ionization mode was firstly investigated using direct infusion ESI–MS analysis on both positive and negative modes. Sildenafil was chosen as the IS because of its structure and chemical properties similar to those of tadalafil. Under ESI condition, tadalafil and sildenafil (IS) exhibited higher sensitivity in positive ion detection mode than in the negative ion detection mode. Since both of tadalafil and sildenafil contain the basic amine functional group, a low-pH mobile phase with 0.1% formic acid was used for better ionization in the positive ion mode. As shown in Figure 1, tadalafil and sildenafil produced [M+H]+ ions at m/z 390.4 and 475.3, respectively. The MS/MS parameters, including the declustering potential (DP), the collision cell exit potential (CXP) and collision energy (CE), were optimized to obtain the most stable and intense product ion for the tadalafil and IS. The most abundant and stable fragment ions were observed at m/z 268.3 for tadalafil and m/z 283.3 for IS, respectively (Fig. 1). Analytes were detected by tandem mass spectrometry using MRM of precursor-product ion transitions with 50 ms dwell time, at m/z 390.4 → 268.3 and m/z 475.3 → 283.3 for tadalafil and IS, respectively.
Subsequently, the chromatographic condition was optimized. Initially, we investigated mobile phase composition with buffer, acetonitrile, methanol, and various pH conditions to achieve the symmetric peak shape, sufficient sensitivity, and short run time for the tadalafil and IS. Acetonitrile afforded better sensitivity and resolution in the analysis of both tadalafil and IS, as well as the advantage of less pressure on the column. We observed that both tadalafil and IS required ammonium acetate in the buffer to obtain efficient ionization and fragmentation in the MRM analysis. In addition, 0.1% formic acid was necessary to maintain a sharp chromatographic peak shape in both acetonitrile and 2 mM ammonium acetate buffer. Additionally, several reversed phase C18 columns with different particle size (from 1.8 µm to 3.5 µm particle size) were tested for detection of the tadalafil and IS. The results demonstrated that a Shiseido CAPCELL CORE C18 column (100 × 2.1 mm, 2.7 µm) was most suitable for peak width and resolution of the tadalafil and IS as well as provided lower backpressure. Under the developed chromatographic conditions, both tadalafil and IS were eluted rapidly within 1.0 min.
This method was intended to improve the high-throughput efficacy in clinical studies. Therefore, we selected the protein precipitation method for sample preparation because it is a simple, easy, and rapid sample clean-up procedure. The protein precipitation was achieved using organic solvents including methanol, acetonitrile, and methanol/acetonitrile. The test results showed that acetonitrile yielded higher tadalafil recovery than other solvents, and also had weak or negligible matrix background peaks. Therefore, acetonitrile was selected as the protein precipitation solvent.
Method validation
Specificity
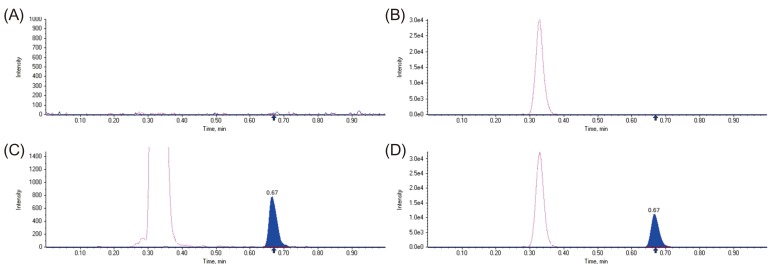
Figure 2 shows the representative MRM chromatograms of tadalafil and IS in blank human plasma, blank human plasma spiked with IS, blank human plasma spiked with tadalafil at LLOQ (5 ng/mL) and IS, and a human plasma sample 2 h after oral tadalafil administration. The retention times of tadalafil and IS were about 0.67 and 0.33 min, respectively. No interfering peaks from endogenous substances were observed at the retention times of tadalafil and the IS in human plasma samples from six different sources.
Linearity and LLOQ
The calibration curve was linear across the concentration range, the observed deviation was within ±15% and the coefficient of determination (R2) was above 0.99 for all calibration concentrations. The LLOQ in human plasma was 5 ng/mL with RSD and RE of 2.1% and -2.48 %, respectively.
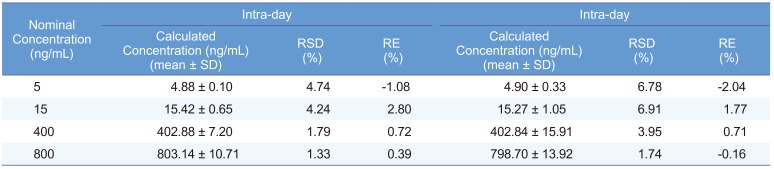
Precision and accuracy
Intra- and inter-day precision and accuracy data at the four QC levels are listed in Table 1. The results demonstrated that the values were within the acceptable range and the method was accurate and precise.
Recovery and matrix effect
The extraction recovery of tadalafil was 90.38 ± 5.32%, 95.78 ± 4.37% and 97.32 ± 3.52% (n=3) at the three QC concentrations (15, 400, and 800 ng/mL). The recovery of IS (500 ng/mL) was 97.3 ± 3.15% (n=3). The matrix effect for tadalafil was 103.2 ± 12.35%, 98.5 ± 2.47%, and 103.1 ± 0.56% (n=3) at the three QC concentrations, and the matrix effect of IS was 93.4 ± 4.04% (n=3). These results indicate that the method provides satisfactory extraction efficiency and no significant interference of coeluting endogenous compounds with tadalafil or the IS.
Stability
All the stability results are shown in Table 2. The results demonstrate that tadalafil was stable under the storage conditions mentioned in the method validation section, since the RE and RSD for all samples were within 15%. Therefore, the established method was suitable for the pharmacokinetic study.
Dilution integrity
The upper concentration limit was extended to 1,500 ng/mL by using 2–fold and 4–fold dilutions with screened human blank plasma. The % RSD for dilution integrity of half and quarter dilution was found to be 1.30% and 1.52%, while the accuracy results were found to be -0.88 % and 1.07%, respectively (Table 2).
Pharmacokinetic study and incurred samples reanalysis
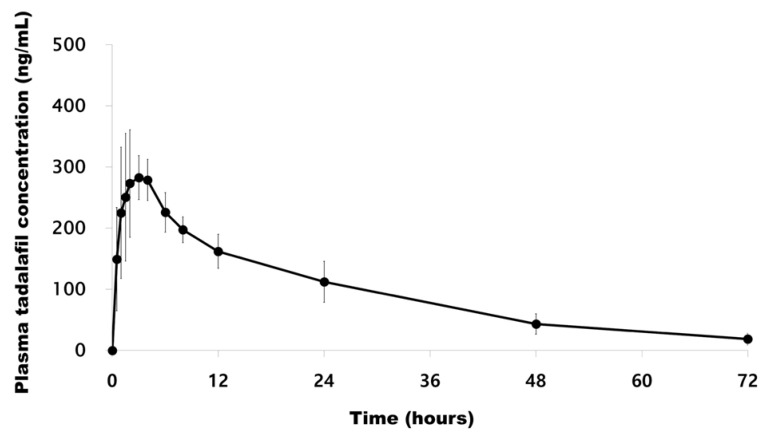
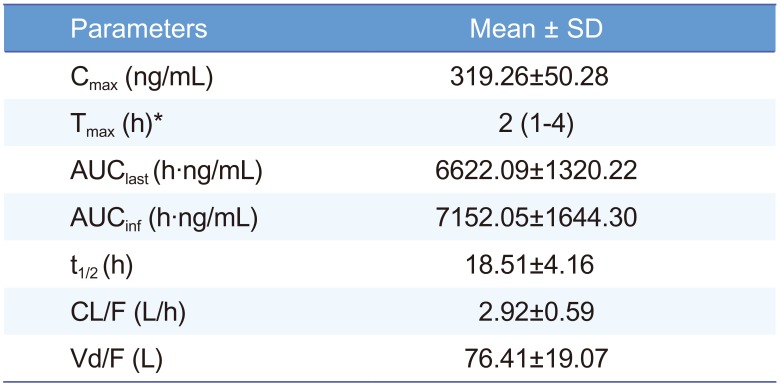
The method was successfully applied to the plasma samples obtained from 12 Korean healthy male volunteers after oral administration of a single dose of Cialis® (Tadalafil; 20 mg/tablet) and pharmacokinetic parameters were evaluated. The mean plasma concentration versus time profile of human subjects is represented in Figure 3. The method was sensitive enough to monitor the tadalafil plasma concentration up to 72 h. The pharmacokinetic parameters obtained from the study are shown in Table 3. The peak plasma concentration (Cmax, mean ± SD) of 319.26 ± 50.28 ng/mL was reached after 2.21 ± 1.05 h. The half-life was 18.51 ± 4.16 h. The area under the plasma concentration-time curve (AUClast) was 6622.09 ± 1320.22 h·ng/mL. The differences in the selected subjected samples for incurred sample reanalysis were within ±15% as shown in Table 4. The results demonstrated that the excellent reproducibility of the proposed method.
Discussion
A UPLC-MS/MS method for the determination of tadalafil in human plasma was developed and validated. Compared with the analytical methods previously reported in the literature, this method represents a simple sample preparation method with protein precipitation by acetonitrile and a short run time of 1.0 min. The method was successfully applied to a pharmacokinetic study of tadalafil in human plasma. This methodology is ideal for high-throughput analyses as well as pharmacokinetic, bioavailability, and bioequivalence studies.
 XML Download