

 PDF
PDF ePub
ePub Citation
 Print
Print


Introduction
Dyslipidemia refers to elevated total or low-density lipoprotein (LDL) cholesterol levels, or reduced high-density lipoprotein (HDL) cholesterol level due to impaired lipoprotein metabolism. According to the guidelines of the Adult Treatment Panel III of the National Cholesterol Education Program and 2013 guidelines of the American College of Cardiology (ACC)/American Heart Association (AHA), decreasing blood LDL cholesterol is key to the management of dyslipidemia.[12] The treatment of dyslipidemia includes therapeutic lifestyle changes, such as weight management, limited intake of saturated fats and cholesterol, and drug therapy. Aggressive actions to reduce LDL cholesterol are recommended for patients at a higher risk of developing cardiovascular disease (CVD).[34]
Statins are currently used as first-line therapy for dyslipidemia because they have clear prognostic benefits, such as decreasing CVD incidence and increasing survival rate by lowering LDL cholesterol, with relatively low side effects.[5] Atorvastatin is a well-known statin that inhibits cholesterol synthesis in the liver by competitively inhibiting 3-hydroxy-3-methylglutaryl coenzyme A reductase.[6] However, additional measures are necessary when aggressive statin therapy does not adequately decrease LDL cholesterol or when statin therapy is discontinued due to side effects. In such cases, the ACC/AHA guidelines recommend the use of a combination of low-dose statin and another non-statin lipid-modifying agent.[2]
Ezetimibe is a lipid-modifying agent that inhibits the absorption of cholesterol present in food or bile by blocking the Niemann-Pick C1-like 1 protein in the villi of the small intestine.[78] A previous study, which investigated patients with CVD or diabetes, found that ezetimibe-statin combination therapy was more effective than monotherapy with a high-dose statin at lowering LDL cholesterol and other lipid parameters.[910] Owing to such synergistic advantages and low side effects, ezetimibe is frequently co-administered with statins in clinical practice. Further, it is necessary to develop a fixed-dose combination to improve medication compliance; however, the pharmacokinetic (PK) drug interaction between atorvastatin and ezetimibe in Korean population has not been evaluated. Therefore, this study was conducted to investigate the PK interaction between atorvastatin 40 mg and ezetimibe 10 mg in healthy Korean volunteers.
Methods
This study was conducted at the Clinical Trials Center, Yonsei University Severance Hospital (Seoul, Korea) in accordance with the Declaration of Helsinki and the guidelines of the Korean Good Clinical Practices after approval of the protocol by the Institutional Review Board of Severance Hospital (approval number: 4-2014-0742). The study was registered at ClinicalTrials.gov with the identifier number NCT02288338. All subjects fully understood the objectives, procedures, risks, and benefits of the study before providing their written informed consents prior to enrollment.
Subjects
Healthy Korean volunteers aged 19–45 years with body mass index (BMI) of 18.5–25 kg/m2 and weight > 55 (for males) or > 50 kg (for females) were screened for enrollment based on medical history, physical examination, and the results of clinical laboratory tests (hematology, blood chemistry, serologic test, urinalysis, and urine drug test). Subjects with a history of gastrointestinal disease or surgery that could affect the absorption of the investigational products (IPs) or those allergic to the IPs were excluded. Additionally, subjects with a history of genetic disorders, such as galactose intolerance or Lapp lactase deficiency, were excluded.
Study Design and Procedures
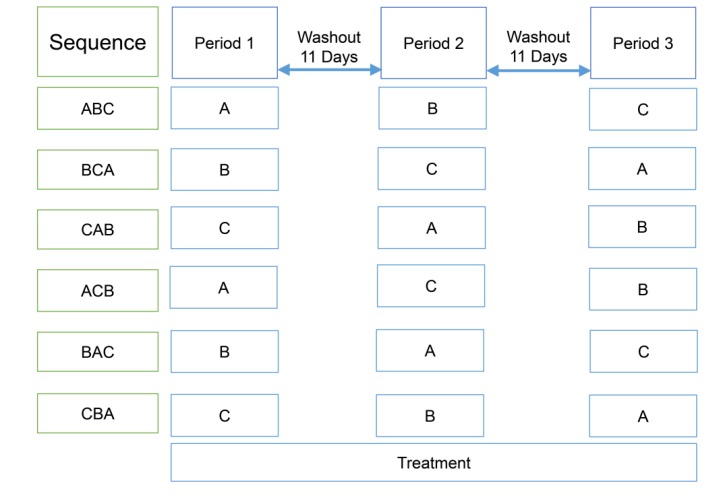
This was a randomized, open-label, multiple-dose, three-treatment, three-period, Williams design crossover study (Fig. 1). The IPs were atorvastatin calcium (40 mg, Lipitor®, Pfizer Korea Ltd.) and ezetimibe (10 mg, Ezetrol®, MSD Korea Ltd.). All subjects were randomly assigned to one of the following six treatment sequences: ABC, ACB, BCA, BAC, CAB, or CBA with an 11-day washout period between treatments A, B, and C. The treatment regimens were once daily administrations of atorvastatin 40 mg (treatment A), ezetimibe 10 mg (treatment B), or co-administration of atorvastatin 40 mg and ezetimibe 10 mg (treatment C) for seven days. The subjects visited the outpatient clinic at 8 am each morning, and were orally administered the assigned IP with 240 mL water at the fasted state for the first six days of each period (D1~D6, D18~D23, and D35~D40). They were hospitalized in the afternoon on the 6th day of each period for intensive PK sampling and safety assessment. After overnight fasting, the 7th dose of the IP was orally administered with 240 mL water; all subjects were prohibited from drinking water for 1 h before and after IP administration. After fasting for 4 h post-dose, a standard meal (700–800 kcal and 5–25% fat) was served to all subjects at 4 and 10 h after dosing.
Blood Sampling and Determination of Drug Concentrations
Serial blood samples were collected in heparinized tubes at 0 (pre-dose), 0.25, 0.5, 0.75, 1.0, 1.25, 1.5, 2, 3, 4, 6, 8, 10, 12, 24, 36, and 48 h after the last IP administration in each period. Blood samples were also collected to estimate trough plasma concentration at 0 h (pre-dose) before the 5th and the 6th doses. For treatment groups B and C, blood samples were additionally collected at 72 and 96 h after the last dosing for the determination of ezetimibe concentrations. The samples were centrifuged (1,800 g, 4℃, 10 min), and the supernatants were separated and stored at −70℃ until the analysis of drug concentrations.
Plasma concentrations of atorvastatin, 2-hydroxyatorvastatin, total ezetimibe (free ezetimibe + ezetimibe-glucuronide), and free ezetimibe were measured by liquid chromatography (Shimadzu Prominence LC, Shimadzu, Kyoto, Japan) coupled with tandem mass spectrometry (API 5000, AB Sciex, Washington D.C., USA) based on validated analytical procedures adopted by the Korean Ministry of Food and Drug Safety. For atorvastatin and its metabolite (2-hydroxyatorvastatin), calibration curves were linear in the range of 0.2–300 ng/mL (correlation coefficient, r>0.9950) with the lower limit of quantification (LLOQ) as 0.2 ng/mL. The assay ranges of free ezetimibe and total ezetimibe were 0.2–200 and 0.5–500 ng/mL, respectively (r>0.9950) with the LLOQ as 0.2 and 0.5 ng/mL, respectively. The accuracy of the assay was within the range of 98.8–103.7% for atorvastatin and its metabolite, 95.0–105.9% for free ezetimibe, and 90.8–100.4% for total ezetimibe; the precision coefficients of variation were <6.9% for all analytes.
Pharmacokinetic Analysis
Non-compartmental analysis was performed using WinNonlin® Version 6.3 (Pharsight, Mountain View, CA, USA) to determine the following PK parameters of atorvastatin, 2-hydroxyatorvastatin, free ezetimibe, and total ezetimibe: the maximum plasma concentration at steady state (Cmax,ss), time to reach Cmax (Tmax,ss), area under the concentration-time curve within a dosing interval at steady state (AUCτ,ss), AUC from dosing time extrapolated to infinity at steady state (AUCinf,ss), terminal elimination half-life (t1/2), apparent clearance (CLss/F), and apparent volume of distribution (Vdss/F). Plasma drug concentration-time profiles are presented in linear and log-transformed scales. Cmax,ss and Tmax,ss were measured, and AUC was calculated by using the linear trapezoidal rule. The t1/2 was calculated from the ratio of the natural logarithm of 2 and terminal elimination rate constant.
Safety Assessment
Safety was evaluated by monitoring adverse events (AEs), vital signs, physical examination, clinical laboratory tests (hematology, blood chemistry, urinalysis), and 12-lead electrocardiogram (ECG) throughout the study. All AEs reported by the subjects or observed by the investigators were recorded and analyzed to facilitate causality assessment.
Statistical Analysis
Descriptive statistics were used to summarize baseline demographics, such as age, weight, height, and BMI. PK parameters and safety profiles were also evaluated using descriptive statistics. All statistical analyses were conducted by using SAS version 9.2 (SAS institute, Inc, Cary, NC, USA). Primary PK endpoints (AUCτ,ss and Cmax,ss) were log-transformed to develop a mixed effects model with period, sequence, and treatment as fixed effects and subjects nested within the sequence as a random effect. Geometric mean ratios (GMRs) with 90% confidence intervals (CIs) of the primary PK parameters between two treatment groups (C vs A, or C vs B) were estimated to evaluate PK drug interactions.
Results
Study Subjects
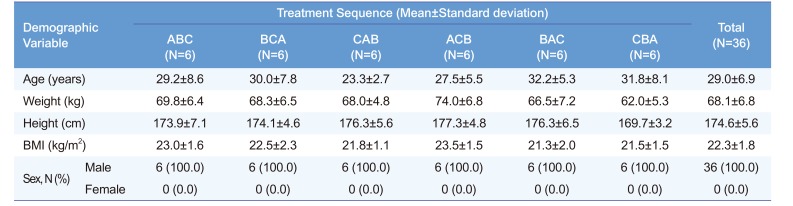
Of the 36 subjects enrolled in this study, 32 subjects completed all procedures and provided blood samples for PK analysis; three subjects discontinued the study in the 1st period, and one subject dropped out in the 3rd period due to personal requests. All enrolled subjects were male. The demographics of the subjects in each treatment sequence are presented in Table 1.
Pharmacokinetics
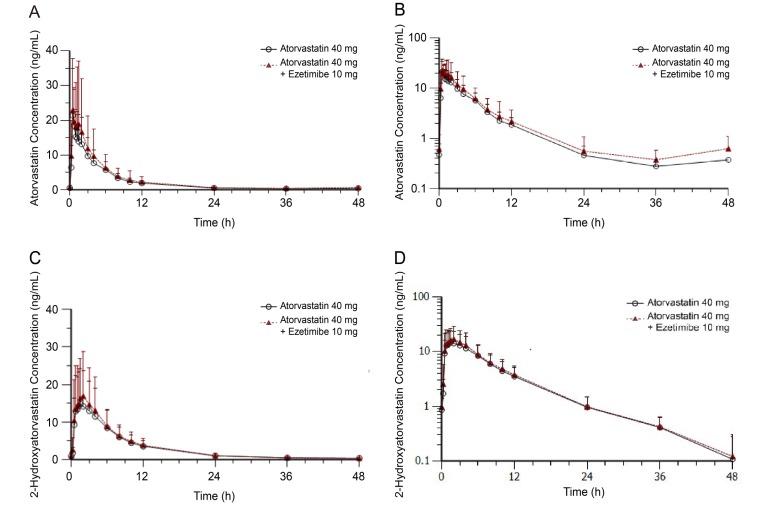
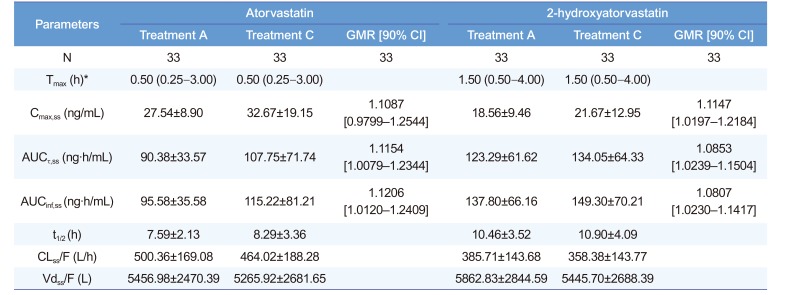
The mean plasma concentration-time profiles of atorvastatin and 2-hydroxyatorvastatin with or without ezetimibe coadministration are shown in Figure 2, and the calculated PK parameters are summarized in Table 2. The PK profiles of atorvastatin and its metabolite with or without ezetimibe co-administration were similar; their exposures, expressed as Cmax,ss and AUCτ,ss, were not significantly different regardless of ezetimibe co-administration. GMRs with 90% CIs of Cmax,ss and AUCτ,ss for atorvastatin when administered with and without ezetimibe were 1.1087 (0.9799–1.2544) and 1.1154 (1.0079–1.2344), respectively. The corresponding values of 2-hydroxyatorvastatin were 1.1147 (1.0197–1.2184) and 1.0853 (1.0239–1.1504).
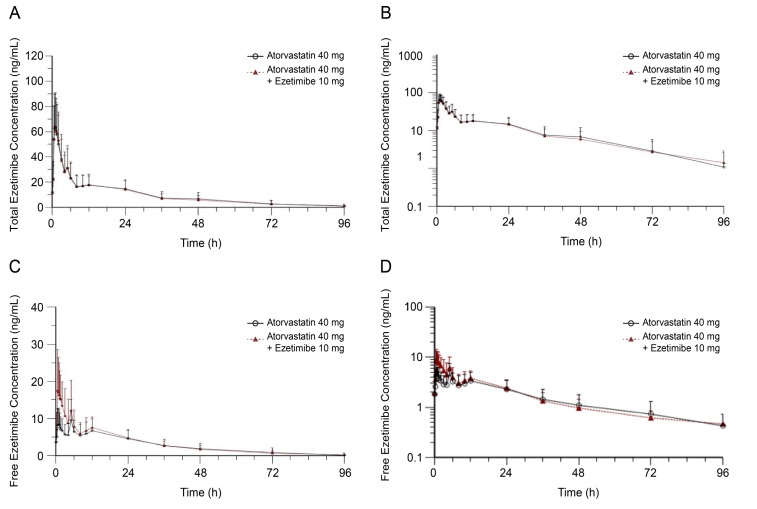
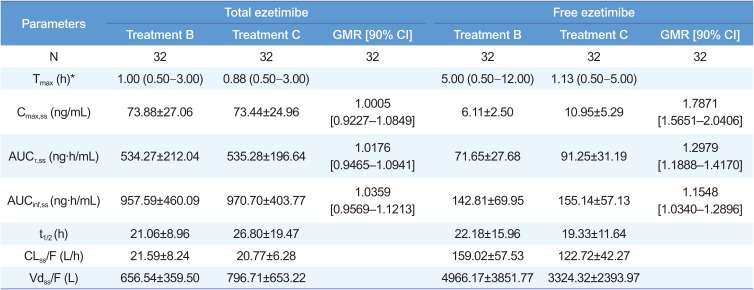
The PK parameters and mean plasma concentration-time profiles of total and free ezetimibe with or without atorvastatin co-administration are presented in Table 3 and Figure 3. The Tmax of co-administered free ezetimibe (with atorvastatin) was shortened for about 4 h compared with that of ezetimibe alone. GMRs (90% CIs) of Cmax,ss and AUCτ,ss for total ezetimibe when it was administered with and without atorvastatin were 1.0005 (0.9227–1.0849) and 1.0176 (0.9465–1.0941), respectively. The corresponding values for free ezetimibe were 1.7871 (1.5651–2.0406) and 1.2979 (1.1888–1.4170), respectively. The 90% CIs for the Cmax,ss and AUCτ,ss of total ezetimibe were within the range of 0.8–1.25 (Table 3).
Safety
In this study, 33 AEs were reported in 19 subjects. All cases were mild (30 events) or moderate (three events) and subjects recovered without complications. Commonly reported AEs were nasopharyngitis (four events) and epistaxis (four events). After causality assessment, 13 AE cases (seven subjects), including four in group A, three in group B, and six in group C, were considered as adverse drug reactions. No clinically significant differences were observed among the treatment groups in terms of vital signs, physical examination, 12-lead ECGs, and clinical laboratory test results.
Discussion
We conducted a Williams design crossover study to evaluate the PK drug interaction between atorvastatin and ezetimibe in healthy Korean volunteers. The results of this study indicated that the concomitant administration of ezetimibe did not significantly affect the PK profile of atorvastatin. Although atorvastatin increased the exposure of free ezetimibe, it did not affect total ezetimibe exposure. The above results are consistent with those of the earlier studies which reported that atorvastatin and ezetimibe have no relevant PK interaction.[1112]
When co-administered with ezetimibe, the upper 90% CI of GMR for the Cmax,ss of atorvastatin slightly deviated from 1.25; however, this was not clinically significant considering that it is a highly variable drug.[13] Atorvastatin is generally metabolized by CYP3A4, and the resulting metabolite undergoes glucuronidation by uridine 5′-diphosphate-glucuronosyltransferase (UGT) 1A1 and 1A3.[6] Similarly, ezetimibe undergoes glucuronidation by UGT1A1, UGT1A3, and UGT2B15. However, the PK characteristics of atorvastatin were not affected because it is metabolized by several enzymes resulting highly variable PK profile.[8]
In this study, the absorption pattern of ezetimibe showed multiple peaks, as was shown in previous reports.[1415] Especially, the second and the third peaks occurred at 5 and 12 h after administration, thereby overlapping with the fed state. This phenomenon is speculated to occur due to a reabsorption process through enterohepatic recirculation, a unique PK characteristic of ezetimibe. As found in previous studies, free ezetimibe exhibited a relatively large inter-individual variability in Cmax with the coefficient of variation in the range of 34–48%.[16] In most subjects, the 2nd peak concentration of free ezetimibe was higher than the 1st peak when ezetimibe administered alone whereas the 1st peak concentration was the highest when co-administered with atorvastatin. This is the reason atorvastatin seemed to shorten the Tmax of free ezetimibe. Considering the complex absorption characteristics of ezetimibe and the limited sample size of this exploratory study design, it may be difficult to ascertain that increased exposure of free ezetimibe has clinical significance in terms of safety and efficacy.
Ezetimibe-glucuronide accounts for 80–90% of total ezetimibe concentration in the plasma, and its cholesterol-lowering effect is about 90% of that of free ezetimibe. Because the 90% CIs of GMRs for the AUCτ,ss and Cmax,ss of total ezetimibe (free ezetimibe + ezetimibe-glucuronide), which are considered primary PK parameters for the evaluation of bioequivalence or PK drug interaction, were in the range of 0.8–1.25, and the two treatment groups showed no significant differences in safety profiles, atorvastatin was considered to have no significant clinical impact on the PK properties of ezetimibe.
Atorvastatin and ezetimibe showed similar PK and safety profiles when administered alone or in combination. Therefore, it can be concluded that the PK interaction between the two drugs is not clinically significant in healthy Korean volunteers.
 XML Download