

 PDF
PDF ePub
ePub Citation
 Print
Print


Introduction
Patients with type 2 diabetes have an increased prevalence of lipid abnormalities, contributing to their high risk of cardiovascular disease (CVD). For the past decade or more, multiple clinical trials demonstrated significant effects of statins on CVD outcomes in subjects with coronary heart disease (CHD) and for primary CVD prevention.[1]
Low levels of high-density lipoprotein (HDL) cholesterol and elevated triglyceride levels are the most prevalent pattern of dyslipidemia in persons with type 2 diabetes.[2] Although the evidence base for drugs that target these lipid fractions is significantly less robust than that for statin therapy, for most patients with diabetes, the first priority of dyslipidemia therapy is to lower low-density lipoprotein (LDL) cholesterol to a target goal of <100 mg/dl.[3] The results of the Collaborative Atorvastatin Diabetes Study (CARDS) showed that atorvastatin 10 mg daily leads to a substantial reduction (37%) in major cardiovascular events in patients with type 2 diabetes with no history of CVD and without high LDL-cholesterol concentrations; this drug also reduced the risk of stroke (48%).[4] The Heart Protection Study (HPS) also provided definitive evidence that cholesterol-lowering with 40mg simvastatin daily can produce substantial reductions in the risk of heart attacks, of strokes, and of revascularizations in people with diabetes.[5]
Metformin is considered the first therapeutic option in patients with type 2 diabetes who are overweight or obese, as it may also prevent some vascular complications and reduced all-cause and cardiovascular mortality compared with sulfonylurea monotherapy among new users of these agents.[67] Among the statins, atorvastatin is the most cost-effective cholesterol-lowering drug.[4] It is reported that improved renal function associated with high-dose atorvastatin reduced hospitalization for heart failure (HF) in the Treating to New Targets (TNT) trial and also atorvastatin may have a beneficial effect on diabetic neuropathy.[89] Furthermore, in the male type 2 diabetic population with a generally high prevalence of dyslipidemia, treatment with both metformin and statin may have a significantly more favorable effect on prostatic cancer incidence than treatment by either medication alone.[10] There was no significant interaction between atorvastatin and metformin.[11] Based on such findings, a fixed-dose combination (FDC) tablet of atorvastatin and metformin sustained-release (SR) was developed for patients with type 2 diabetes with or without dyslipidemia.[12]
The aim of this study was to establish bioequivalence of atorvastatin/metformin SR 20/500 mg FDC tablet (Study 1) and atorvastatin/metformin SR 20/750 mg FDC tablet (Study 2) with the same dosage of individual component (IC) tablets.
Go to : 
Methods
Each study was conducted in accordance with the ethical principles originating in or derived from the Declaration of Helsinki, the guidelines on Good Clinical Practice, and locally applicable laws and regulations. The study protocols, amendments, and the informed consent forms were approved by the Institutional Review Boards of the study site (IRB number: 14-062 and 15-0012). All subjects gave written informed consent prior to commencing the study. The studies were conducted at Clinical Trial Center of Busan Paik Hospital, Busan, Republic of Korea (ClinicalTrials.gov Identifier: NCT02185066 and NCT02378441).
Study Design
Both studies were single-center, randomized, open-label, single-oral dose, two-treatment, two-period, crossover clinical trials enrolling healthy male subjects.
Study 1 was conducted to establish the bioequivalence of atorvastatin/metformin SR 20 mg/500 mg FDC tablet (CJ-30056 20/500 mg; CJ HealthCare Co., Ltd., Korea) to atorvastatin 20 mg (Lipitor® tablet 20 mg; Pfizer Pharmaceutical Korea Ltd., Seoul, Republic of Korea) and metformin extended release 500 mg (Glucophage®XR tablet 500 mg; Merck Ltd. Korea, Seoul, Republic of Korea) administered concurrently as IC tablets. In Study 2, subjects administered each of atorvastatin/metformin SR 20 mg/750 mg FDC tablet (CJ-30056 20/750 mg; CJ HealthCare Co., Ltd., Korea) or atorvastatin 20 mg (Lipitor®; Pfizer Pharmaceutical Korea Ltd., Seoul, Republic of Korea) and metformin prolonged release 750 mg (Glucophage®SR tablet 750 mg; Merck Ltd., Feltham, UK).
A single oral dose of the FDC or IC treatment was administered under fed conditions during each period of the study along with 240 mL of water at ambient temperature, under the supervision of trained study personnel. Although atorvastatin can be administered with or without food, metformin should be taken with meals. Thus each study was conducted under fed conditions; subjects started the a high-fat meal 30 minutes prior to administration of drug. During both the study periods, allocation of subjects to the FDC and IC treatments took place according to the randomization schedule generated by SAS® software (SAS Institute, Cary, NC) using a random element to reduce the bias. The two treatments were separated by a washout period of 7 days. Assuming that intra-individual coefficient of variation of atorvastatin is 31.9% and the true ratio is one, a sample size of 36 subjects was estimated to have at least 80% power to detect bioequivalence based on the criteria of the 90% confidence interval (CI) for the geometric mean ratio (GMR) falling within the acceptance limit of 0.8–1.25.[13] We started each study with 42 subjects, which provided a contingency for patients who might drop out or fail to adhere to both treatments.
Subjects
Forty-two healthy male subjects aged 19–55 years were enrolled in each study. Subjects were eligible to participate if their weight was within 20% of ideal body weight in accordance with Broca's formula. Subjects were considered healthy based on their medical history, physical examinations, 12-lead electrocardiography, and clinical laboratory tests. Subjects with a medical history or diet that might interfere with drug absorption, distribution, metabolism, or excretion were excluded. Subjects were also excluded if any of the following applied: history of allergy or hypersensitivity to investigational products, history of drug and/or alcohol abuse, participation in a clinical trial within 60 days of first administration of the investigational product, donation of blood within 60 days of first administration of the investigational product; use of medication that would affect drug metabolism within 28 days of the first administration of the investigational product, or use of any medication that could affect the study results within 10 days of first administration of the investigational product.
Blood sample collection and bioanalysis
Blood samples for pharmacokinetic (PK) analysis were collected into heparinized vacutainer tube (atorvastatin: 7 mL, metformin: 4 mL). In Study 1, Sampling points for the atorvastatin and 2-OH atorvastatin were: pre-dose (0 hour, just before administration), 0.33, 0.66, 1, 1.5, 2, 3, 4, 5, 6, 8, 12, 24, and 36 hours post-dose. Sampling points for the metformin were: pre-dose (0 hour), 1, 2, 3, 4, 5, 6, 7, 8, 10, 12, 14, and 24 hours post-dose. Based on results from Study 1, sampling points for the atorvastatin and 2-OH atorvastatin were adjusted in Study 2: pre-dose (0 hour, just before administration), 0.5, 1, 1.5, 2, 3, 4, 5, 6, 8, 10, 14, 24, and 32 hours post-dose.
Each blood sample was then centrifuged for 10 min at 2,000 g. The plasma part was transferred into micro-centrifuge vials and stored frozen at −70℃ or less until the PK analysis was made.
Sample preparation was performed by liquid phase extraction for atorvastatin and 2-OH-atorvastatin, and by protein precipitation for metformin. Analyte was detected by validated LC-MS/MS methods.[1415] The lower limit of quantification (LLQ) for the plasma assay was 0.2 ng/mL for atorvastatin and 2-OH atorvastatin and 10 ng/mL for metformin. The linear calibration range was 0.2-100 ng/mL for atorvastatin and 2-OH atorvastatin and 10–3,000 ng/mL for metformin. The overall precision for atorvastatin and 2-OH atorvastatin ranged from 1.4% to 4.7% and 1.4% to 4.0%, respectively. The overall accuracy for atorvastatin and 2-OH atorvastatin ranged from 91.5% to 10.9.5% and 92.3% to 105.2%, respectively. The overall precision and accuracy for metformin ranged from 0.6% to 2.3% and 96.6% to 105.1%, respectively.
Pharmacokinetic assessment
The PK variables for atorvastatin, 2-OH atorvastatin and metformin were assessed by non-compartmental analysis using WinNonlin® (ver 6.1; Pharsight Corp., Cary, NC, USA). The AUC0–t was determined using the linear trapezoidal method up to the last point on the plasma concentration-time curve where the measured plasma concentration was greater than the LLQ. The Cmax and the time to reach Cmax (Tmax) were determined from the plasma concentration-time curve. AUC0–∞ was estimated as the sum of AUC to the last measurable concentration and the extrapolated area given by the quotient of the last measurable concentration and terminal elimination rate constant. Below the LLQ values occurring before Tmax were treated as zero, and those occurring after Tmax were excluded from PK analysis.
Safety assessment
A safety assessment was carried out on all subjects who treated. Any adverse event (AE) was reviewed by integrating data from vital signs, clinical laboratory tests, physical examinations, and patient interviews.
Statistical analysis
PK variables were summarized using descriptive statistics. Log-transformed AUC0–t and Cmax were analyzed using analysis of variance (ANOVA) with period, sequence and treatment as fixed effect and subject within sequence as a random effect. The point estimate and the 90% IC for the FDC-to-IC GMR were estimated for each PK variable after gaining mean squared error from ANOVA. Bioequivalence was established if the 90% CIs for AUC0–t and Cmax for both atorvastatin and metformin were within the interval of 0.8 to 1.25. McNemar test was conducted to compare the percentage of AE between treatment groups. Statistical analysis was performed using SAS® software (ver 9.4; SAS Institute Inc., Cary, NC).
Go to :
Results
Subjects characteristics
A total of 42 subjects were randomized in Study 1; 36 subjects completed the study, and six subjects were discontinued. Reasons for discontinuation were protocol violation (n=2), withdrawal of consent (n=3), and investigator discretion (n=1; not treated). Forty-two subjects were randomized in Study 2; 39 subjects completed the study, and 3 subjects were dropped out due to investigator's discretion (n=1) and withdrawal of consent (n=2).
Mean (SD) age was 24.1(3.19) and 24.0 (2.10) years, and mean (SD) body mass index was 22.2 (2.08) and 22.4 (1.88) kg/m2 in Study 1 and Study 2, respectively. In each study, demographics and baseline characteristics were similar across both sequence groups.
Pharmacokinetics
The plasma concentration versus time profiles obtained for atorvastatin, 2-OH atorvastatin and metformin after administration of the FDC and IC to healthy subjects in two different periods were very similar (Fig. 1 and 2). The PK variables for atorvastatin and metformin are summarized in table 1.
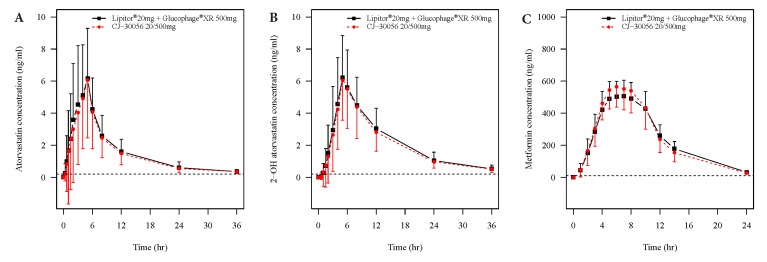 | Figure. 1Mean (±SD) plasma atorvastatin (a), 2-OH atorvastatin (b) and metformin (c) concentration-time proles 3 after a single oral administration of atorvastatin/metformin 20/500 mg given asthe xed-dose combination tablet 4 or individual component tablets under fed conditions in study 1 (n=36). Dashed horizontal lines show the lower 5 limit of quantication (0.2 ng/mL for both atorvastatin and 2-OH atorvastatin; 10 ng/mL fort metformin). Values 6 below the limit of quantication were entered as 0 and included as such in the calculation of means.
|
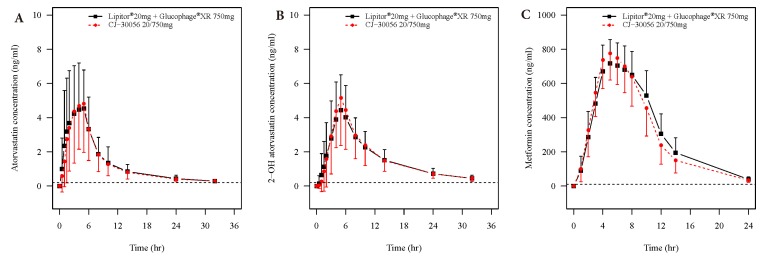 | Figure. 2Mean (±SD) plasma atorvastatin (a), 2-OH atorvastatin (b) and metformin (c) concentration-time proles after a single oral administration of atorvastatin/metformin 20/750 mg given as xed-dose combination tablet or individual component tablets under fed conditions in study 2 (n=39). Dashed horizontal lines show the lower limit of quantication (0.2 ng/mL for both atorvastatin and 2-OH atorvastatin; 10 ng/mL for metformin).
|
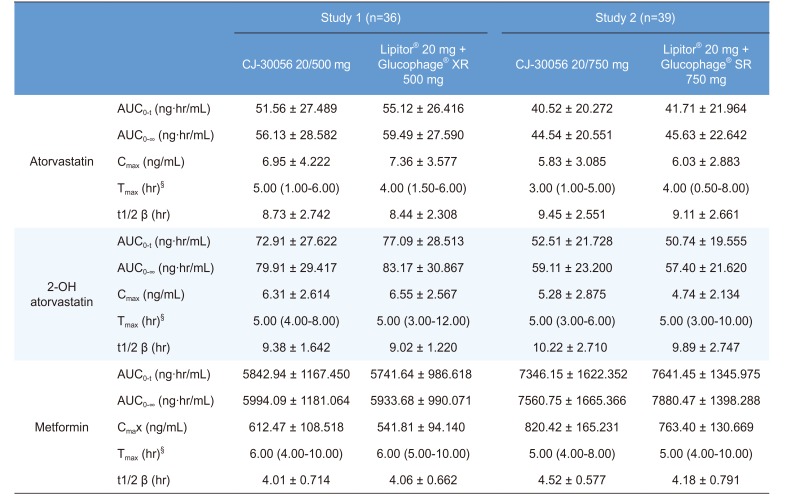
Table 1
Summary statistics of atorvastatin, 2-OH atorvastatin and metformin pharmacokinetic variables following a single oral administration
AUC0–t, area under the plasma concentration-time curve from time 0 to last measurable concentration; AUC0–∞, area under the plasma concentration-time curve from time 0 to infinity; Cmax, maximum plasma concentration; Tmax, time to maximum concentration; t1/2 β, terminal elimination half-life; § values expressed as median (range).
![]()
The Cmax and AUC0–t for atorvastatin and metformin were used to assess bioequivalence between the FDC tablet and IC tablets. In study 1, for atorvastatin the GMRs (90% CIs) for Cmax and AUC0–t were 0.906 (0.818–1.005) and 0.911 (0.856–0.969), respectively. The GMRs (90% CIs) obtained for metformin for Cmax and AUC0–t were 1.130 (1.076–1.187) and 1.010 (0.962–1.060), respectively. In study 2, the GMRs (90% CIs) for atorvastatin for Cmax and AUC0–t were 0.974 (0.873–1.086) and 0.972 (0.915–1.032), respectively. The GMRs (90% CIs) obtained for metformin for Cmax and AUC0–t were 1.068 (1.019–1.119) and 0.955 (0.927–0.983), respectively. The results of the statistical analysis showed that the 90% CIs for atorvastatin and metformin were within the bioequivalence acceptance criteria of 0.8–1.25 (Fig. 3).
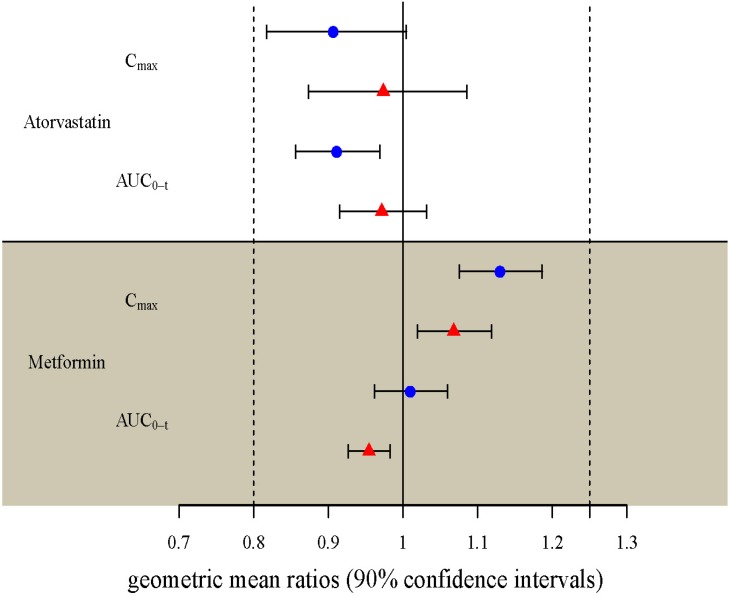 | Figure. 3Geometric mean ratios and 90% confidence intervals for atorvastatin and metformin pharmacokinetic variables. Blue circle, study 1 (atorvastatin/metformin 20/500 mg fixed-dose combination (FDC) tablets versus individual component (IC) tablets); red triangle, study 2 (atorvastatin/metformin 20/750 mg FDC tablets versus IC tablets); AUC0–t, area under the concentration-time curve from time 0 to time of the last measurable concentration; Cmax, maximum plasma concentration.
|
Safety and Tolerability
AE profiles were similar for the FDC and the IC treatment, irrespective of dosage strength (McNemar test; p=0.4795 in study 1 and 1 in study 2). No serious AEs and subject withdrawn due to an AE were reported in both of the studies.
In study 1, three AEs (headache [1], influenza like illness [1] and oropharyngeal pain [1]) were reported for two (4.9%) subjects after administration of the FDC tablet and none after the IC tablets. All AEs were mild in severity and resolved without sequelae. In study 2, two AEs (creatine phosphokinase increased [2]) were reported for two (4.8%) subjects after administration of the FDC tablet and two AEs (creatine phosphokinase increased [1] and headache [1]) for 2 (4.8%) subjects after the IC tablets. All AEs were moderate to severe in severity and resolved without sequelae.
No other clinically significant hematology or biochemistry laboratory abnormalities, vital signs, or electrocardiogram abnormalities were reported in both of the studies.
Go to :
Discussion
The present studies demonstrated that two dosages strengths of the newly developed FDC tablets and corresponding IC tablets have comparable PK characteristics in healthy adult male subjects. Both treatments indicated good tolerance in this population, and no serious AEs were observed.
Active tubular secretion in the kidney is the major route of elimination of metformin, while atorvastatin undergoes extensive first-pass metabolism in the liver and small intestine.[1617] The metabolic pathway of atorvastatin is complex with cytochrome P450 3A4-mediated oxidation, beta-oxidation, lactonization, hydrolysis and intestinal-mediated glucuronidation.[17] About 70% of the circulating lipid lowering activity is attributable to 2-OH atorvastatin, which is equipotent to the parent drug in vitro.[18] If metabolite may be formed as a result of gut wall or pre-systemic metabolism, it is recommended that both the metabolite and the parent drug be measured. PKs of 2-OH atorvastatin were comparable between FDC tablets and IC tablets in these studies, and these findings can be used to provide supportive evidence of comparable therapeutic outcome.
Multiple drug therapy is very common in patients with diabetes. A combined therapy of an anti-hyperglycemic agent and a statin is indicated for the treatment of diabetes patients with a risk of CHD.[45] However, polypharmacy and complexity of treatment regimen are known to be two of the determinants of poor medication compliance in chronic disease management. [19] FDC have been shown to be superior in compliance and the risk of non-compliance to medication regimen is reduced by 24–26% with FDC.[20]
In conclusion, newly developed CJ-30056 20/500 mg and CJ-30056 20/750 mg FDC tablets are expected to be used as alternatives to IC tablets to decrease the pill burden and increase treatment compliance in diabetic patients with a risk of CHD.
Go to :
 XML Download