

 PDF
PDF ePub
ePub Citation
 Print
Print


Introduction
Radotinib (IY5511), developed by Ilyang Pharmaceutical Co., Ltd in Korea, is an oral tyrosine kinase inhibitor and a drug for the treatment of different types of cancer.[1234] It is a BCR-ABL1 tyrosine kinase inhibitor with its chemical structure similar to that of imatinib. Recent clinical trials on the efficacy and safety of radotinib in patients with chronic myelogenous leukemia showed that it is effective and well tolerated, with major and complete cytogenetic response rates comparable to those of nilotinib and dasatinib.[4] However, the analytical method for the pharmacokinetic study of radotinib has not been reported yet.
This study describes the development and validation of an analytical method to determine radotinib levels in human plasma. We used high performance liquid chromatography (HPLC) coupled with triple quadrupole mass spectrometry (MS/MS) for high sensitivity and selectivity. Chromatographic performance was optimized for different mobile solvents of varying polarity, columns, sample solvents, and other conditions. Validation experiments conformed to guidelines of both the United the States Food and Drug Administration (US FDA) and the Ministry of Food and Drug Safety (MFDS).[56] The validated analytical method was further proven to be feasible by applying it to a clinical pharmacokinetic study of orally administered radotinib.
Methods
Reagents and chemicals
Radotinib hydrochloride (IY5511HCL) was obtained from Ilyang Pharmaceutical Co., Ltd (Yongin, Korea). Amlodipine besylate, internal standard (IS), and imatinib, void volume marker, were from Sigma-Aldrich (St. Louis, MO, USA), HPLC-grade acetonitrile, methanol, and methyl tert-butyl ether (MTBE) were obtained from Fisher Scientific (Fair Lawn, NJ, USA). ACS reagent-grade formic acid was purchased from Wako Chemical (Osaka, Japan). De-ionized water (ca. 18 MΩ/cm resistivity) was obtained by using a Milli-Q water purification system (Millipore, Molsheim, France).
HPLC-MS/MS
An HPLC system (Agilent 1200 series, Santa Clara, CA, USA) equipped with an HTS PAL autosampler (CTC Analytics AG, Zwingen, Switzerland) was coupled to a tandem mass spectrometer (API3200; Sciex, Concord, Ontario, Canada). Samples were maintained at 4℃ in the autosampler prior to injection, and the column temperature was maintained at room temperature. Five-microliter samples were injected and separated using an Xbridge C18 column (100 × 2.1 mm, 5 µm; Waters, Milford, MA, USA). A mobile phase of acetonitrile/methanol/water/formic acid (1:6:3:0.01 v/v/v) was filtered through a 0.45-µm membrane filter (Millipore) prior to use. The mobile phase was eluted isocratically at a flow rate of 0.5 mL/min. The eluate was introduced into the mass spectrometer for further analysis.
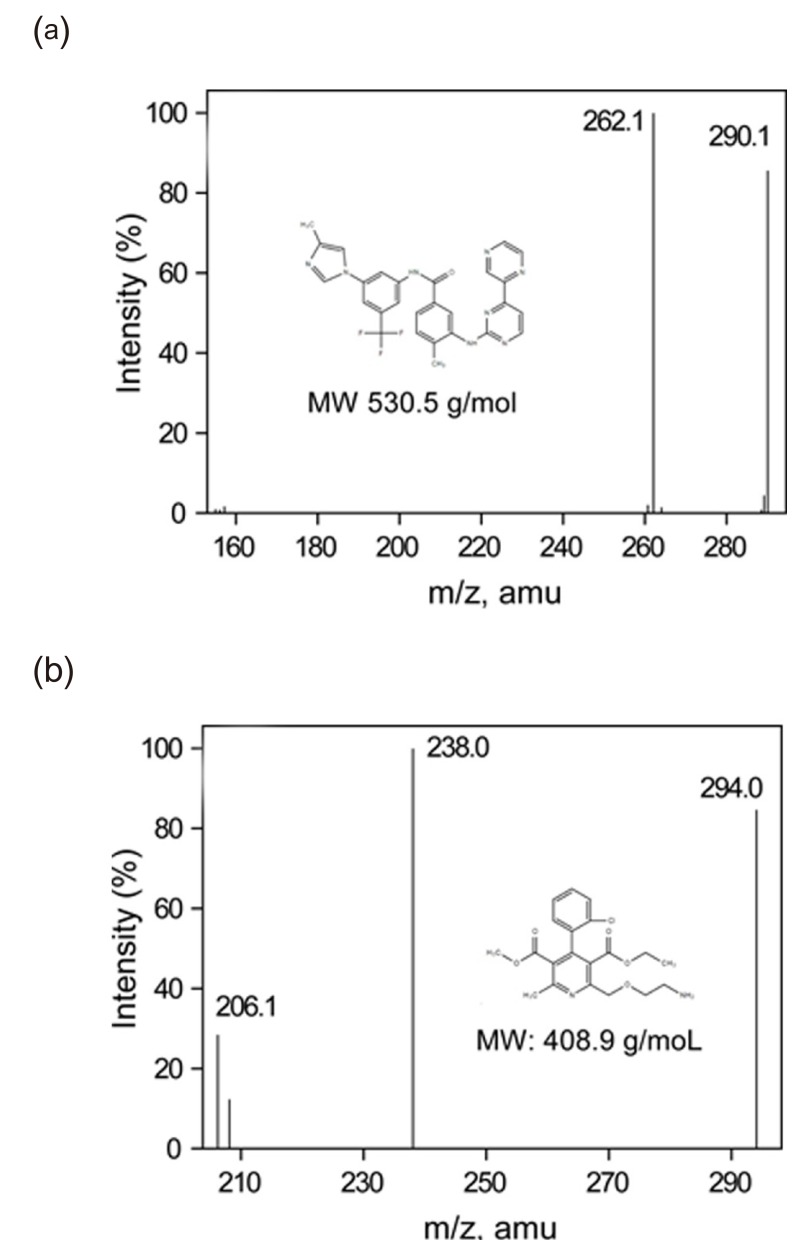
The mass spectrometer was operated in a positive electrospray ionization (ESI) mode. Samples were analyzed using a selected reaction-monitoring mode (SRM), which monitors characteristic precursor-to-product ion transitions in a collision cell. For enough sensitivity and selectivity, we selected the following transitions of protonated molecular ions, [M+H]+: m/z 531 → 290 for radotinib (Fig. 1a), m/z 409 → 238 for amlodipine (Fig. 1b), and m/z 494 → 394 for imatinib. The ion source parameters were as follows: curtain gas, 12 psi; collision gas, 5 psi; ion spray voltage, 5.5 kV; nebulizer gas, 50 psi; collision gas, 50 psi; temperature, 500℃. Analyst 1.4.2 software package (Sciex) was used for instrument control as well as data acquisition and pro-cessing.
Preparation of standards and quality controls
Radotinib HCl crystalline powder is yellow in color and sensitive to light. It was stored in a tight, light-resistant container in a refrigerator. The primary stock solutions of radotinib (500 µg/mL) and amlodipine (980 µg/mL) were parepared in aceto-nitrile/water/formic acid (6:4:0.01 v/v/v) and methanol/water (50:50 v/v), respectively, stored at −20℃, and protected from light until use. Radotinib working solutions were prepared at concentrations of 0.25, 0.5, 2.5, 5, 25, 50, and 150 µg/mL by serial dilution of the primary stock solutions with acetonitrile/water/formic acid (4:6:0.01 v/v/v). An IS working solution (6 µg/mL) was prepared in methanol/water (50:50 v/v) from its stock solution. Pooled blank plasma (980 µL) was spiked with each working solution (20 µL) to prepare the calibration standards of 5, 10, 50, 100, 500, 1,000, and 3,000 ng/mL. Quality control (QC) samples were prepared at four concentration levels: 5, 15, 800, and 2400 ng/mL representing the lower limit of quantification (LLOQ), low, medium, and high QCs, respectively. The calibration standards were prepared fresh on the day of analysis, and the QC samples were stored at −70℃ and thawed prior to use.
Plasma sample preparation
Blood samples were collected in tubes containing sodium heparin before and after IY5511HCL administration. Plasma samples were immediately separated from the blood in a refrigerated centrifuge (3,000 rpm, 10 min, 4℃) and stored at −70℃ until subsequent analysis. For plasma processing, the plasma samples were allowed to thaw gradually to room temperature. An aliquot (100 µL) of the plasma sample was transferred to a polypropylene tube which contains 50 µL of the IS working solution (6 µg/mL). After the tube was briefly vortexed, 1.5 mL of MTBE was added. This mixture was vortexed for 5 min and then centrifuged at 14,000 rpm for 10 min at 4℃. The supernatant was transferred to a clean tube and evaporated to dryness in a SpeedVac concentrator (SPD2010, Thermo Fisher Scientific, Waltham, MA, USA) for approximately 50 min. The dry residue was reconstituted in 500 µL of acetonitrile/water/formic acid (4:6:0.01 v/v/v), and vortexed for 3 min, and centrifuged at 14,000 rpm for 10 min at 4℃. The supernatant (200 µL) was then transferred to an HPLC vial for further HPLC-MS/MS analysis.
Selectivity
We evaluated the selectivity of the method by analyzing drug-free plasma samples from six different individuals. We examined any interference at the LC retention times of radotinib and IS by comparing the chromatograms of a double blank, plasma sample without radotinib and IS, with those of blank plasma samples spiked with radotinib at LLOQ (5 ng/mL) and IS (6 µg/mL).
Linearity and sensitivity
Calibration curves were obtained by plotting the peak area ratio of radotinib to IS vs. the nominal radotinib in the concentration range of 5–3,000 ng/mL. A weighted (1/x) least-squares regression was used to evaluate its linearity. Sensitivity is represented by the LLOQ, which is considered being the lowest calibration standard. The analyte signal of the LLOQ sample should be at least ten times as large as the signal of a blank sample when carryover effects are considered.
Accuracy and precision
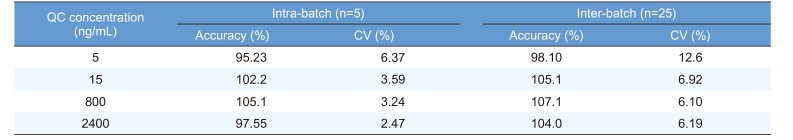
The intra-day accuracy and precision were assessed by analyzing five replicates of each QC sample (5, 15, 800, and 2,400 ng/mL) on the same day. The inter-day accuracy and precision were determined by analyzing the QC samples on five different days. The accuracy was calculated as (measured concentration/nominal concentration)×100%, and the precision was expressed as the percentage coefficient of variation (%CV). Acceptable accuracy and precision for all concentration levels were set within ±15% deviation, except at the LLOQ concentration level (within ±20%).
Recovery
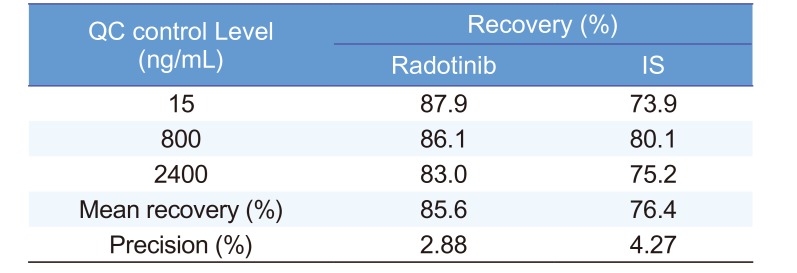
Radotinib recovery was assessed in quadruplicates at three concentrations (15, 800, and 2,400 ng/mL). Absolute recovery was determined by comparing radotinib peak area obtained from a plasma sample spiked before the extraction with that from a standard sample spiked after the extraction at equal concentration level. IS recovery was determined at a single concentration (6 µg/mL) level in a similar manner.
Stability experiments
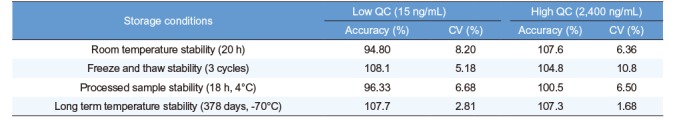
Stability was measured at the low (15 ng/mL) and high (2,400 ng/mL) QC concentrations in quadruplicate. We tested four stability conditions: processed sample stability at 4℃ for 18 h, freeze/thaw stability for three cycles, short-term stability at room temperature for 20 h, and long-term stability at −70℃ for up to 378 days. We also evaluated the stability of primary stock solutions for up to 67 days of storage at −20℃.
Results
Selection of internal standard
Clinical trials of radotinib were planned for patients with chronic myelogenous leukemia who did not respond to targeted anticancer drugs. When selecting an internal standard, imatinib, nilotinib, and dasatinib were avoided because they might be present in patients and might be a potential source of interference. We choseamlodipine as an internal standard due to its similarity to radotinib (Fig. 2).
Sample preparation
When analyzing drug concentration in serum or plasma, protein removal is crucial to improve reproducibility and sensitivity in analysis and to protect HPLC columns.[7] We applied different protein precipitation/extraction methods using methanol, acetonitrile, and methyl tert-butyl ether (MTBE) as a precipitation/extraction solvent. Methanol and acetonitrile had effectively removed most of plasma proteins. However, the processed samples showed peak broadening and chemical interference partly due to carryover effect in their chromatograms. The MTBE-based liquid-liquid extraction method used in our study extensively removed unwanted matrix components as well as most of proteins and provided stable background and acceptable extraction recovery.
HPLC-MS/MS method development
Mobile phase composition and sample solvent are also critical factors for the successful separation. To optimize the mobile phase composition, we started with a mixture of water and acetonitrile. Tailing or splitting of peaks occurred with the increase of acetonitrile proportion. Meanwhile, the increase in methanol proportion resulted in longer retention times and peak tailing. Thus, we combined acetonitrile and methanol with water to achieve best chromatographic performance. Then, 0.1% formic acid was added to adjust pH. In addition, the type of solvent used for sample reconstitution affected peak symmetry and re-producibility. We used acetonitrile/water/formic acid (4:6:0.01 v/v/v) as a sample reconstitution solvent.
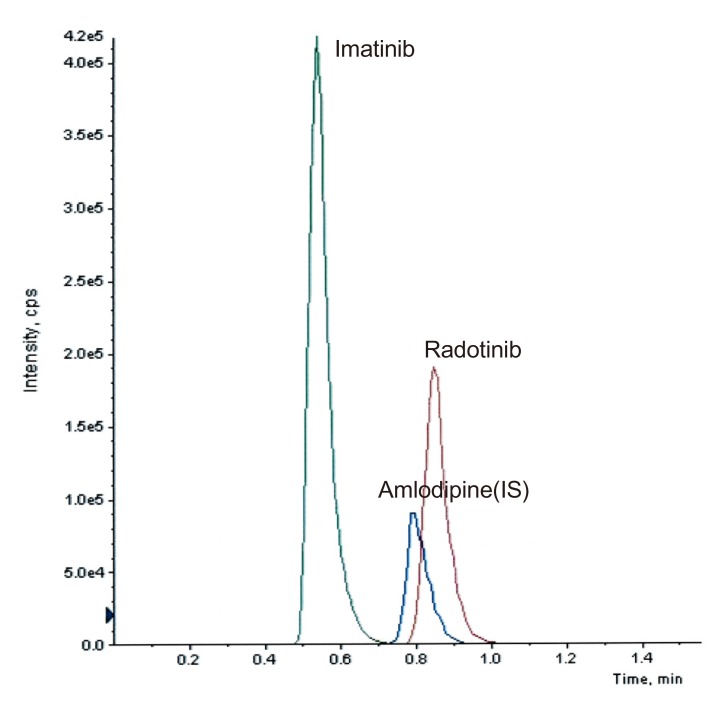
The void volume of a column can cause serious problems such as peak distortion and splitting. To confirm that none of the analytes elute in the void volume, imatinib, one of highly polar compounds, was used as a void volume marker. Figure 2 shows the SRM chromatograms of imatinib, radotinib, and IS. While imatinib was eluted at 0.54 min, radotinib and IS were eluted at 0.85 and 0.80 min, respectively, with good peak symmetry. The capacity factors of radotinib and IS were 0.57 and 0.48, respectively.
Method validation
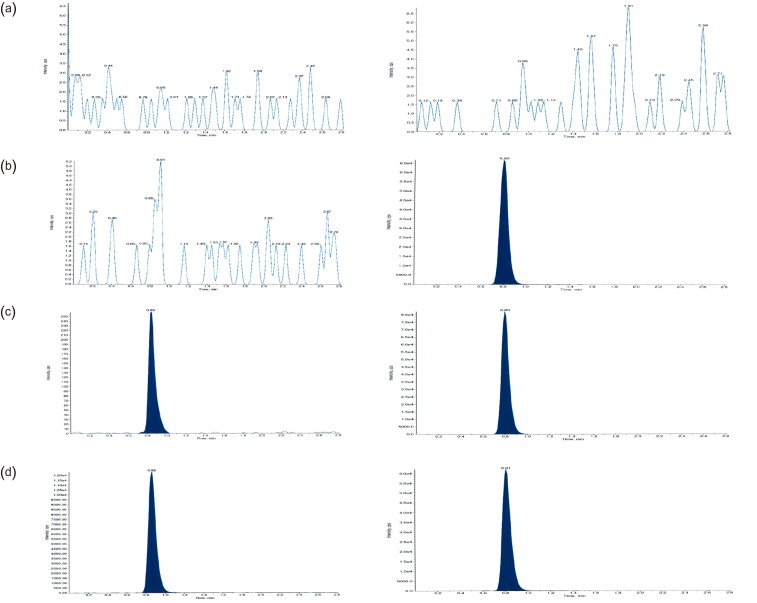
In HPLC analysis, it is important to obtain optimum resolution in minimum time. Because the resolution is affected by selectivity, we first studied the selectivity using drug-free plasma samples taken from at least six different subjects. Figure 3 shows that interfering endogenous peaks are not present at the measured mass transitions and retention times of radotinib and IS. This ensures that our HPLC-MS/MS method was highly selective and suitable for further analysis. The calibration curves were linear over the concentration range of 5–3,000 ng/mL with a correlation coefficient (r) of 0.998 or higher. The measured LLOQ was 5 ng/mL. This sensitivity was sufficient to determine radotinib levels in human plasma samples collected in pharmacokinetic studies. Table 1 presents the intra- and inter-day precision and accuracy at four QC levels (5, 15, 800, and 2,400 ng/mL). The intra- and inter-day accuracy values (%) ranged from 95.23% to 105.1% and from 98.10% to 107.1%, respectively. The intra- and inter-day precision values (%CV) for all QC samples were within 6.37 and 12.6%, respectively. Thus, all QC samples met the currently accepted criteria of ±20% precision and accuracy at the LLOQ concentration level and ±15% for higher concentrations. As summarized in Table 2, the mean percent recovery rates of radotinib and IS were 85.6, and 76.4%, respectively, for the plasma samples (n = 5) at concentrations of 15, 800, and 2,400 ng/mL. Their %CVs were less than 5% and within the allowable variation of ±15% at all levels.
To investigate the stability during sample preparation procedures, storage, and after sample extraction, we used the QC plasma samples at two concentrations (15 and 2,400 ng/mL). Table 3 summarizes the results from stability tests. Radotinib in plasma was stable for up to 378 days at −70℃. Radotinib levels in human plasma varied only slightly as shown in Table 3. This indicates adequate sample stability under the tested conditions. We also performed the tests for matrix effect, short- and long-term stability of primary stock solution, and dilution integrity. The results met the validation acceptance criteria established by both the US FDA and the MFDS (data not shown here).[56]
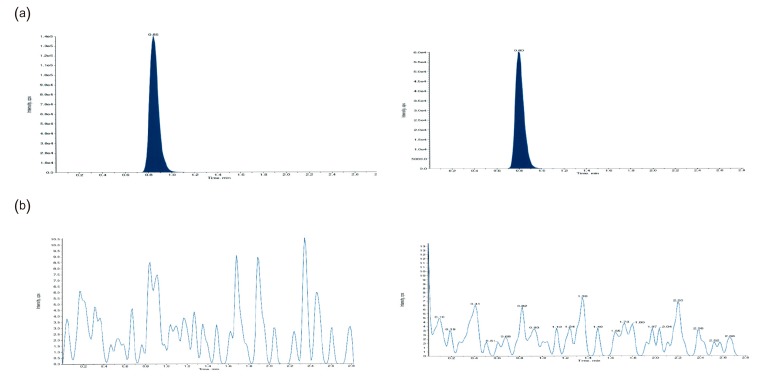
Carryover is the appearance of a previously injected analyte in a subsequent run.[8] This can be evaluated when a blank is injected immediately after the analysis of the upper limit of quantification (ULOQ) sample, and acceptable if the area of a carryover peak is less than 20% of the area of peak at LLOQ. [56] Carryover problems were encountered during the method development. However, it was solved by frequent injector/syringe washing using acetonitrile/water/formic acid (4:6:0.01 v/v/v) and acetonitrile/methanol/water/isopropanol (4:4:1.5:0.5 v/v/v/v)] as weak and strong solvents. To test for the overall significance of carryover effects (Fig. 4), a blank plasma sample was analyzed right after the analysis of a spiked sample (3,000 ng/mL). We could not find any carryover peak distinguishable from long-term baseline noise (Fig. 4b).
Pharmacokinetic application
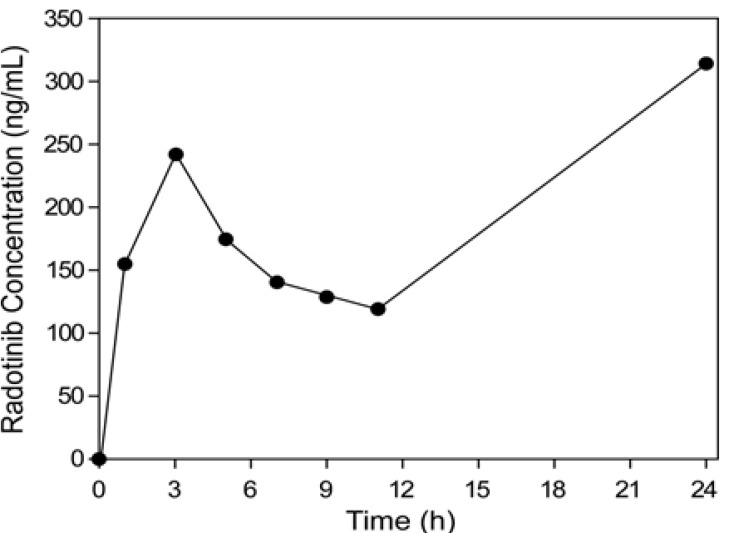
Even though phase 1 and 2 clinical trials for radotinib were performed, its pharmacokinetics were not reported.[134] Our analytical method was used to measure plasma concentrations of radotinib in its phase 1 and 2 clinical trials. Briefly, the radotinib concentrations in plasma were higher than LLOQ and quantifiable at all the time points. Figure 3d shows typical SRM chromatogram of radotinib and IS for a plasma sample taken from a patient three hours after oral administration of a 400-mg radotinib and spiked with IS. Because of high specificity of MS/MS detection, we could not find any interference which may be caused by drug metabolites or any reaction product produced after drug administration in the chromatogram. Figure 5 shows a representative plasma concentration-time profile of radotinib after administration of 400-mg radotinib two times a day. The peak plasma concentration (Cmax) was approximately 150–250 ng/mL and the mean trough concentration (Cmin) after 11 hours was approximately 100 ng/mL.
Discussion
We developed an analytical method for the determination of radotinib levels in human plasma using HPLC-MS/MS. The method was validated over the concentration range from 5 to 3,000 ng/mL of radotinib with respect to selectivity, linearity, sensitivity, accuracy, precision, recovery, and stability. All results met the validation criteria of acceptance. This method could be successfully applied to a clinical pharmacokinetic study of radotinib.
 XML Download