Abstract
REFERENCES
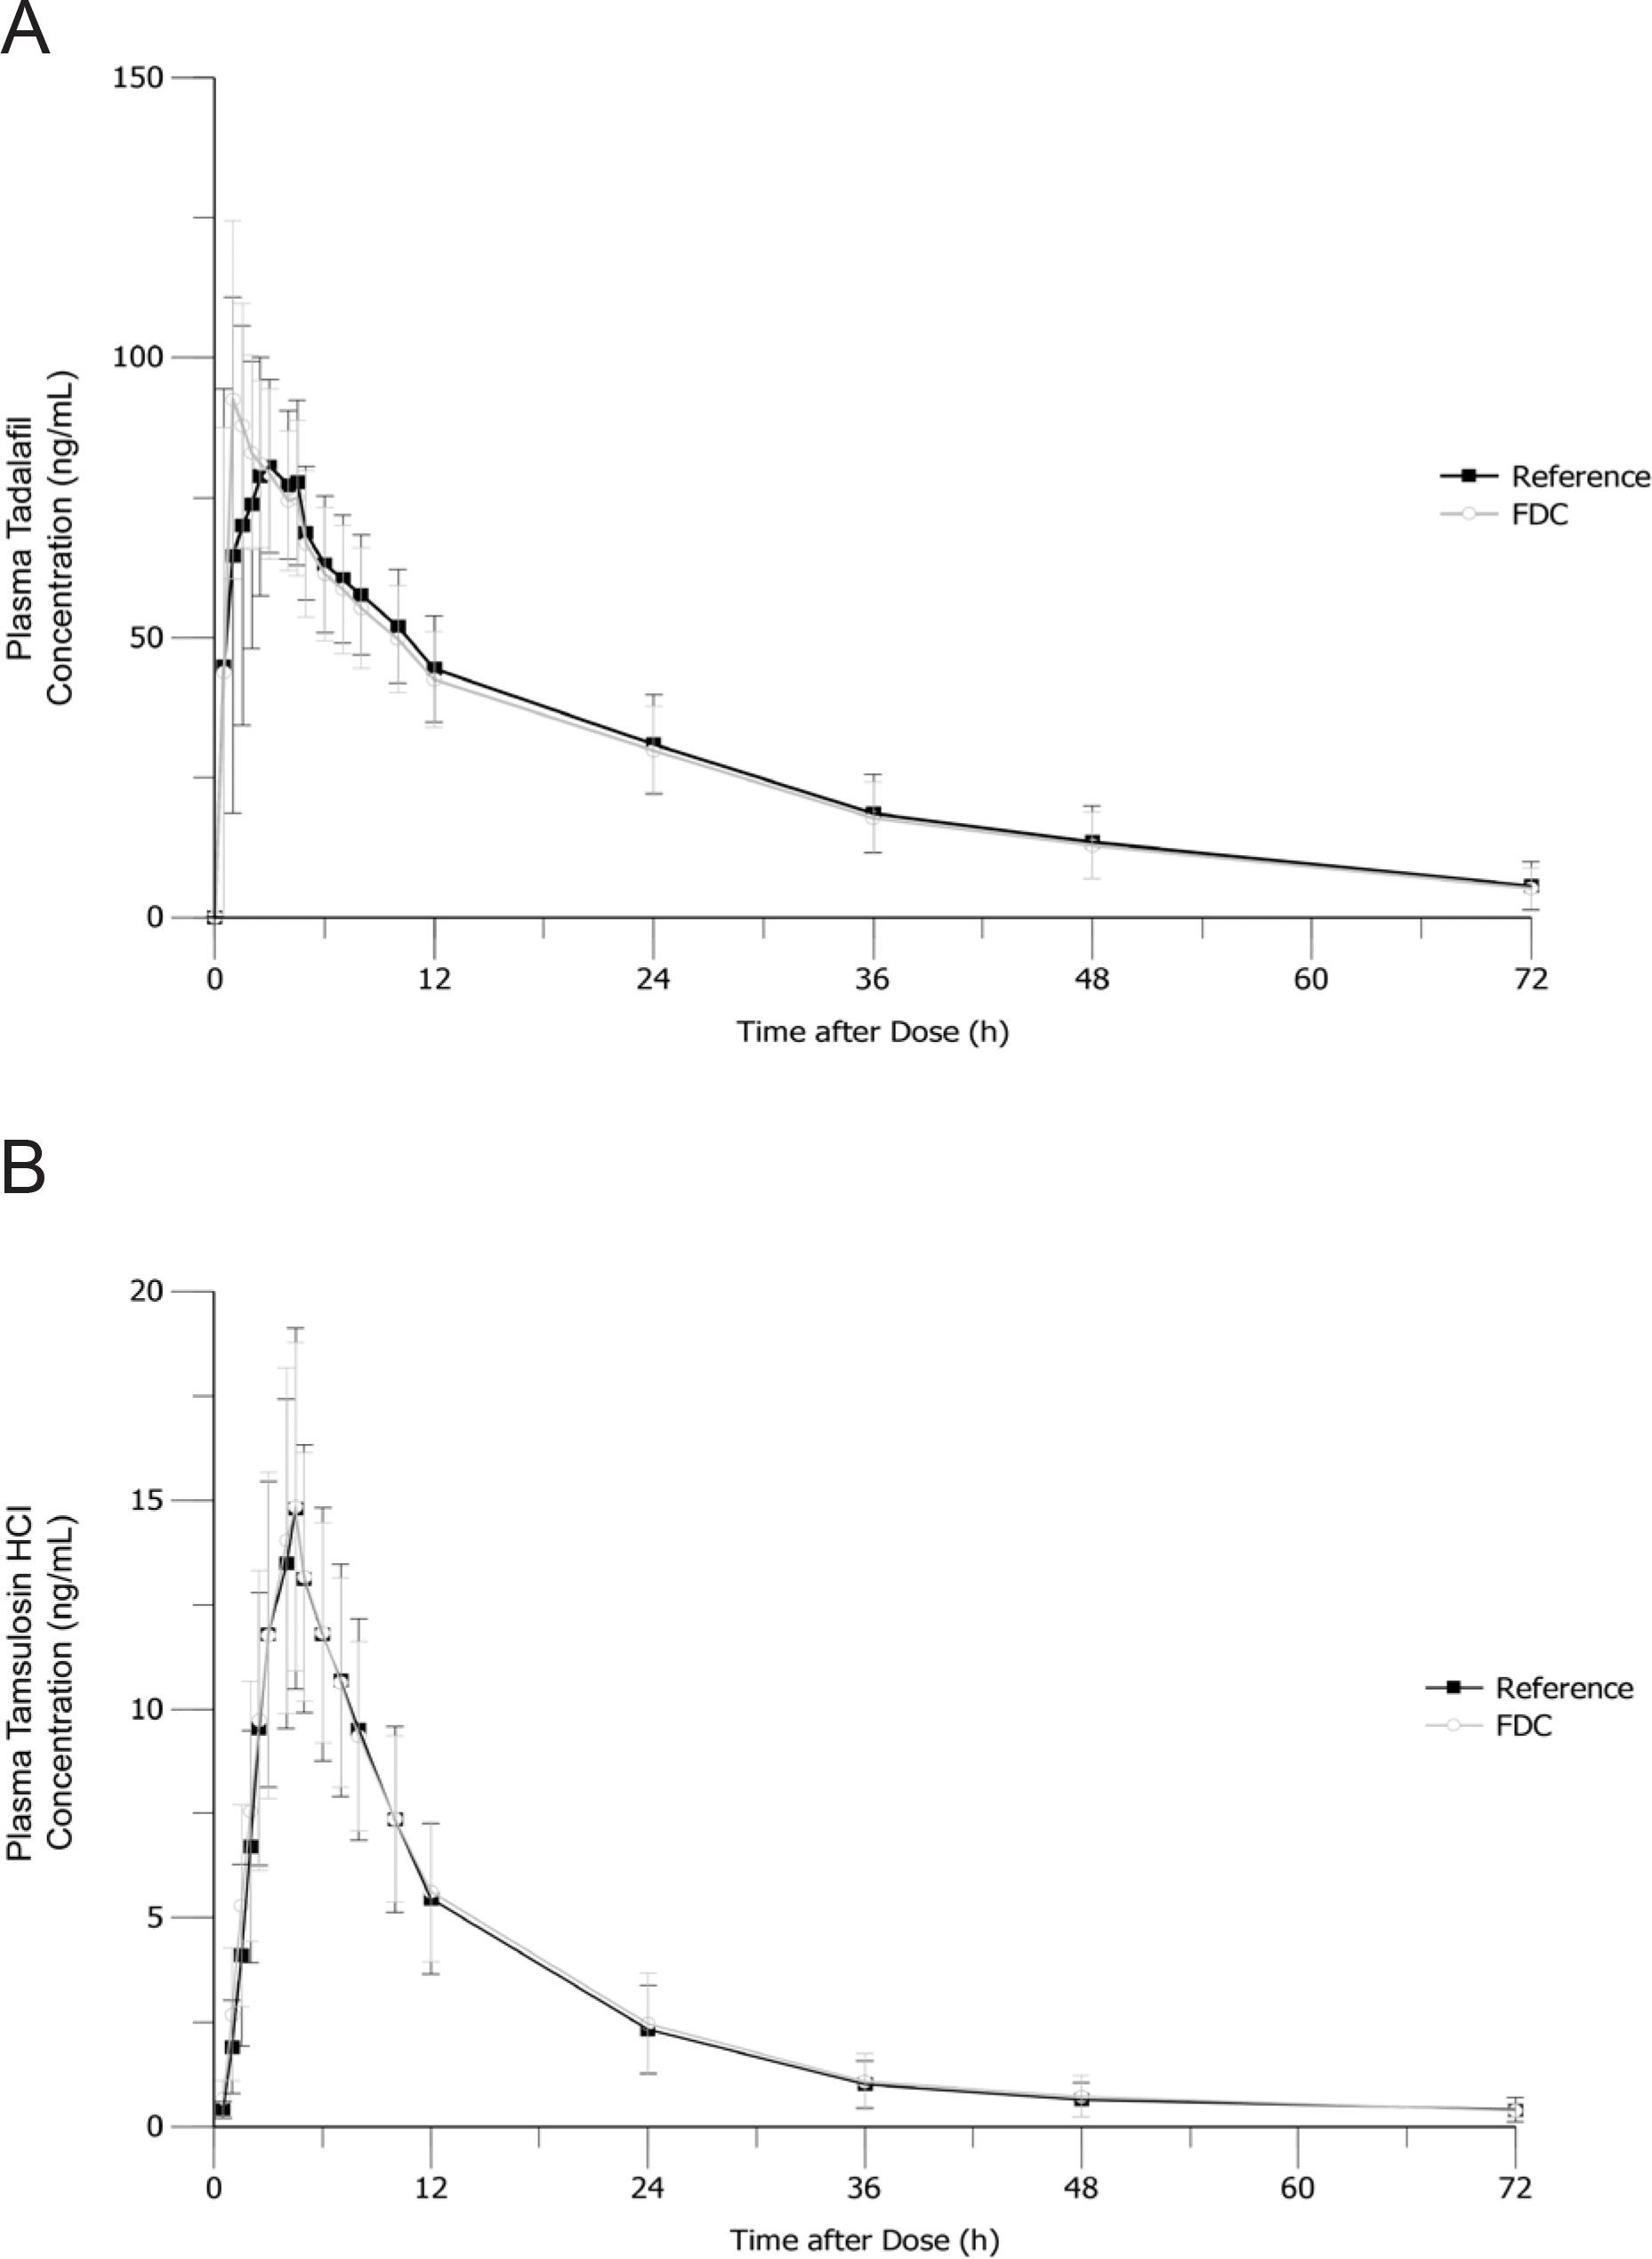
Figure 1.

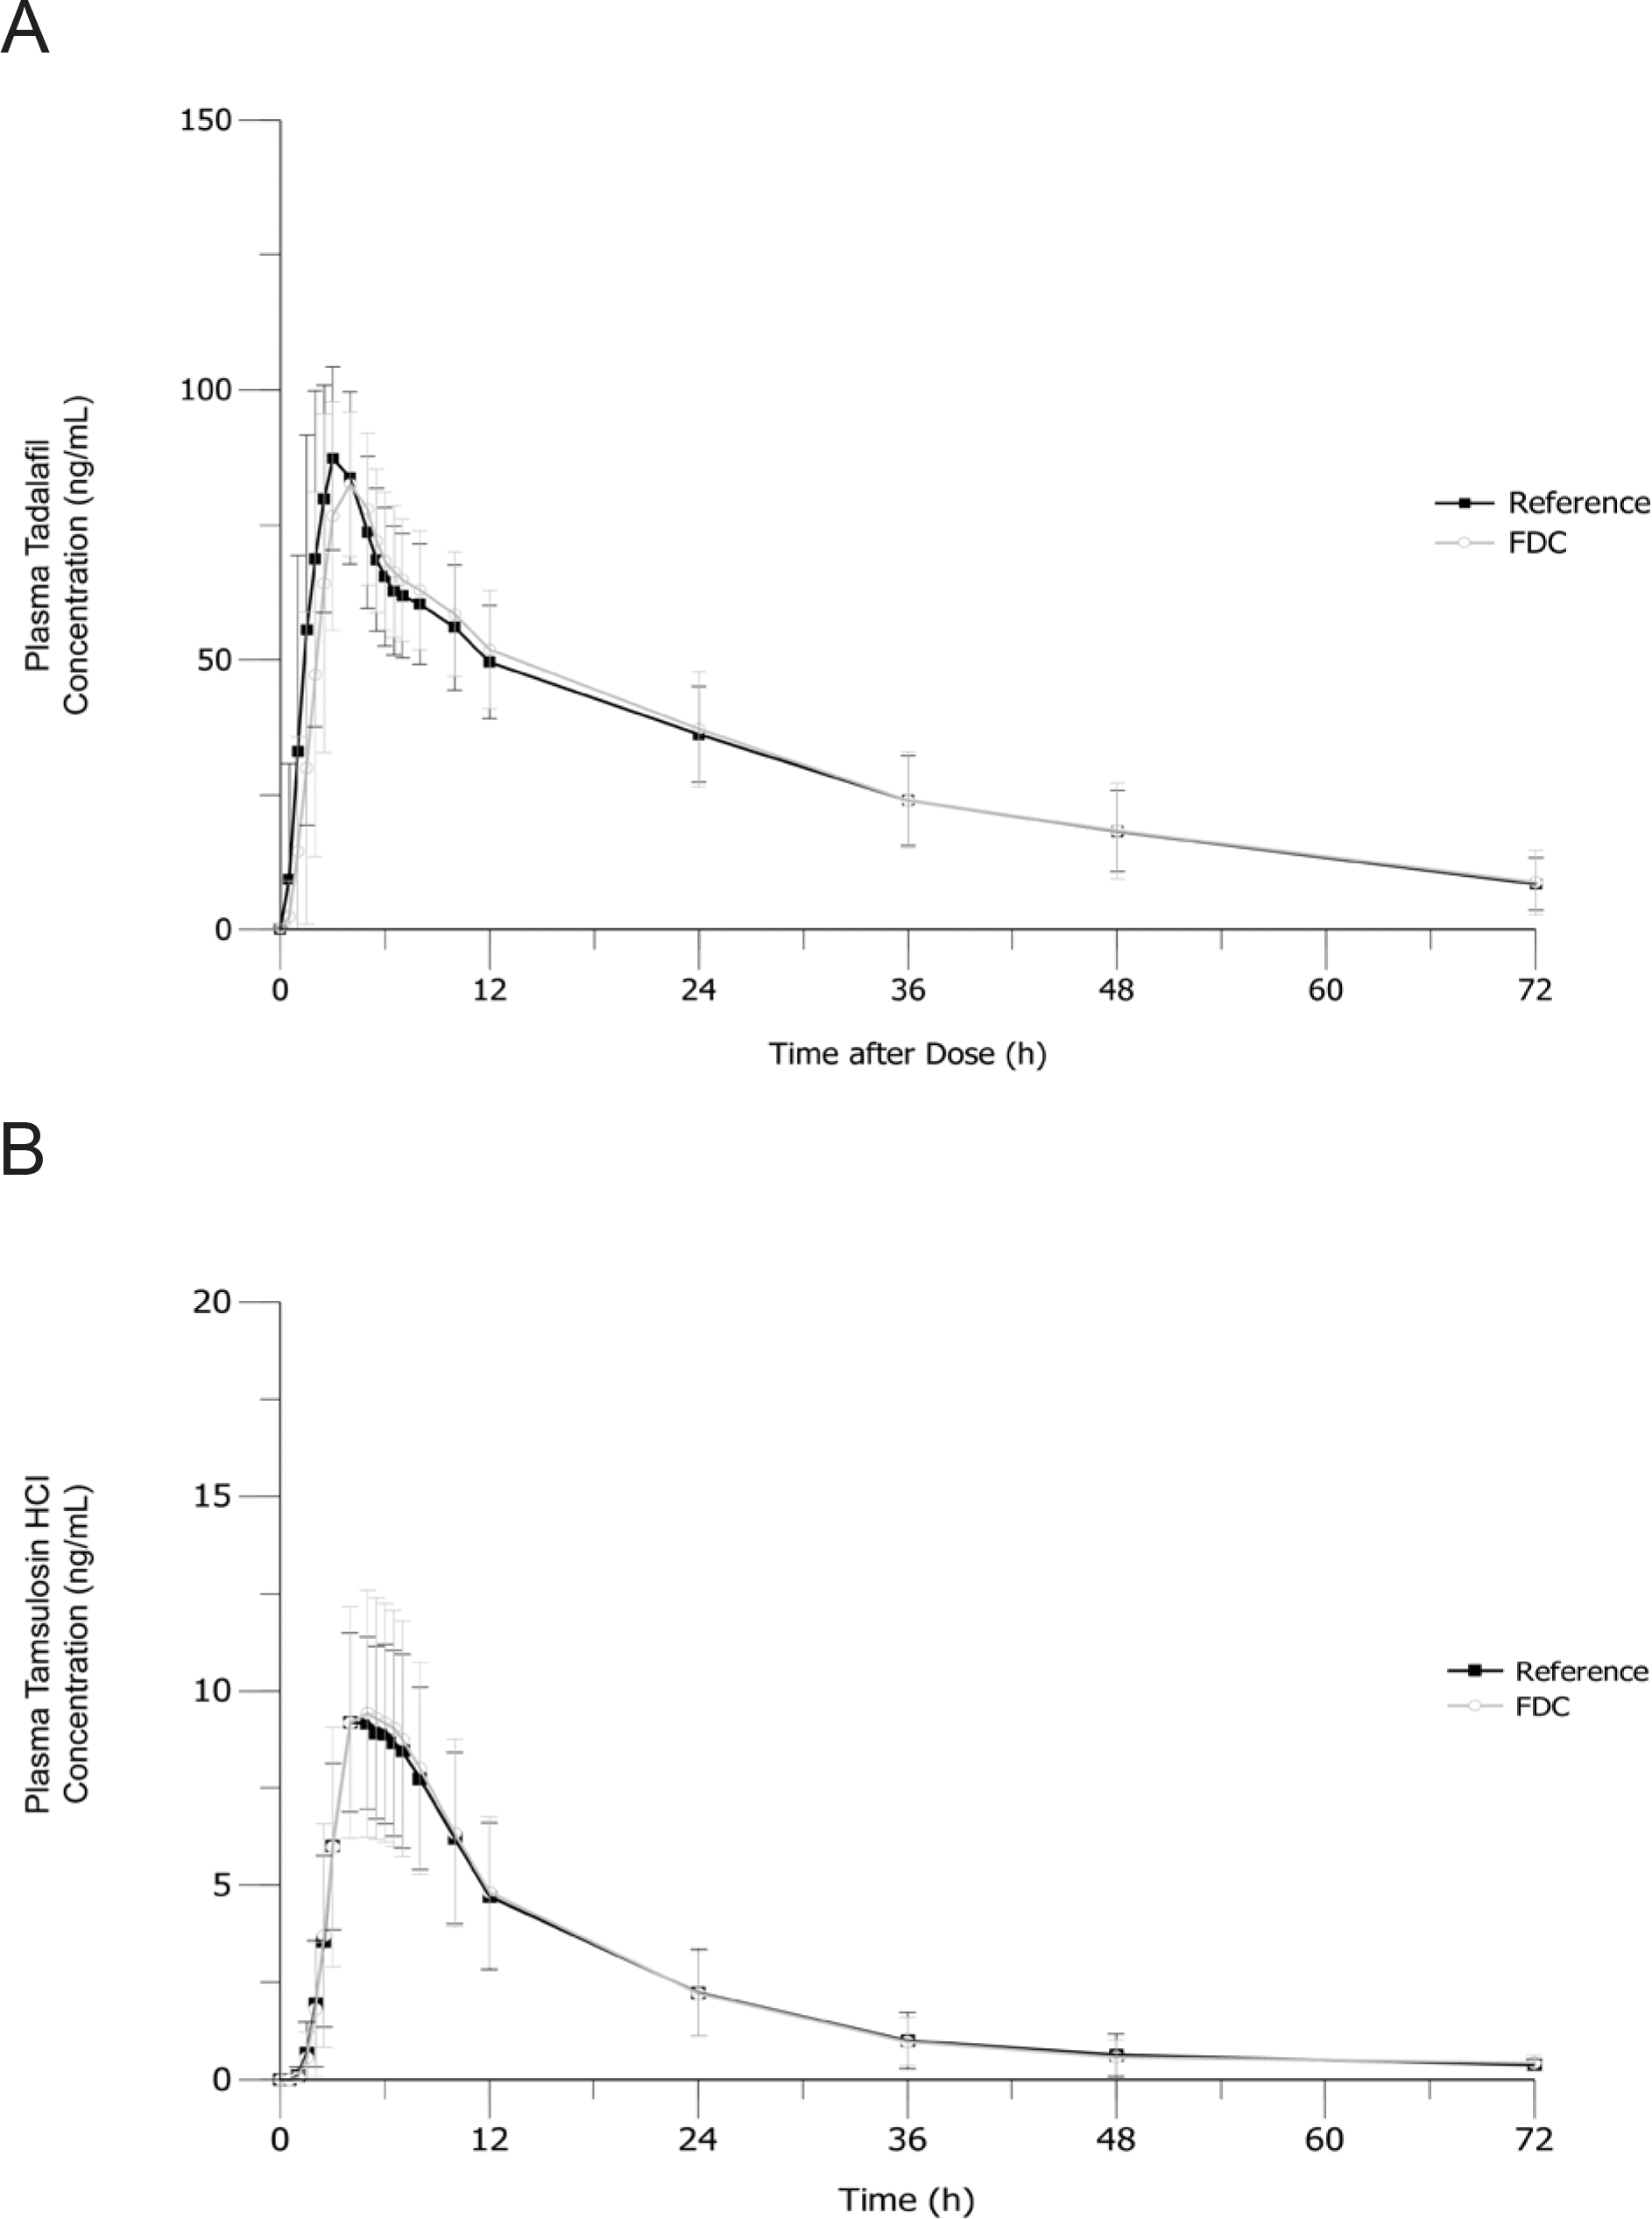
Figure 2.

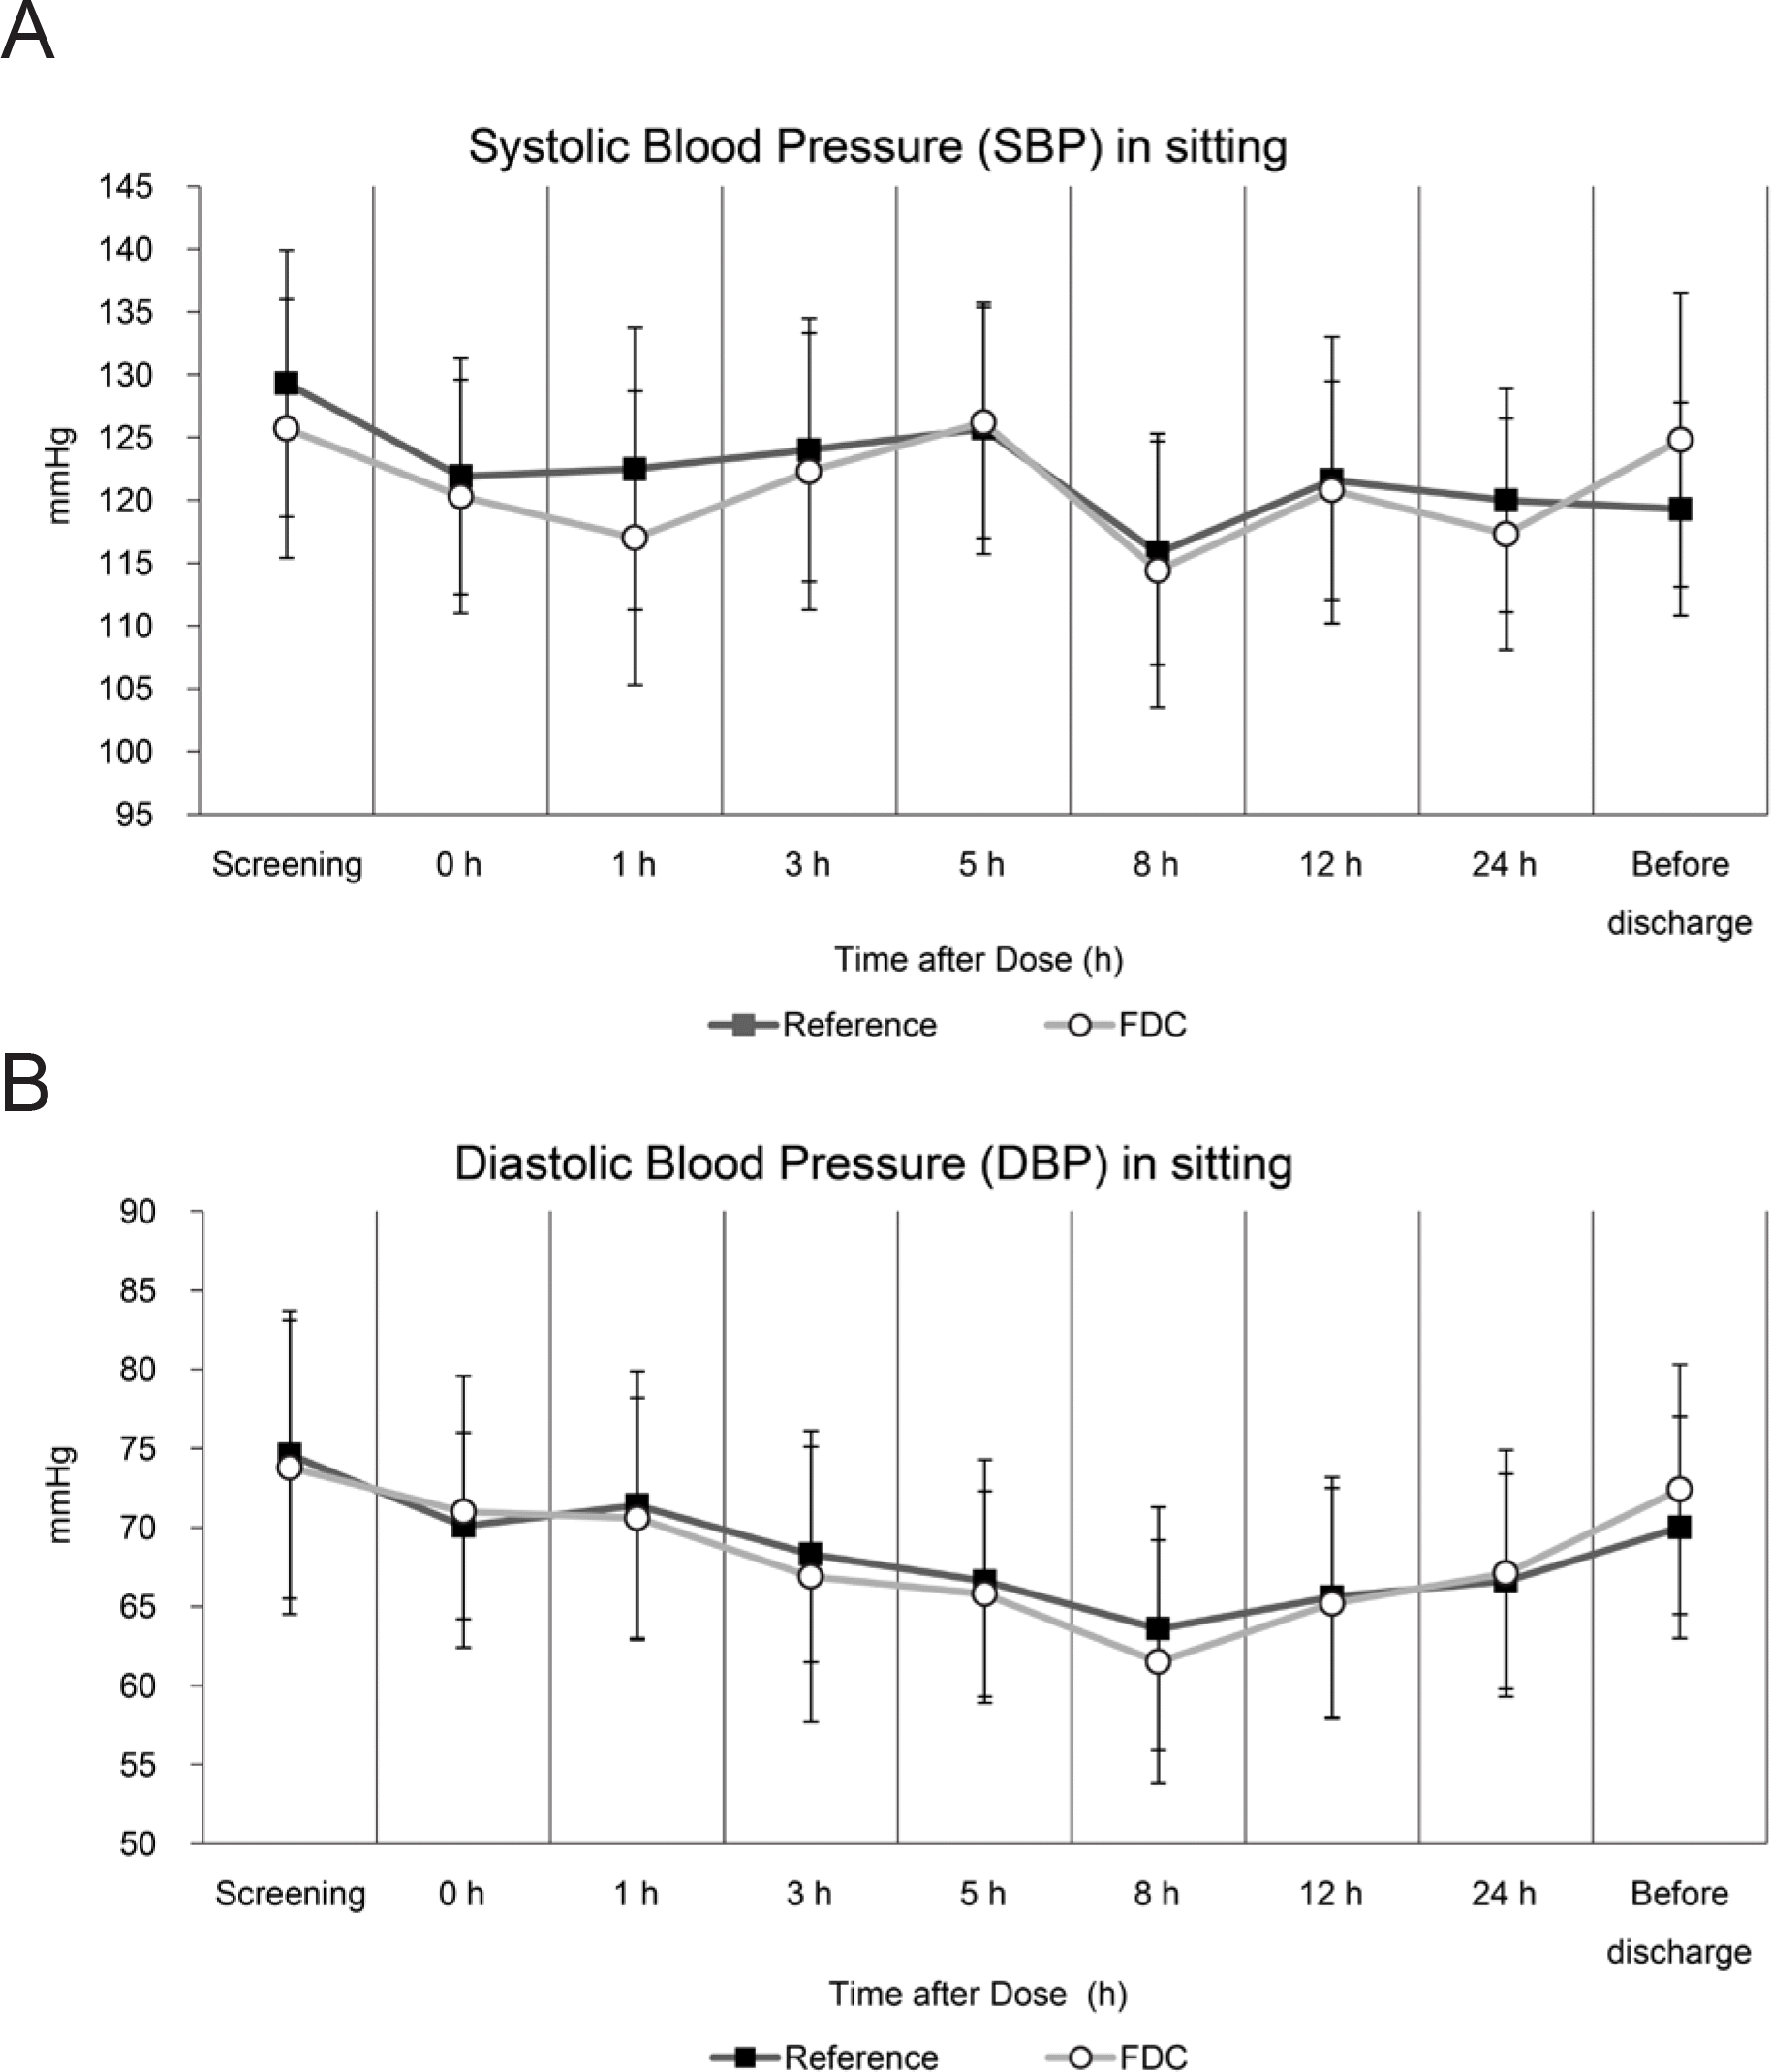
Figure 3.

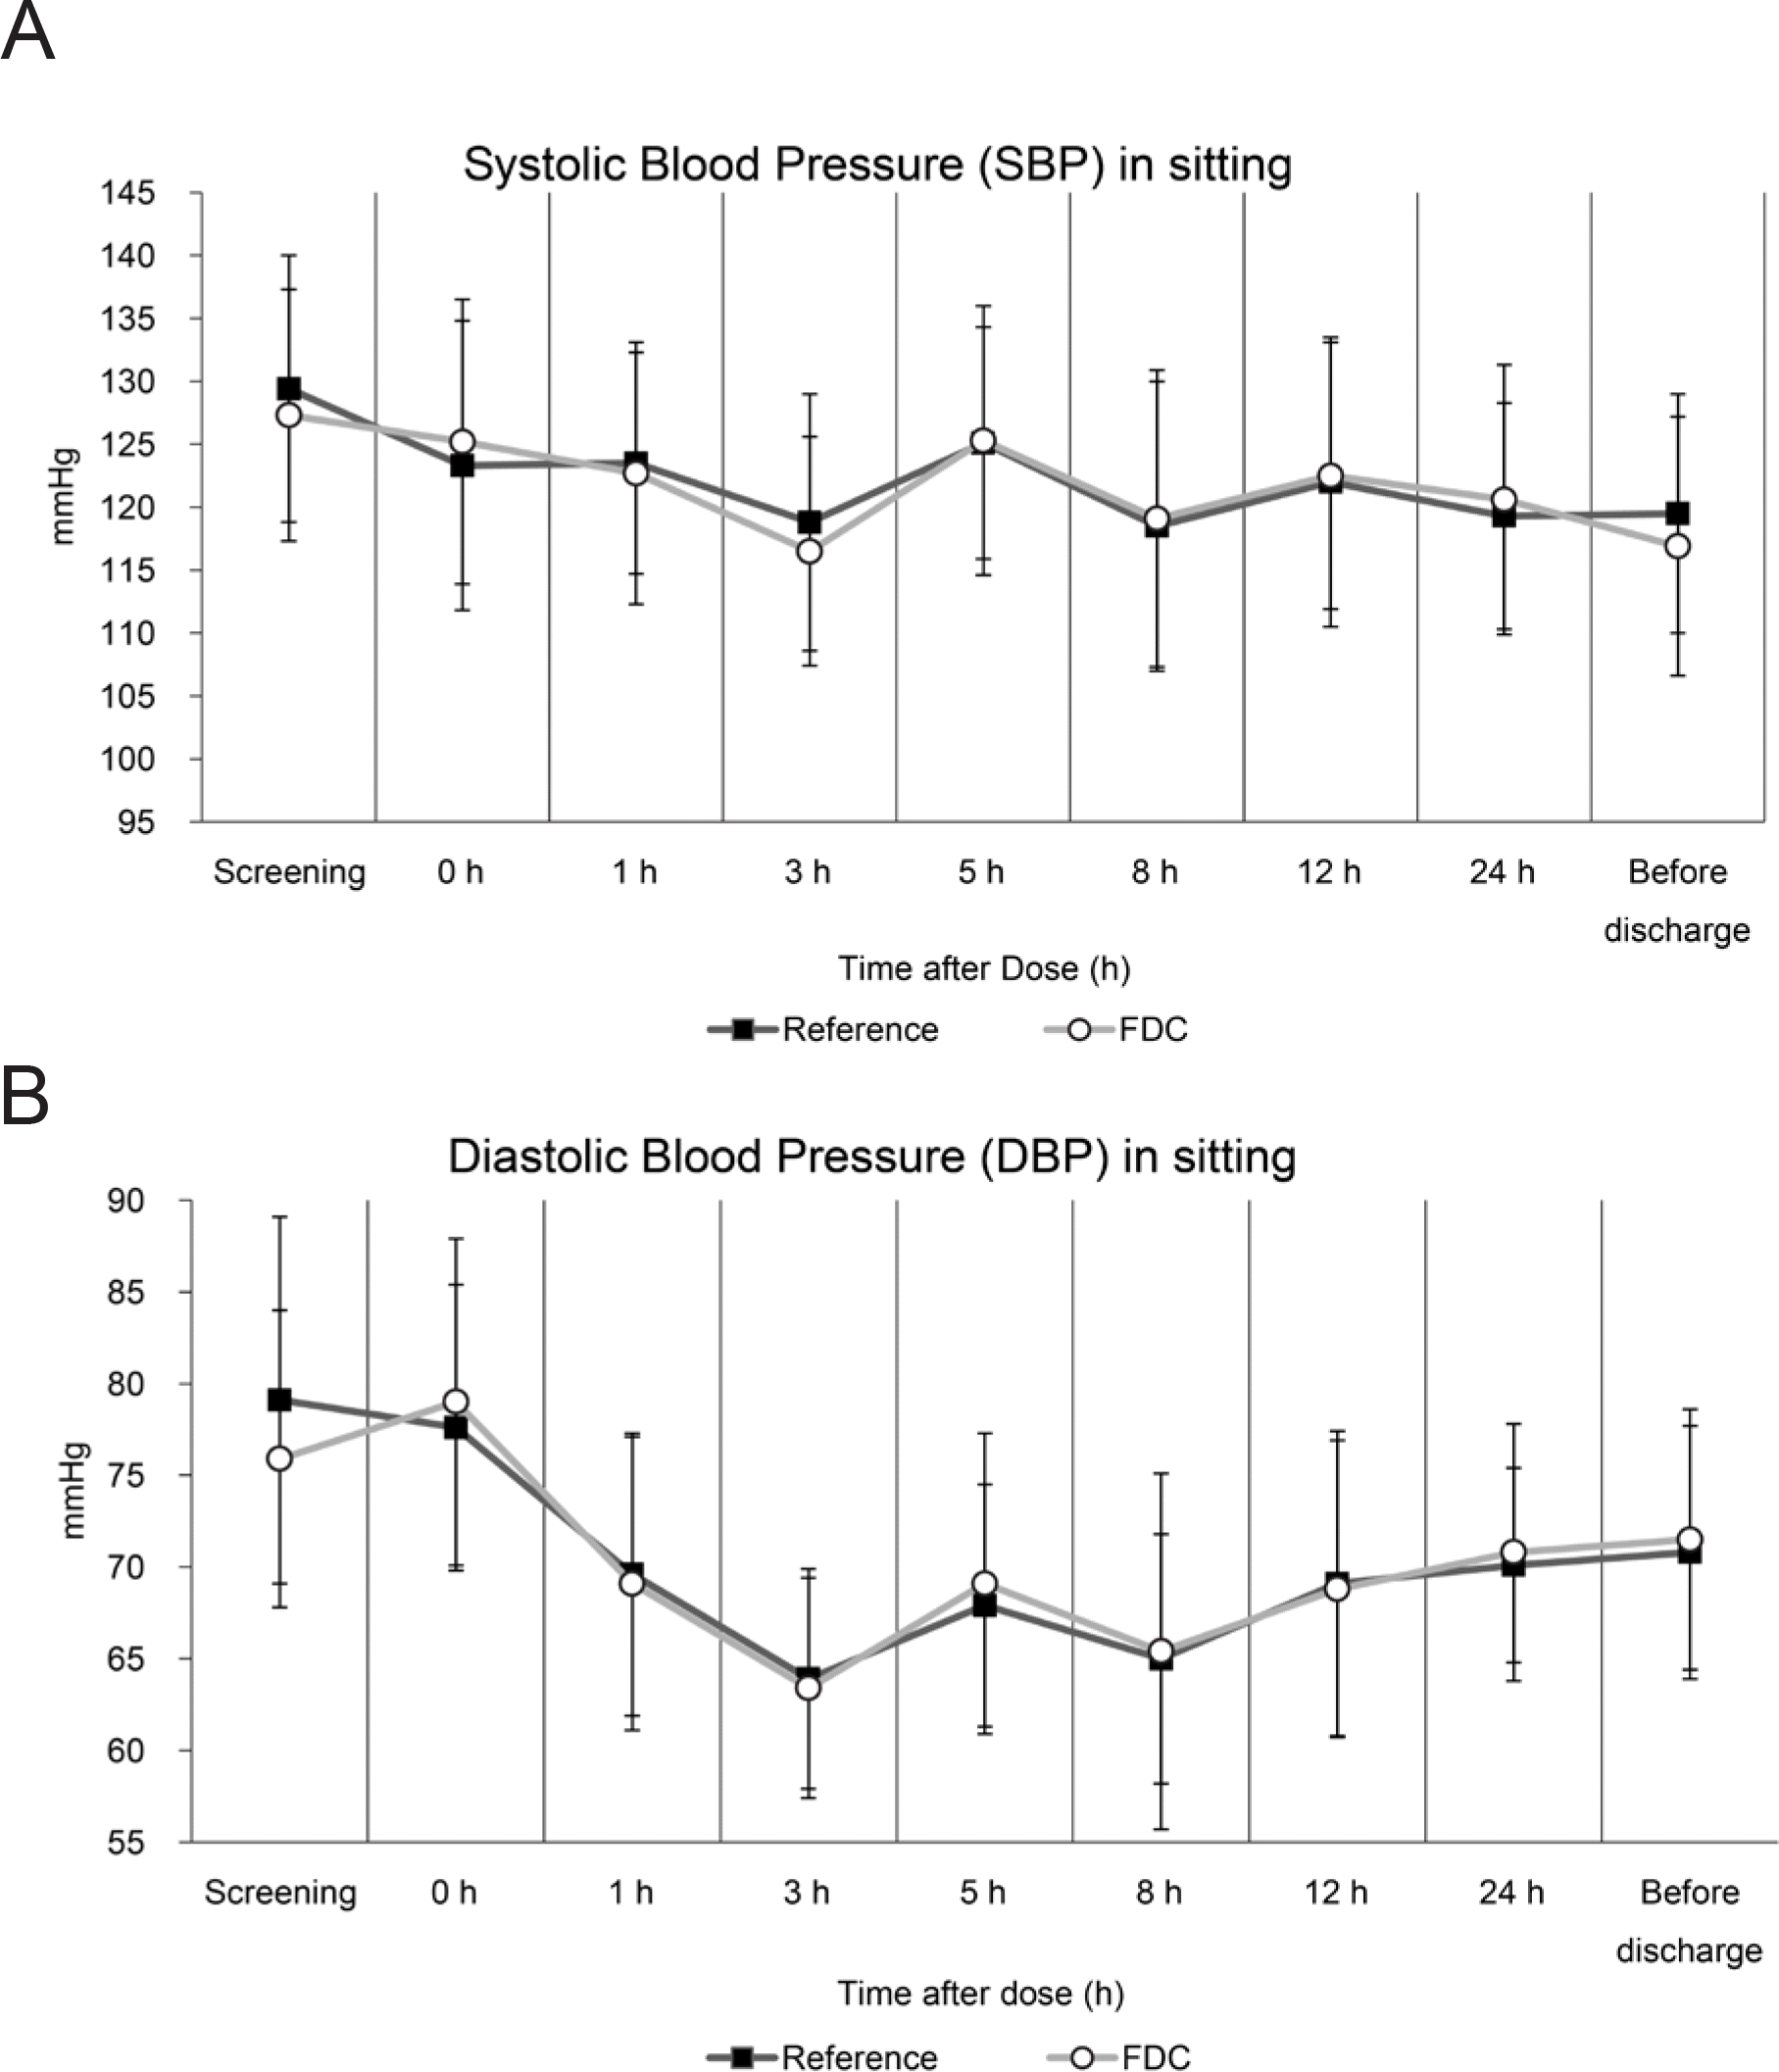
Figure 4.

Table 1.
Table 2.
Notes: Data are summarized as arithmetic mean ± standard deviation except for Tmax, for which median [min-max] is presented. a Geometric mean ratio of fixed-dose combination to concomitant administration Abbreviations: CI, confidence interval; Tmax, time to Cmax; Cmax, the maximum concentration of drug; AUClast, area under the plasma concentration-time curve from the time of dosing to the last measurable concentration; AUCinf, area under the plasma concentration-time curve from dosing time extrapolated to infinity; t1/2, elimination half-life; CL/F, apparent clearance; Vd/F, apparent volume of distribution
Table 3.
Notes: Data are summarized as arithmetic mean ± standard deviation except for Tmax, for which median [min-max] is presented. Abbreviations: CI, confidence interval; Tmax, time to Cmax; Cmax, the maximum concentration of drug; AUClast, area under the plasma concentration-time curve from the time of dosing to the last measurable concentration; AUCinf, area under the plasma concentration-time curve from dosing time extrapolated to infinity; t1/2, elimination half-life; CL/F, apparent clearance; Vd/F, apparent volume of distribution
Table 4.
| Adverse Drug Reaction | Treatment | Fasted Study | Fed Study | Total | P-value# |
|---|---|---|---|---|---|
| Orthostatic hypotension | FDC | 8/30 (26.7%) | 3/34 (8.8%) | 11/64 (17.2%) | 0.059 |
| Reference | 7/29 (24.1%) | 4/34 (11.8%) | 11/63 (17.5%) | ||
| Total∗ | 12/30 (40.0%) | 6/35 (17.1%) | |||
| Headache | FDC | 3/30 (10.0%) | 2/34 (5.9%) | 5/64 (7.8%) | 0.659 |
| Reference | 2/29 (6.9%) | 4/34 (11.8%) | 6/63 (9.5%) | ||
| Total∗ | 4/30 (13.3%) | 6/35 (17.1%) | |||
| Dizziness | FDC | 0/30 | 1/34 (2.9%) | 1/64 (1.6%) | 0.999 |
| Reference | 0/29 | 1/34 (2.9%) | 1/64 (1.6%) | ||
| Total∗ | 0/30 | 2/35(5.7%) |


 PDF
PDF ePub
ePub Citation
 Print
Print


 XML Download