Abstract
The objective of this study was to develop a population pharmacokinetic (PK) model for sumatriptan, which frequently shows an atypical absorption profile with multiple peaks. Sumatriptan, a selective agonist for the vascular serotonin (5-HT1) receptor that causes vasoconstriction of the cerebral arteries, is used for the acute treatment of migraine attack with or without aura. Despite its relatively high between-subject variability, few reports have addressed PK modeling of sumatriptan. Plasma data obtained after a single 50-mg oral dose of sumatriptan in 26 healthy Korean male subjects were used. Blood samples were collected 0 (predose), 0.25, 0.5, 0.75, 1, 1.5, 2, 2.5, 3, 4, 6, 8, 10, and 12 h after dosing. Plasma sumatriptan concentrations were analyzed using UPLC/MS/MS. Population PK analysis was performed using plasma concentration data for sumatriptan with NON-MEM (ver. 7.2). A total of 364 concentrations of sumatriptan were captured by a one-compartment model with first-order elimination, and a combined transit compartment model and first-order absorption with lag time was successful in describing the PK with multiple peaks in the absorption phase of sumatriptan. The creatinine clearance as a covariate significantly (P < 0.01) influenced the absorption fraction (f). The final model was validated through a visual predictive check and bootstrapping with no serious model misspecification.
Go to : 
References
1. Ferrari A, Pinetti D, Bertolini A, Coccia C, Sternieri E. Interindividual variability of oral sumatriptan pharmacokinetics and of clinical response in migraine patients. Eur J Clin Pharmacol. 2008; 64:489–495. doi: 10.1007/s00228-007-0443-9.

2. Sternieri E, Pinetti D, Coccia CP, Leone S, Bertolini A, Ferrari A. Pharmacokinetics of sumatriptan in non-respondent and in adverse drug reaction reporting migraine patients. J Headache Pain. 2005; 6:319–321.

3. Moore KH, Leese PT, McNeal S, Gray P, O'Quinn S, Bye C, et al. The pharmacokinetics of sumatriptan when administered with clarithromycin in healthy volunteers. Clin Ther. 2002; 24:583–594.

4. Rani PU, Naidu MUR, Kumar TR, Shobha JC, Vijay T, Sekhar KR, et al. A bioequivalence study of two brands of sumatriptan tablets. Curr Ther Res Clin E. 1996; 57:589–598.
5. Warner PE, Brouwer KL, Hussey EK, Dukes GE, Heizer WD, Donn KH, et al. Sumatriptan absorption from different regions of the human gastrointes-tinaltract. Pharm Res. 1995; 12:138–143.
6. Cosson VF, Fuseau E. Mixed effect modeling of sumatriptan pharmacokinetics during drug development: II. From healthy subjects to phase 2 dose ranging in patients. J Pharmacokinet Biopharm. 1999; 27:149–171.
7. Seo JJ, Park J, Bae MH, Lim MS, Seong SJ, Lee J, et al. Rapid determination of sumatriptan in human plasma by ultra performance liquid chromatography-tandem mass spectrometry and its application to clinical pharmacokinetic study. J Chromatogr B Analyt Technol Biomed Life Sci. 2013; 919-920:38–42. doi: 10.1016/j.jchromb.2013.01.004.

8. Savic RM, Jonker DM, Kerbusch T, Karlsson MO. Implementation of a transit compartment model for describing drug absorption in pharmacokinetic studies. J Pharmacokinet Pharmacodyn. 2007; 34:711–726.

9. van der Walt JS, Hong Y, Zhang L, Pfister M, Boulton DW, Karlsson MO. A Nonlinear Mixed Effects Pharmacokinetic Model for Dapagliflozin and Dapagliflozin 3-O-glucuronide in Renal or Hepatic Impairment. CPT Pharmacometrics Syst Pharmacol. 2013; 2:e42. doi: 10.1038/psp.2013.20.

10. Ludden TM, Beal SL, Sheiner LB. Comparison of the Akaike Information Criterion, the Schwarz criterion and the F test as guides to model selection. J Pharmacokinet Biopharm. 1994; 22:431–445.

12. Stefano FJ, Trendelenburg U. Saturation of monoamine oxidase by intra-neuronal noradrenaline accumulation. Naunyn Schmiedebergs Arch Pharmacol. 1984; 328:135–141.

13. Donnelly CH, Murphy DL. Substrate-and inhibitor-related characteristics of human platelet monoamine oxidase. Biochem Pharmacol. 1977; 26:853–858.
Go to : 
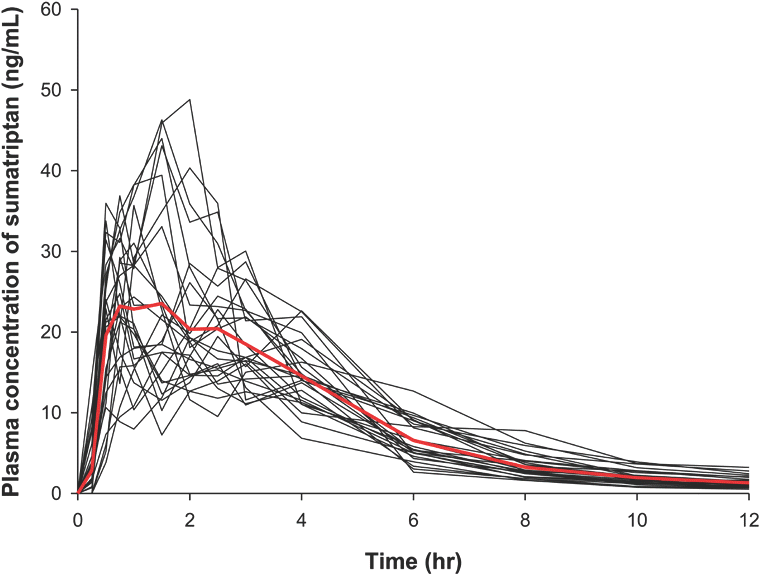
 | Figure 1.Individual plasma concentration versus time plots of sumatriptan. The bold red line is the median value. |
 | Figure 2.The scheme of the final PK model of sumatriptan. ka1, absorption rate constant from the depot; ka2, absorption rate constant from the final transit compartment to the central compartment; ktr, identical transfer rate constant of the transit compartment model; f, fraction of the dose absorbed through the absorption compartment; n, number of transit compartments placed before the central compartment; an, the drug amount in the nth compartment; CL, clearance. |
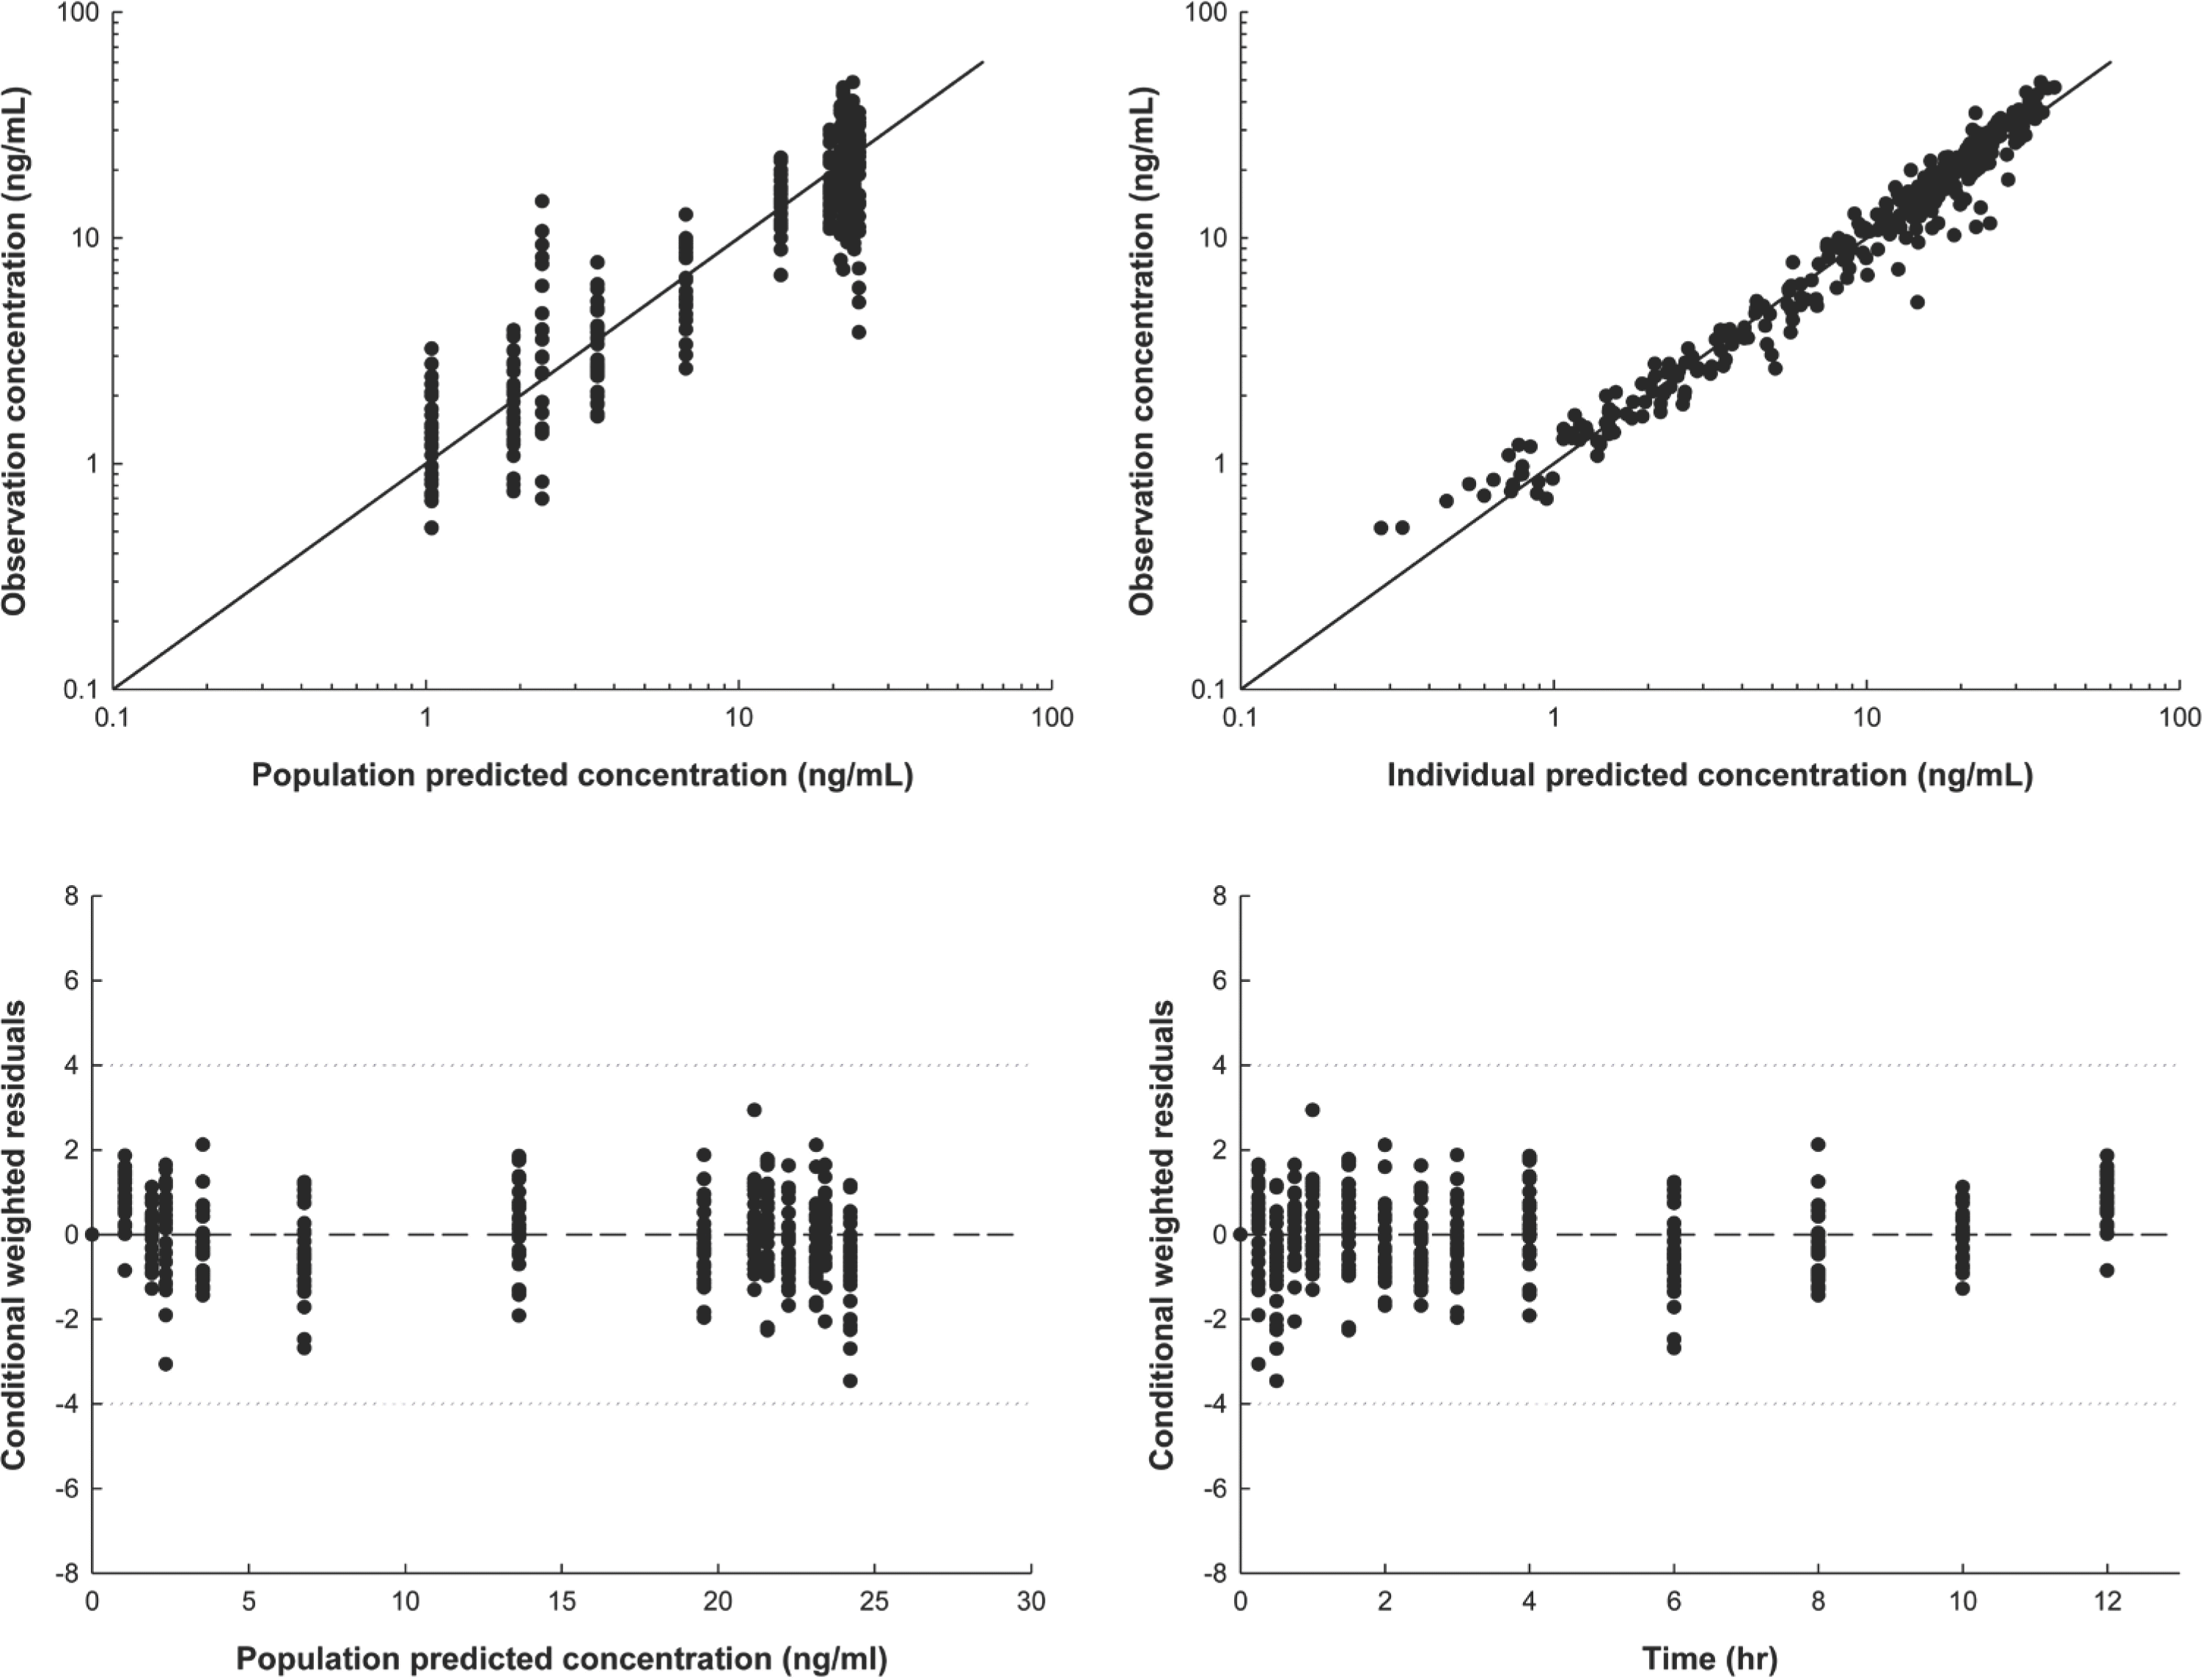
 | Figure 3.Final model diagnosis plot produced using the final pharmacokinetic model. (A) Observations (DV) vs. population predictions (PRED) (B) DV vs. individual predictions (IPRED) (C) Conditional weighted residuals (CWRES) vs. PRED and (D) CWRES vs. time (TIME). |
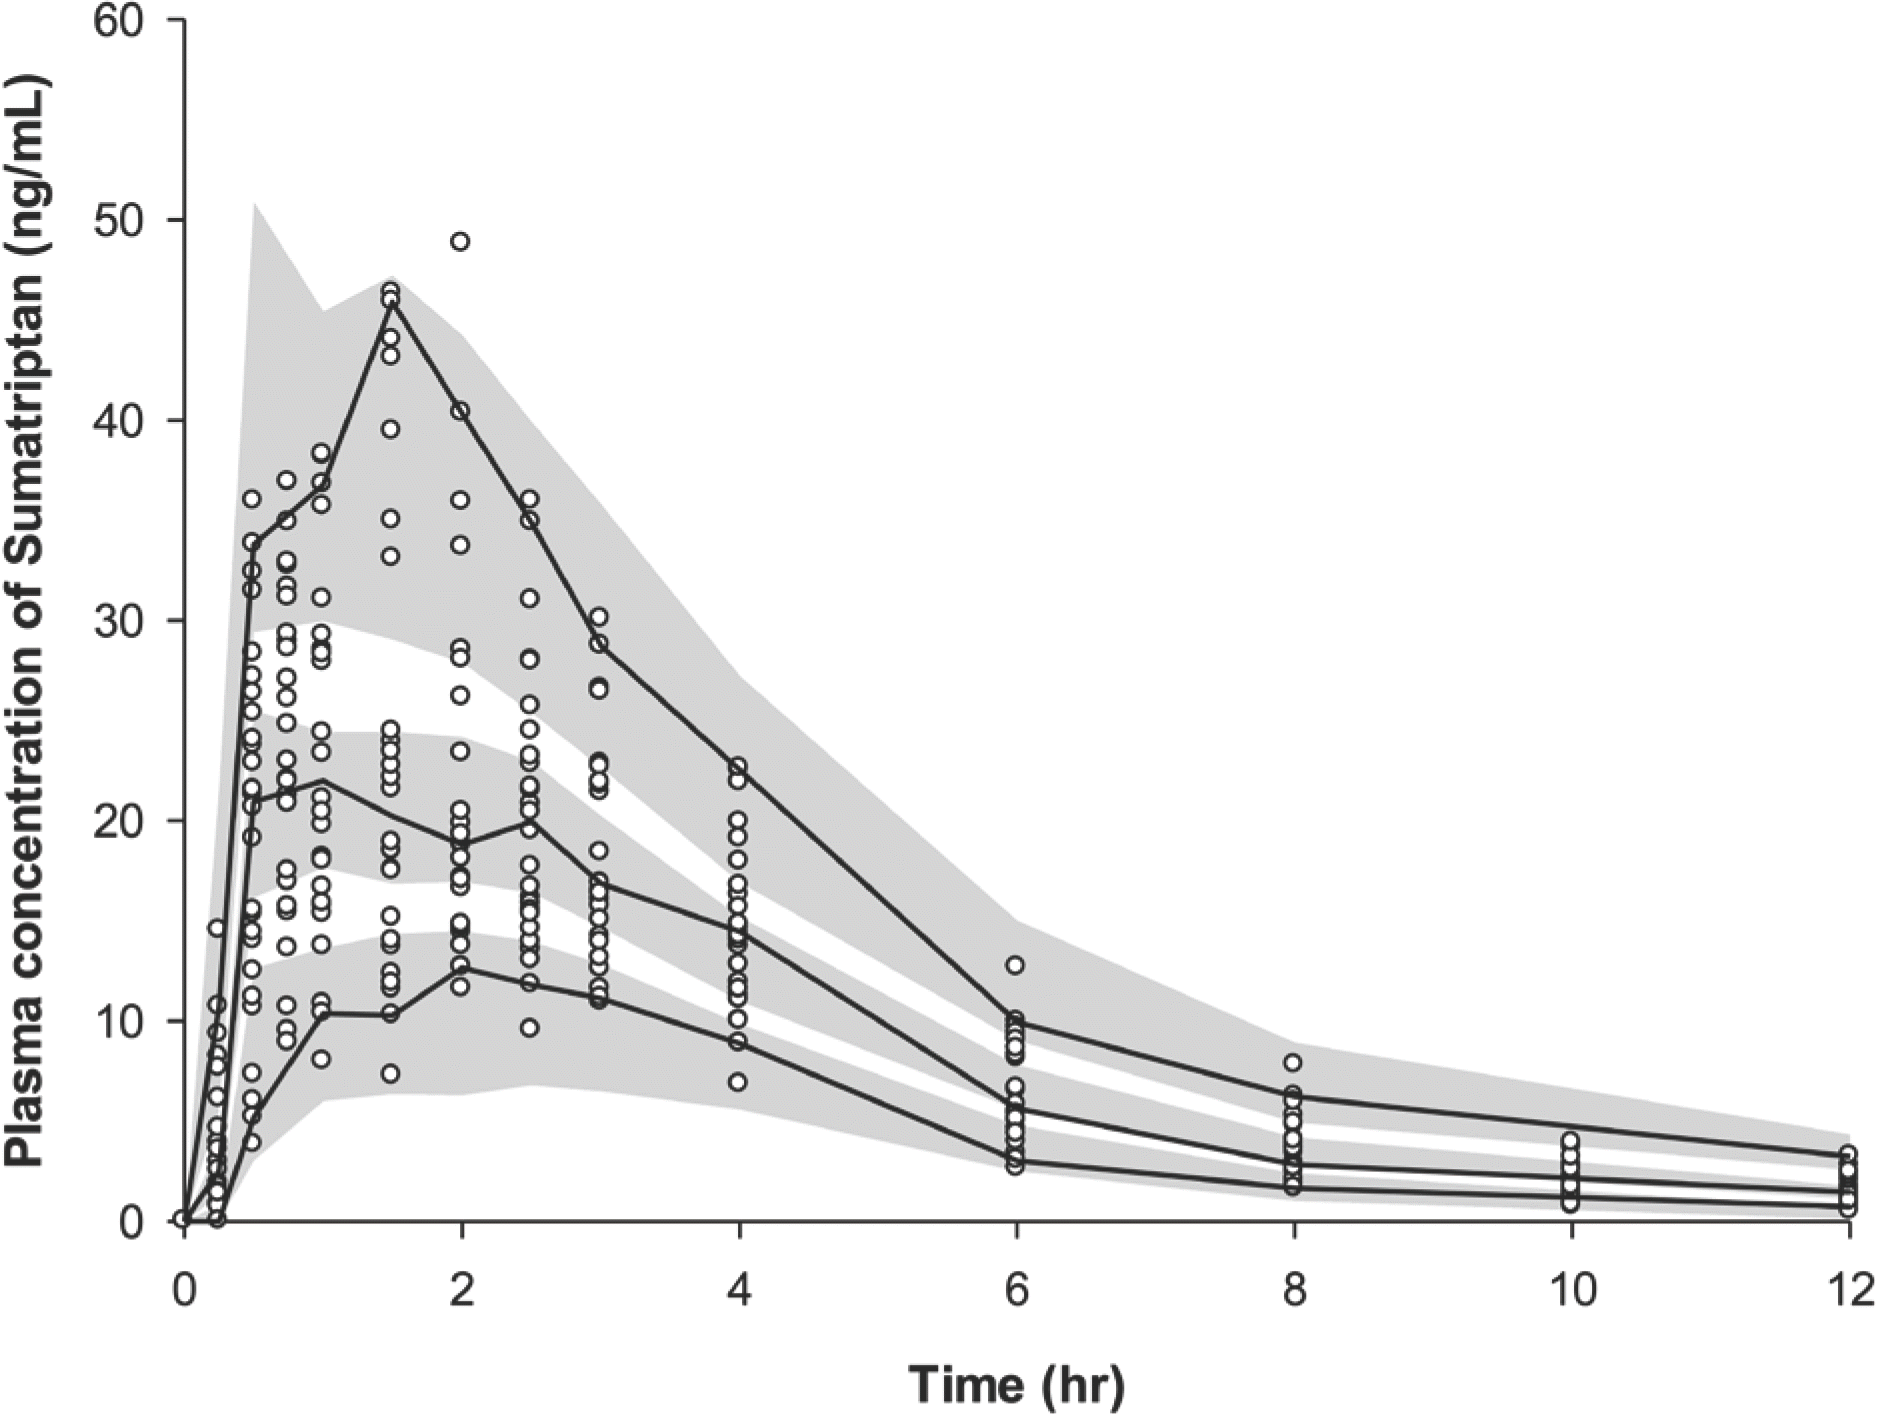
 | Figure 4.Visual predictive check plot of the final model 0 and 12 h after a single oral administration of 50 mg sumatriptan. A total of 1,000 datasets were simulated using the final PK parameter estimates. Circles represent the observed sumatriptan plasma concentrations: the 90% confidence interval of the simulated concentrations (gray area), and observed concentration (solid line) of the 5th, median, and 95th percentiles. |
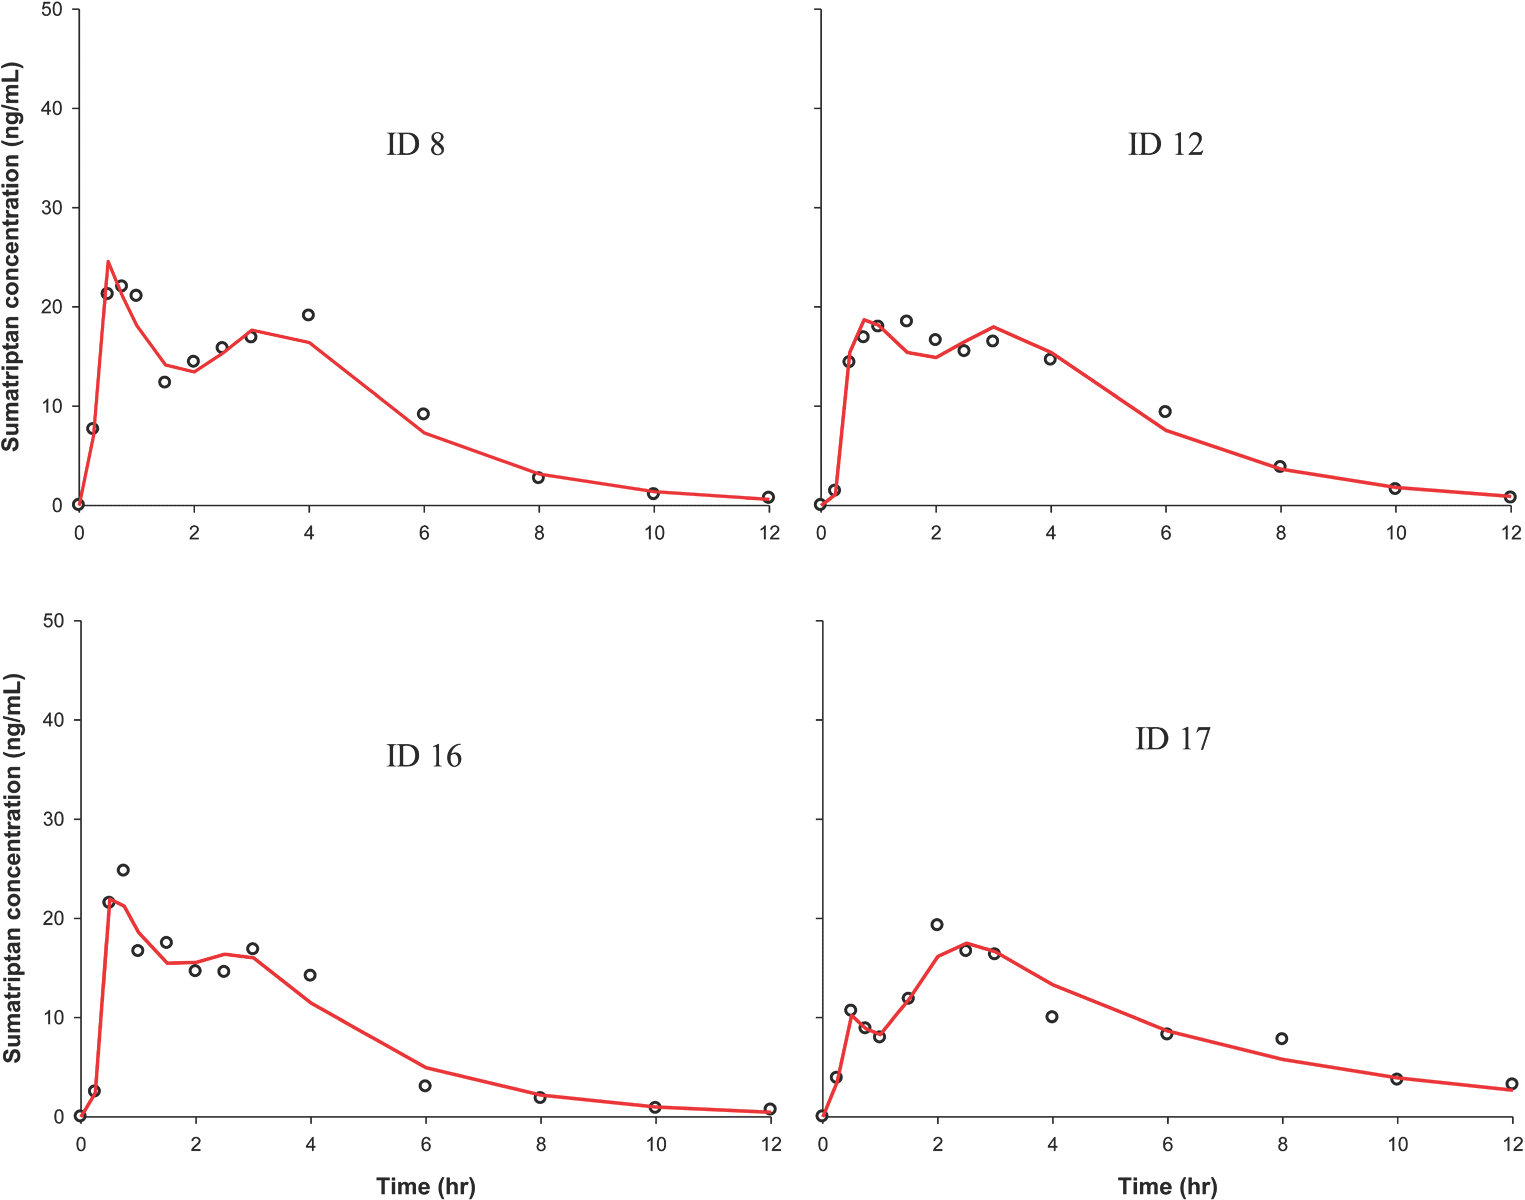
 | Figure 5.PK curves from representative individuals showing multiple peaks. Circle, observed value; solid red line, individual predicted value. |
Table 1.
Demographic characteristics of subjects
| Variable | Distributiona |
|---|---|
| Age (years) | 23.9 (22–28) |
| Sex (male/female) | 26 / 0 |
| Weight (kg) | 66.7 (51–84) |
| Height (cm) | 174.2 (166.2–184.8) |
Table 2.
PK model development process
Table 3.
Final parameter estimates and bootstrap results


 PDF
PDF ePub
ePub Citation
 Print
Print


 XML Download