Abstract
One of the important purposes in population pharmacokinetic studies is to investigate the relationships between parameters and covariates to describe parameter variability. The purpose of this study is to evaluate the model's ability to correctly detect the parameter-covariate relationship that can be observed in phase I clinical trials. Data were simulated from a two-compartment model with zero-order absorption and first-order elimination, which was built from valsartan's concentration data collected from a previously conducted study. With creatinine clearance (CLCR) being used as a covariate to be tested, 3 different significance levels of 0.001<P≤0.01, 0.0001<P≤0.001, P<0.0001 were chosen and 100 simulated datasets were generated using bootstrap resampling for each significance level. Then, the model with covariate (= simulation model) and the model without covariate were alternatively fit to each simulated dataset to compute ΔOFV. The power of correctly estimating CL-CLCR significance was computed as the percentage of simulated datasets using the following 3 decision criteria: ΔOFV larger than 3.84 (P<0.05), 6.64 (P<0.01), and 10.8 (P<0.001). When the significance level was 0.001<P<0.01, the power becomes 81.6%, 60.2% and 34.7% for 3 decision criteria, respectively, yielding the expected model rejection ratio of higher than about 20% when the covariate that might be present in data was marginally significant. Although this work was carried out based on the data obtained from one particular clinical trial, we hope that this work can provide an insight into covariate selectivity associated with healthy volunteer data.
Go to : 
References
1. Wählby U, Jonsson EN, Karlsson MO. Comparison of stepwise covariate model building strategies in population pharmacokinetic-pharmacodynamic analysis. AAPS PharmSci. 2002; 4:E27.

2. Analysis of clinical trial approval in 2014. http://www.mfds.go.kr/index. do?mid=675&seq=26363 Accessed 23 March. 2015.
3. Kim Y, Son M, Lee D, Roh H, Son H, Chae D, et al. Pharmacokinetic comparison of 2 fixed-dose Combination tablets of amlodipine and valsartan in healthy male Korean volunteers: a randomized, open-label, 2-period, single-dose, crossover study. Clin Ther. 2013; 35:934–940. doi: 10.1016/j. clinthera.2013.05.021.

4. Lindbom L, Ribbing J, Jonsson EN. Perl-speaks-NONMEM (PsN)–a Perl module for NONMEM related programming. Comput Methods Programs Biomed. 2004; 75:85–94.

5. Lindbom L, Pihlgren P, Jonsson EN. PsN-Toolkit–a collection of computer intensive statistical methods for nonlinear mixed effect modeling using NONMEM. Comput Methods Programs Biomed. 2005; 79:241–257.

6. Bauer RJ. INTRODUCTION TO NONMEM 7.3.0. NONMEM USERS GUIDE. Hanover. Maryland: ICON Development Solutions;2013.
Go to : 
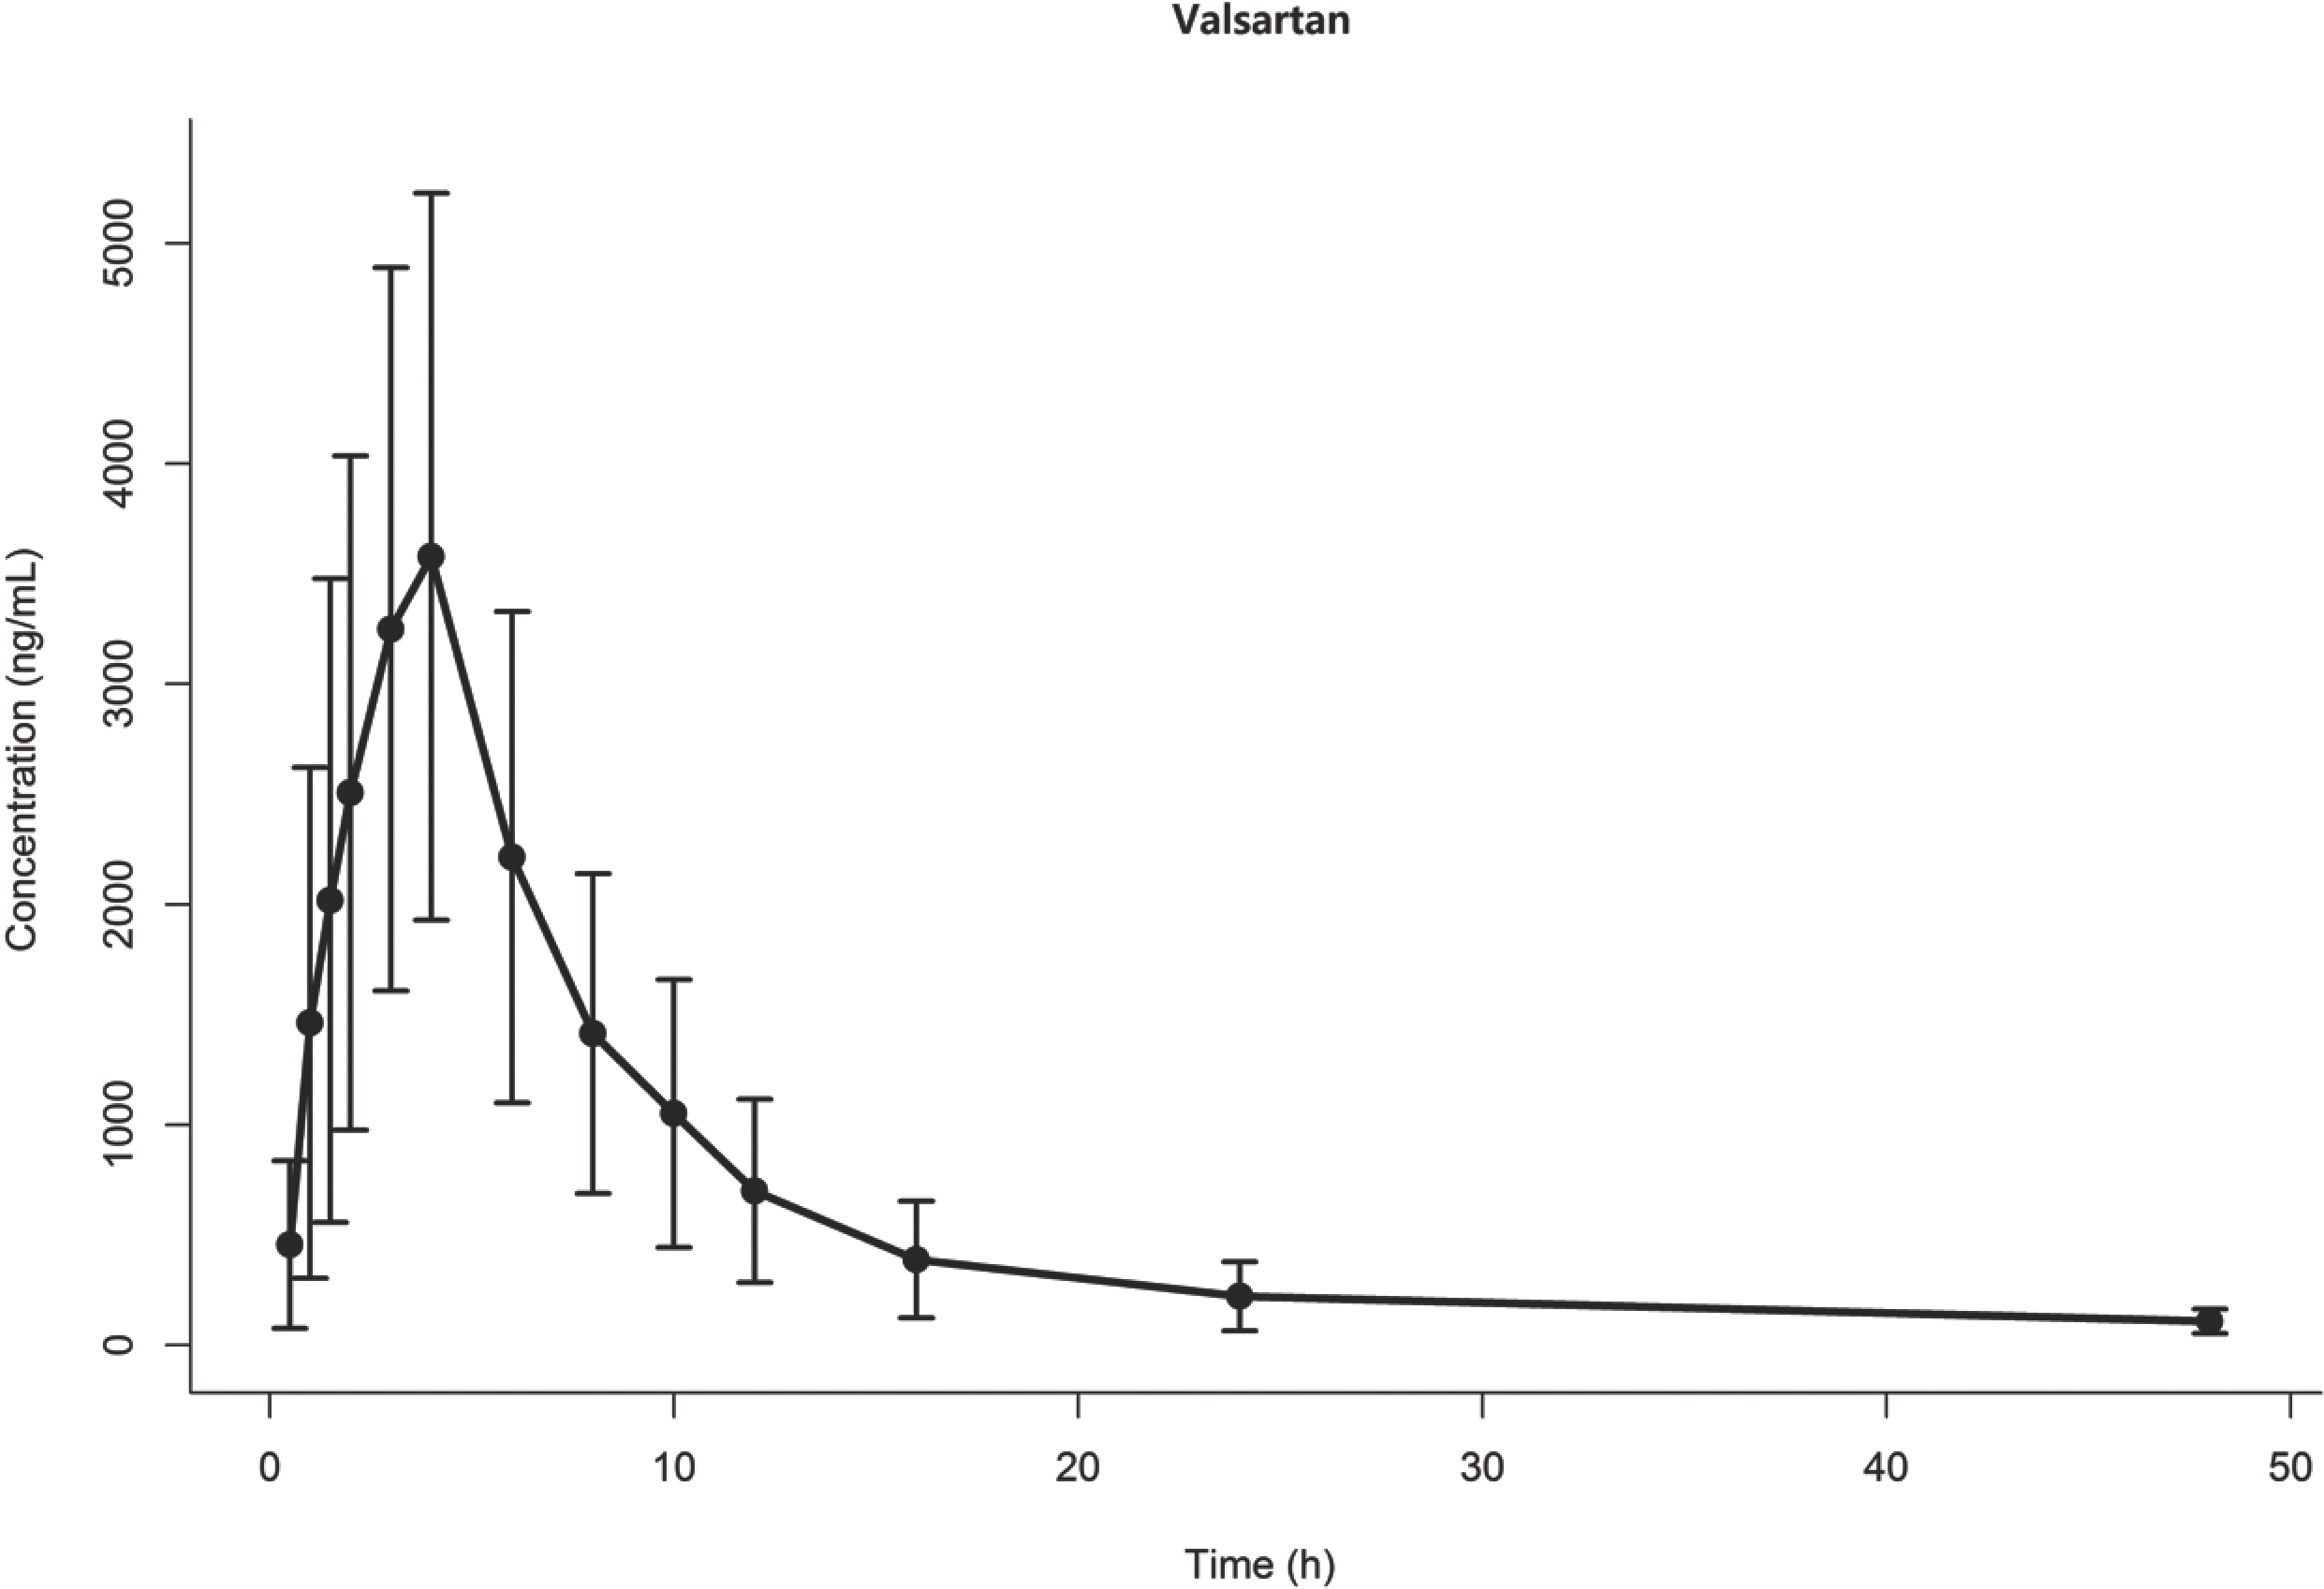
 | Figure 1.Observed concentration vs time for drug X. Dots and error bars represent mean and standard deviation at each time point. |
Table 1.
Demographic characteristics of the study subjects
Table 2.
Power for detecting the significant effect of CL-CLCR at different significance levels used in simulations and model decision


 PDF
PDF ePub
ePub Citation
 Print
Print


 XML Download