

 PDF
PDF ePub
ePub Citation
 Print
Print


INTRODUCTION
Geographic information systems (GISs) are computer-based tools that facilitate the mapping and analysis of geographical data [1]. The recent development of GIS has enhanced accessibility to spatial data, and the development of spatial analysis has enabled the study of epidemiology in a spatiotemporal dimension of the environment, which was otherwise impossible [23]. In particular, GIS connects individuals with the environment and provides more insight for the understanding of the spatial distribution of patients affected by a certain disease [456].
Periodontitis primarily occurs as a result of inflammation caused by bacteria infiltration into the periodontium, but its pathogenesis is largely modulated by the systemic condition or environmental factors, such as smoking, nutrition, diabetes mellitus, osteoporosis, stress, and age [78]. Taking such risk factors into consideration is critical for a better prognosis following periodontal treatments. Conventional concepts of risk factors have been mainly focused on the systemic disease, medication, or other mechanical/chemical factors [9]. However, the current authors have postulated that a GIS analysis might unveil the geographic environment as a potential risk factor. Moreover, the study of disease clusters based on these data will specify the epidemiology of periodontal diseases, and this may contribute to a more effective treatment of periodontitis.
Recent studies in the field of dental science have attempted to utilize GIS in spatial statistics [5101112]. Further, GIS analysis has been applied to investigate the dentist-to-population ratio, regional incidence of oral cancer, and travel patterns in the case of a dental emergency, and has revealed numerous findings, which can be utilized in the daily clinic as well as academic activities [51314]. Unfortunately, these studies are mainly focused on the accessibility of patients or the incidence of dental diseases, but the risk factors from a geographical aspect have not yet been explored. In this paper, we present a hypothesis that the patients are differently located according to the proximity to the hospital, accessibility of road networks, age, gender, and socioeconomic status of the patients. Therefore, the aim of this study is to analyze the patterns of the visualized distribution of patients, and assess the various risk factors, including the patients’ accessibility to the hospital and socioeconomic status. Furthermore, the visualized data will be useful in patient care and treatment planning, ultimately leading to high-quality dental care and preventing a high incidence of dental disease.
MATERIALS AND METHODS
Ethical aspects
This study was approved by the Institutional Review Board (IRB) of Dankook University Dental Hospital (IRB no. H-1501/001/004), and the privacy of the patients was maintained during all analyses and procedures. The personal data obtained from the Dankook University Dental Hospital were used only for academic purposes.
Data collection
Basic patient information data were obtained from Dankook University Dental Hospital, in the form of an Excel file (Microsoft Excel 2013, Microsoft, Redmond, WA, USA). The data included the unit number, gender, date of birth, and address, down to the dong (neighborhood) district unit, of 306,656 patients visiting the hospital between 2007 and 2014. The specific street address was not obtained because of privacy concerns. The data were grouped according to the departments in order to search for any correlation with the spatial distribution (data not shown and reported in another study [15]). This study analyzed the data of seven dental departments: Oral Medicine, Oral & Maxillofacial Surgery, Pediatric Dentistry, Orthodontics, Operative Dentistry, Prosthodontics, and Periodontology. The information of 26,457 patients who visited the Department of Periodontology was mainly examined in this study.
Software
The raw data received from the Dankook University Dental Hospital were treated with Microsoft Excel (Microsoft). SAS 9.3 (SAS Institute Inc. Cary, NC, USA) was used for performing statistical analyses such as multiple regression and logistic regression. ArcGIS 10.1 (ESRI, Redlands, CA, USA) was used for the visualization of the patient distribution, mapping of coefficients, and geographically weighted regression.
Statistical analysis
In this study, we organized the data according to the characteristics of the patient visits. The dependent variable of the study model was the number of patients who visited each department of Dankook University Dental Hospital. The five explanatory variables were as follows: 1) distance to the hospital from the patient’s regional center, 2) distance to the toll gate, 3) male ratio based on the administrative region, 4) average age, and 5) annual personal income. A geographically weighted regression model was used for the statistical analysis of these variables.
Multiple and logistic regression analysis
In order to compare the characteristics of the patients visiting the periodontology department with those visiting the other departments, we use a multiple logistic regression model, which has more than one independent variable. The selection of the analysis method is based on a previous study [16].

Yi: Number of patients visiting each department
D1i: Straight distance to the hospital from the patient’s regional center
D2i: Straight distance to the highway entrance from the patient’s regional center
Ai: Average patient age in a region for each department
Si: Average patient male ratio in a region for each department
Ii: Average income ratio of a region for each department
The value of the dependent variable in our study is “1” or “0,” depending on whether the patient visited the Department of Periodontology, Dankook University Dental Hospital (where “1” = patient visiting the department of periodontology).

Pa: Probability of visiting the Department of Periodontology
D1i: Straight distance to the hospital from the patient’s regional center
D2i: Straight distance from the adjacent toll gate to the patient’s regional center
Ai: Average patient age of a region
Si: Average patient male ratio of a region
Ii: Average annual personal income ratio of a region
If β has (+) then the probability of the patient visiting the periodontology department is increased by exp(β) times as compared to the other departments. For example, if β is 0.04110, then the value of exp(β) is 1.041956. This implies that the probability of a patient visiting the periodontology department is increased by 1.041956, whenever the independent variable is increased by 1 unit. A few of the variables were omitted in models 2, 3, and 4 of the multiple and logistic regressions in order to determine the most appropriate model.
Geographically weighted regression
Geographically weighted regression (GWR) is a spatial analysis technique that takes non-stationary variables into consideration (e.g., climate, demographic factors, and physical environment characteristics) and models the local relationships between these predictors and an outcome of interest. GWR is an outgrowth of the ordinary least squares regression (OLS) method; it adds a level of modeling sophistication by allowing the relationships between the independent and the dependent variables to vary by locality. The GWR model seeks to find the difference in an exceptional phenomenon premised upon the heterogeneity between areas [17].
The GWR models of this study are (3) and (4).
In model (3), we excluded the distance from the center of the region to the adjacent toll gate and the personal income because of mismatching administrative districts.


Yi: Number of patient of each department
Di: Straight distance to the hospital from the patient’s regional center
Ai: Average patient age in a region for each department
Si: Average patient male ratio in a region for each department
RESULTS
Initially, the spatial distribution of patients visiting the Department of Periodontology at Dankook University Dental Hospital was visualized on the map of the Republic of Korea. The distribution appeared nationwide, and a significant number of patients visited from outside the province of the hospital, even from across the country. In fact, the finding that patients travel over a long distance to undergo periodontal treatment instead of visiting local clinics is novel.
The demographic information of patients visiting the Department of Periodontology is shown in Table 1. The average distance from Dankook University Dental Hospital to the center of each region was 30.94±29.62 km. The average distance from the center of each region to the nearest toll gate was 8.22±7.11 km. The range of distribution of these two variables was wide, considering the large standard deviation. The average age of the patients was 52.41±12.97 years. This overall middle-aged distribution was expected as the incidence of periodontal diseases generally increases with an increase in age [818]. The male ratio of the Department of Periodontology was 0.57. The average annual personal income was 13,466.62 thousand Korean won.
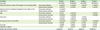
Table 1
Demographic information of patients visiting the Department of Periodontology, Dankook University Dental Hospital (n=26,457)

The results of the multiple regression analysis with respect to the number of patients in relevance with the five variables, namely distance from the hospital, distance from the adjacent toll gate, gender, male ratio, and annual income, are shown in Table 2. A total of four regression models were analyzed in this process. The first model took all five variables into consideration, and revealed that the distance from the hospital, distance from the adjacent toll gate, and the level of personal income had significant relevance to the number of patients visiting the Department of Periodontology, Dankook University Dental Hospital, from the corresponding region. However, the distance from the toll gate had a positive relationship with the number of patients, which implied no special significance from the perspective of this study. Therefore, the distance from the toll gate was omitted in model 2. Model 2 showed that the distance from the hospital and the level of personal income had a significant effect on the number of patients. On average, the number of patients decreased by 0.25 for every kilometer increased. With respect to the personal income, the number of patients decreased with an increase in the level of income. In model 3, age was omitted; the model showed significance for the factors of the distance from the hospital and the level of personal income. In model 4, gender was omitted instead of age; this did not reveal results of any further significance.
Table 2
Regression analysis of the number of patients in the Department of Periodontology, Dankook University Dental Hospital
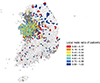
The dependent variables of logistic regression, such as whether the patient was treated in the periodontology department or not, are binary in nature, as in this current analysis (Table 3). Positive values denote that the corresponding variable has a more positive effect on the periodontology department than on the other departments. Model 1 analyzed all five variables and showed the significance of all variables except personal income. Model 2 omitted personal income, as it was shown to be insignificant. The results of model 2 were similar to those of model 1, which implies that the number of patients visiting the periodontology department is not affected by personal income as compared to that of the other departments. Model 3 additionally omitted the distance from the adjacent toll gate. This model indicated the significance of the following factors: distance from the hospital, age, and gender. Therefore, it could be concluded that the periodontology department had more patients from farther distances than the other departments, and that the patients visiting the periodontology department were more likely to be older and male than those visiting the other departments. Table 4 shows the results of the GWR analysis. The local model performance can be evaluated using the local R2 value (Figure 1). It can be seen that the model performance is high in regions that are close to the hospital. This indicates that the variables are better explained in closer regions. The significance can be interpreted through the OLS regression values. The only significant variable is the gender ratio. It indicates a negative significance.
Table 3
Logistic regression analysis of all patients visiting the Department of Periodontology, Dankook University Dental Hospital

Table 4
Results of geographically weighted regression (GWR) in comparison with the regression analysis

Figure 1
Color-coded local R2 values for each district. The regression model performance of the geographically weighted regression analysis is high in regions that are close to the hospital (indicated with red dots). This implies that the variables are better explained in closer regions.
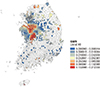
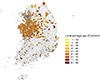
Figure 2 shows the mapped local coefficient of the distance from the adjacent toll gate in GWR. In the vicinity of the hospital, the number of visiting patients decreased as the distance from the adjacent toll gate increased. However, after a certain distance, the number of patients increased as the distance from the adjacent toll gate increased. Figure 3 shows the local average age of patients visiting the Department of Periodontology. The average patient age range in regions close to the hospital was 50–69 years, and some farther regions had a higher average patient age. The local male ratio of patients visiting the Department of Periodontology is mapped in Figure 4. It can be seen that a majority of regions have a male dominance.
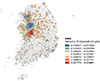
Figure 2
Color-coded local GWR coefficients for the distance from the center of the region to the adjacent toll gate. In regions that are far from the hospital (indicated with red dots), the number of patients increases with an increase in the distance from the adjacent toll gate.
DISCUSSION
In this study, we investigated the relevance between the spatial distribution and five hypothesized factors of patients visiting the periodontology department at a university dental hospital. The patient data were analyzed with the GIS program and visualized, which revealed meaningful results. This study is original in that the main subject of the spatial analysis is the patient pool itself, which is a novel approach to utilizing GIS in the field of dental science. We have explored and analyzed the relationships between patient distribution and variables such as the proximity, road networks, age, gender, and social status.
Previous GIS-based health studies have focused on the spatial distribution of a specific disease or phenomenon, such as cancer or trauma emergencies [61920]. Tennant et al., having published a number of articles on the dental field associated with the GIS analysis, performing studies mostly on public and private practice locations and the spatial distribution of a disease [131421]. However, to the best of our knowledge, this study is the first attempt at a geographic analysis of patients visiting a university hospital.
The results of this study revealed a clear picture of the distribution of the patients visiting the periodontology department at a university dental hospital. The nationwide distribution of the patients can be explained by a few factors. One is that some patients would visit a university hospital for a safer and higher-quality professional treatment, despite the longer travel distance. Another reason is that university dental hospitals offer treatment that cannot be performed elsewhere, because of a lack of equipment or specialists. The distribution of patients has been shown to be affected by several factors. The most evident factor was the distance from the region to the hospital, which was inversely proportional to the number of patients. Compared with the other departments, the Department of Periodontology drew more patients from farther regions. At this point, it is not clear as to why patients travel further to undergo periodontal treatments. We are currently working on a further prospective study to elucidate the underlying mechanism for this phenomenon. The patients were mostly middle aged, as expected. The male dominance in a majority of the regions can be explained by the high smoking rate of males in Korea. Cigarette smoking is known to increase the risk of periodontitis [222324], which may contribute to a relatively high male prevalence. Further research is warranted for the verification of this explanation. The distance from the adjacent toll gate represents the accessibility of road networks from each region. This factor had various effects depending on the region. In regions that were far from the hospital, the number of patients increased with an increase in the distance from the adjacent toll gate (Figure 2). This is likely because the patients would rather visit a closer dental hospital or clinic if the road accessibility is poor in addition to the far distance. Personal income had inconsistent results between analyses. On the basis of these results, the clinicians might consider the impact of the patient’s residence when planning the treatment modalities or deciding upon recall periods.
There are some limitations regarding the methods of this research. This study is retrospective in nature, so we were limited in terms of the data collection. The obtained addresses might not be the actual residential addresses of the patients. In future prospective studies, it will be easier to gather various types of information, such as the actual residential address in a standardized format. Moreover, the study was limited to a single department in a single dental hospital, so it is not clear if all other university dental hospitals match this distribution. Subsequent studies comparing the data of other dental hospitals are needed. Further, a patient’s personal annual income does not entirely represent one’s financial capability. For instance, patients may not necessarily work but still have a high economic status. An alternative means of measuring the patients’ economic status should be utilized in future research.
Moreover, the importance of personal information, associated with the misuse or leakage of personal information should be carefully dealt with. The data obtained for this study included addresses only to the town district (zip code) level since Dankook University Dental Hospital refused to provide further specific street addresses, even for academic use. The Personal Information Protection Law of Korea, the equivalent of the Privacy Act of the United States, states that an organization or institution in possession of personal information should not provide any of it to anyone, without the permission of the owner. However, it also states numerous exceptions, including in cases where the information provided is in a form that makes it impossible to recognize an individual, for statistical or academic purposes. We therefore expect an improvement in terms of the data collection for a better analysis by GIS.
In the present pilot study, the visualized patient data indicated a more extensive patient pool distribution of the Department of Periodontology than that of the other departments, and variable factors such as proximity, accessibility, age, gender, and socioeconomic status significantly affected the visit. We expect the findings of this study to be helpful in the diagnosis, treatment planning, and understanding of the etiology of periodontal diseases. This study demonstrated the potential of a GIS analysis to further investigate the etiological factors of periodontal diseases to be studied in the future. Further information should be acquired in a prospective controlled cohort study to fully evaluate the importance of geographical information in the understanding of the etiology of periodontal diseases.
 XML Download