

 PDF
PDF ePub
ePub Citation
 Print
Print


INTRODUCTION
Sinus augmentation using bone substitute materials is a well-documented procedure for implant placement in posterior maxillae that have undergone severe resorption, and it has shown clinically predictable outcomes with success rates exceeding 90% in meta-analyses [12]. However, placing bone substitute under the elevated Schneiderian membrane is burdensome, time-consuming, and costly. Using a bone substitute may be indispensable for volume maintenance, but it may retard the healing process [34] and result in a significant delay before mature new bone is incorporated.
Several modifications have been attempted with the goal of overcoming those difficulties [567]. Lundgren et al. [8] suggested performing sinus augmentation with blood coagulum and simultaneous implant placement. Their protocol included stabilizing the elevated Schneiderian membrane by suturing, with the holes made on the superior bony surface of the window and on the window sealed by repositioning a bone fragment. The use of non-material sinus augmentation with simultaneous implant placement in subsequent studies showed substantial bone formation; the extent of osseointegration was found to be as high as that observed in autogenous bone grafting in both primates [9] and humans (survival rate=98.7%; new bone height [NBH]=5.3±2.1 mm in a six-year clinical study) [10]. Several studies have also found comparable survival rates for implants with non-material and material-grafted sinus augmentation [11121314]. However, the extent of the increases in NBH varied, and the implant apex was not completely covered in most implants (189 of 239) [1015]. In addition, it has been found that implants extending into the sinus cavity can cause iatrogenic sinusitis and are associated with the risk of migration into the cavity [1617]. Such unpredictable outcomes could potentially hinder the widespread use of this technique.
Growth factors have been used to enhance the osteogenic process around the implant surfaces. Recombinant human bone morphogenetic protein (rhBMP-2) has been used to coat the implant surfaces in order to facilitate local bone formation [181920]. Using the implant itself as a delivery system for rhBMP-2 could be advantageous both in terms of minimizing the loss of the growth factor during the surgical procedure and for localizing it at the surgical site [2122], as well as involving a lower dose of rhBMP-2 and thereby minimizing the complications associated with high doses of rhBMP-2 [2324].
The presence of an rhBMP-2 coating on implant surfaces has been reported to accelerate new bone formation at the supra-alveolar level in canine mandibles [2125]. Definite differences are present between the sinus augmentation model and the ridge augmentation model in terms of the surrounding anatomy and the biomechanics. Ridge and sinus augmentation involve adding bone to the coronal and apical dimensions, respectively, and both involve vertical bone gain along the implant. To the best of our knowledge, no previous study has evaluated the effect of rhBMP-2-coated implants on sinus augmentation.
The purpose of this study was to evaluate bone formation around rhBMP-2-coated implants placed with or without absorbable collagen sponge (ACS) in rabbit maxillary sinuses. The ACS was inserted with the objective of achieving blood clot stabilization.
MATERIALS AND METHODS
Animals
Twelve male New Zealand white rabbits weighing 2.8–3.2 kg were used in this study. Animal selection and management, the surgical protocol, and the operative procedures were approved by the Institutional Animal Care and Use Committee, Yonsei Medical Center, Seoul, South Korea (IACUC Approval No. 2012-0327). The animals were kept in separate cages under standard laboratory conditions, with free access to water and a standard laboratory pellet diet.
Study design
The animals were divided into the blood-filled and ACS-grafted groups (each n=6). In each group, rhBMP-2-coated and non-coated implants were alternately applied to the two sinuses, resulting in the following four groups:
1. BN group: non-coated implant placed in the blood-filled sinus.
2. BC group: rhBMP-2-coated implant placed in the blood-filled sinus.
3. AN group: non-coated implant placed in the ACS-grafted sinus.
4. AC group: rhBMP-2-coated implant placed in the ACS-grafted sinus.
Experimental materials
Experimental mini-implants
Custom-made mini-implants were used in this study (Genoss, Suwon, South Korea). They were cylindrical in shape (6 mm long and 3 mm in diameter) with screw threads for initial fixation that covered a quarter of the coronal portion (1.5 mm from the top of the implant), and the implants had a sand-blasted, large grit, acid-etched surface. The rhBMP-2 was coated on the cylindrical area away from the threads so that it remained in place during installation (Figure 1).
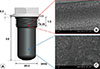 | Figure 1Custom-made mini-implants and micrographs of their surfaces with and without a recombinant human bone morphogenetic protein (rhBMP)-2 coating.Custom-made mini-implants and micrographs of their surfaces with and without a recombinant human bone morphogenetic protein (rhBMP)-2 coating. (A) Schematic of the mini-implant (length, 6.0 mm; diameter, 3.0 mm), which had a sandblasted, large grain, acid-etched surface and included a 1.5-mm threaded portion in the coronal area for fixation and a 4.5-mm cylindrical portion that was coated with rhBMP-2. (B) Scanning electron microscopy (SEM) scan of the uncoated surface in the threaded area. (C) SEM scan of the rhBMP-2-coated surface in the cylindrical area.
|
rhBMP-2 coating on mini-implants
The sterilized implants were coated with rhBMP-2 (Genoss, Suwon, South Korea). Lyophilized rhBMP-2 in sodium acetate buffer (20 mM sodium acetate, pH 4.0; Sigma, St. Louis, MO, USA) was kept refrigerated at 4°C until use. Under aseptic conditions, the rhBMP-2 solution was reconstituted to a 2.0 mg/mL liquid concentration with 2% hyaluronic acid in sodium acetate buffer. The implants were placed in sterile 0.5-mL wells (96 Stripwell plate, round well polypropylene, Sigma) that were filled with the 2.0 mg/mL rhBMP-2 solution (net volume of solution, 0.05 mL per implant) and incubated for 30 minutes. The implants were then air-dried for 16 hours. All of these procedures were performed in a biological safety cabinet (Airstream, Class II, A2 type; Esco, Philadelphia, PA, USA) at room temperature.
Surgical procedure
All surgical procedures were performed by a single experienced surgeon (U.W.J.). Under general anesthesia, additional infiltrative anesthesia was applied to the surgical site in the middle portion of the nasal dorsum. The surgical field was then disinfected with iodine-soaked cotton wool. An incision was made along the midline, including the skin and periosteum. The resultant full-thickness flaps were lifted and the nasal bone was exposed for the next procedure. Two identical circular windows were prepared bilaterally using a trephine bur with a diameter of 5.5 mm (C-reamer, Neobiotech, Seoul, South Korea), and the Schneiderian membrane was elevated carefully to a position 10 mm anterior from the window margin. The implant sites were prepared 3 mm in front of the windows using a pilot drill bit followed by a final drill bit (2.7 mm in diameter), with a surgical curette inserted into the window in order to protect the Schneiderian membrane from the drilling process. Before setting the mini-implants, prepared blood obtained from the branchial vein of an ear was applied to both sides (n=6) or ACS soaked with blood was inserted (n=6). One rhBMP-2-coated implant (diameter 3 mm, length 6 mm; Genoss) was placed by manual force in one sinus, while a non-coated implant for the control group was placed in the contralateral sinus. The groups were allocated alternately in consecutive rabbits. After completing all surgical procedures, the bony windows were replaced and covered by periosteum. The periosteum and skin were closed layer by layer with glyconate absorbable monofilament (6-0 Monosyn, B-Braun, Aesculap, Allentown, PA, USA). Nonsteroidal anti-inflammatory drugs (0.5 mg/kg of ketorolac, intravenously) were administered once for pain control after surgery. Broad-spectrum antibiotics (5 mg/kg of enrofloxacin, subcutaneously, twice per day for five days) were administered for infection control. All rabbits were raised in individually assigned cages and received food and water ad libitum. The temperature and humidity were maintained at 20º–22ºC and 40%–60%, respectively. The sutures were removed 10 days postoperatively under sedation. The rabbits were sacrificed by an overdose of anesthesia after eight weeks of healing.
Radiographic analysis: micro-computed tomography
All specimens were fixed in 10% formalin for 10 days and scanned with a high-resolution micro-computed tomography (micro-CT) system (SkyScan 1173, SkyScan, Aartselaar, Belgium) at a resolution of 9 μm (using settings of 130 kV and 60 μA) with a 0.25-mm bromine filter. One experienced researcher measured the data while blinded to the group assignments using CT Analyzer 1.14 (Bruker-CT, Kontich, Belgium). The total augmented volume (TV; mm3) and the newly formed bone volume (NBV; mm3) were measured. New bone was identified in images as pixels with grayscale values of 55–255 [2426]. The new bone density (NDV) was calculated as the NBV divided by the TV.
Histologic and histomorphometric analyses
After micro-CT scanning, the specimens were dehydrated in ethanol, embedded in methacrylate, and sectioned along the long axis of the mini-implants using a diamond saw (Exakt, Apparatebau, Norderstedt, Germany). The final thickness of the specimens was reduced to about 20 μm. They were stained with hematoxylin and eosin and analyzed histologically using a microscope. Digital images of the histologic slides were obtained using a built-in digital camera in the light microscope (BX50, Olympus, Tokyo, Japan).
The following linear measurements were made by a single experienced examiner (W.S.B.) twice, at a three-week interval, based on the methodology of a previous study [27]. The following parameters were measured:
1. Cortical bone thickness (CBT), reflecting the thickness of native bone close to the bony window;
2. NBH, which was the distance from the inner border of cortical bone to the most apical level of new bone on the implant surface;
3. Exposed height (EH), which was the distance between the most apical level of new bone and the horizontal line at the tip of the mini-implant;
4. Protruding height (PH), which was the length of the implant protruding into the sinus cavity;
5. Bone-to-implant contact ratio (BIC), which was the percentage of new bone in contact with the implant surface.
These measurements were performed on both the medial and lateral sides of the implants.
A rectangular area of interest (AOI) was selected adjacent to the implant (1.5 mm in width, and as long as the implant plus 1.5 mm apical to the implant apex in height). The following parameters were measured in the AOIs in the medial and lateral areas of the implants: total augmented area (TA; mm2), new bone area (NBA; mm2), fibrovascular tissue area (FVA; mm2), and new bone density (NDA) (Figure 2).
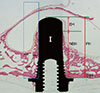 | Figure 2Parameters for the linear and areal measurements.The rectangle with the blue border indicates the area of interest (AOI). The subarea bordered by a dotted line indicates the total augmented area (TA). The orange dotted line dividing the AOI indicates the Schneiderian membrane. NBA, new bone area; PH, protruding height; NBH, new bone height; CBT, cortical bone thickness; EH, exposed height.
|
Statistical analysis
Statistical analysis was performed using SPSS version 15.0 (SPSS, Chicago, IL, USA). The intraexaminer coefficient between the parameters measured at a three-week interval was 0.98 (P<0.05). Due to the small number of samples, statistical significance was analyzed using the following nonparametric tests: the Wilcoxon signed-rank test for the BC group versus the BN group and for the AC group versus the AN group, and the Mann-Whitney U test for the BC group versus the AC group and for the BN group versus the AN group. The cutoff for statistical significance was set at P<0.05.
RESULTS
Clinical observations
Seven minor perforations (<2 mm) occurred during surgery, at two sites in the BC, BN, and AC groups, and at one site in the AN group. No postoperative complications, such as pus discharge or swelling, were found in any of the rabbits. After euthanizing the animals, implant exposure beyond the Schneiderian membrane and implant displacement were not observed.
Radiographic analysis: micro-CT
New bone appeared in a wide-dome shape in the ACS-grafted group and in a thin-pyramid shape in the blood-filled group. New bone formation was greater on the lateral side of the implant than on the medial side. The presence or absence of the rhBMP-2 coating had no noticeable effect on the patterns of bone formation (Figure 3).
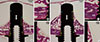
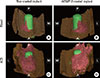 | Figure 3Three-dimensionally reconstructed images of representative micro-computed tomography (micro-CT) views. Newly formed bone appears red, the mini-implant fixture appears green, and the nasal bone appears brown, with the internal surface of the implant facing upwards. (A, B) The newly formed bone had a pyramidal shape in the BN and BC groups. (C, D) The newly formed bone had a trapezoidal shape in the AN and AC groups.(A) The BN group, (B) the BC group, (C) the AN group, (D) the AC group. BC, blood-filled and coated implant; BN, blood-filled and non-coated implant; AC, absorbable collagen sponge and coated implant; AN, absorbable collagen sponge and non-coated implant.
ACS, absorbable collagen sponge; L, lateral; M, medial; A, anterior; P, posterior.
|
The TV was significantly greater in the ACS-grafted groups than in the blood-filled groups. The TV differed significantly between the AC and BC groups (157.01±38.29 mm3 vs. 90.47±41.61 mm3, P=0.016) and between the AN and BN groups (173.93±41.49 mm3 vs. 65.18±24.95 mm3, P=0.004) (Figure 4A). The NBV was also significantly greater in the ACS-grafted groups than in the blood-filled groups: 33.48±11.94 mm3 in the AC group versus 7.60±4.40 mm3 in the BC group (P=0.004), and 29.53±5.03 mm3 in the AN group versus 7.61±2.60 mm3 in the BN group (P=0.004). The NBV was greater in the AC group than in the AN group, but this difference did not reach statistical significance (Figure 4B). The NDV differed significantly between the AC and BC groups (21.77±6.81% vs. 8.28±2.37%, P=0.004) (Figure 4C).

Histologic observations
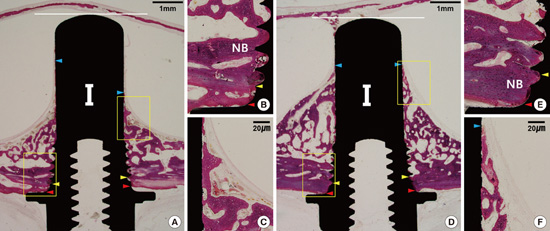
Neither inflammatory responses nor adverse foreign body reactions were observed in the histological analysis. The new bone generally appeared to initially sprout from the basal bone toward the implant apex along the implant surface. New bone was more loosely scattered in the ACS-grafted group than in the blood-filled group. The Schneiderian membrane made direct contact with the apex of the implant in all except two implants in the AC group, in which it was completely surrounded by bone tissue (Figure 5C, Figure 5F; Figure 6B, Figure 6C, Figure 6E, and Figure 6F).
 | Figure 5Histologic images of representative sites after eight weeks of healing in the blood-filled group.(A): BN group. Bone formation in a pyramidal shape was observed. The red arrowhead indicates the outer boundary of the cortical bone layer, the yellow arrowhead indicates the inner boundary of the cortical bone layer, the blue arrowhead indicates the apical margin of new bone height (NBH), and the white horizontal line indicates the most apical line meeting the fixture. (B) The coronal part adjacent to the top area of the implant. (C) The apical part around the end of the newly formed bone. A well-maintained Schneiderian membrane was observed. (D) The BC group. (E) The coronal part adjacent to the top area of the implant. (F) The apical part around the end of the newly formed bone. NB, new bone.
|
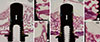 | Figure 6Histologic images of representative sites after eight weeks of healing in the ACS-grafted group.(A) The AN group. (B) The coronal part adjacent to the top area of the implant. (C) The apical part around the end of the newly formed bone. A well-maintained Schneiderian membrane was observed. Detached newly formed bone was seen on the apical margin of the new bone height (NBH). Newly formed bone had a relatively low density. (D) The AC group. (E) The coronal part adjacent to the top area of the implant. (F) The apical part around the end of the newly formed bone. A high bone-to-implant contact ratio (BIC) was observed. NB, new bone.
|
The general shape of bone formation differed between the ACS-grafted and blood-filled groups. Dense and lamellar bone in a triangular shape with a steep angle was observed around the implants in the BC and BN groups, whereas the newly formed bone exhibited a trapezoidal shape in the AC and AN groups. The pattern of bone formation did not differ histologically between the BN and BC groups, with the new bone being in continuous contact with the implant surface (Figure 5B and Figure 5E). The new bone was denser and more even in the AC group than in the AN group (Figure 6A and Figure 6D), and it extended more continuously along the implant surface in the AC group than in the AN group.
Histomorphometric analysis
Table 1 presents the mean (± standard deviation) values of the linear measurements. CBT did not differ significantly among the four groups. The NBH was highest in the AC group, but the differences did not reach statistical significance. The BIC was significantly greater in the AC group than in the AN group, but did not differ significantly between the AC and BC groups (Figure 7A).
Table 1
Linear measurements in the histometric analysis. The data are mean± standard deviation values (in millimeters) for averaged measurements on the medial and lateral sides.

CBT, cortical bone thickness; NBH, new bone height; EH, exposed height; PH, protruding height; BC, blood-filled and coated implant; BN, blood-filled and non-coated implant; AC, absorbable collagen sponge and coated implant; AN, absorbable collagen sponge and non-coated implant.
No significant differences were observed among the groups.
![]()
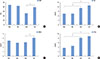 | Figure 7Mean values of bone-to-implant contact (BIC), total augmented area (TA), newly formed bone area (NBA) and fibrovascular tissue area (FVA) in the area of interest in the histometric analysis (n=6, respectively).(A) BIC, (B) TA, (C) NBA, (D) FVA.
*, significant difference, P<0.05
|
The measurements made in the AOIs are shown in Figure 7. The TA and FVA were significantly higher in the AC group than in the BC group, and in the AN group than in the BN group (P<0.01). The presence or absence of ACS did not significantly affect the NBA. The NBA was significantly greater in the AC group than in the AN group (4.10±1.10 mm2 vs. 3.08±0.70 mm2, P<0.05) (Figure 7B–D). The placing of non-coated implants significantly decreased the NDA in the ACS-grafted groups (48.10±9.76% in the BN group vs. 29.15±11.54% in the AN group, P=0.015), whereas the placing of rhBMP-2-coated implants did not significantly affect the NDA (40.24±8.45% in the BC group vs. 32.76±11.88% in the AC group, P=0.262).
DISCUSSION
The maintenance of space under the elevated Schneiderian membrane is critical for ensuring long-term stability following sinus augmentation. Despite the evidence for de novo bone formation in sinus augmentation without bone grafting, the quantity and quality of the regenerated bone have not previously been validated. In the present study, blood coagulum and ACS were used as space-filling matrices for the purpose of aiding the effects of rhBMP-2-coated implants.
Choi et al. [23] reported that inserting collagenous biomaterials under the Schneiderian membrane provided some degree of space maintenance during the early healing phase. However, inserting ACS alone into rabbit sinuses caused the generation of new bone with a thickness of about 2 mm. In the present study, the TV and NBV were significantly greater in the ACS-grafted groups than in the blood-filled groups. However, it should be noted that the ACS did not fully counteract the repneumatization. Although full coverage with newly formed bone over the implant apex was observed at two of the six sites in the AC group, EHs ranging from 0.96 to 1.44 mm were observed in the ACS-grafted group. This finding closely reflects those of a previous report regarding modified sinus elevation surgery [27].
Longer mini-implants (6 mm) were used in the present study based on the results obtained by Jung et al. [27] using 4-mm mini-implants. A positive correlation between the length of the implant and bone gain has been reported in non-material sinus augmentation [12]: compared to 9-mm implants, 15-mm implants showed a greater average bone gain (3.50 mm vs. 6.94 mm). Such “tenting” with a long implant against the Schneiderian membrane could increase bone regeneration. The average value of the NBH in the BN group in the present study (3.99 mm) was 75% of the PH (5.27 mm), whereas Jung et al. [27] found that the NBH was only 1.5 mm when using a 4-mm implant, which was less than 50% of the PH (3.2 mm).
In the present study, the bony window was repositioned after the sinus augmentation procedure, unlike the previous mini-implant study of Jung et al. [27]. The replacement of the bony window has previously been regarded as indispensable by researchers advocating the use of non-material sinus augmentation [789]. The window is intended to act as a barrier to prevent the blood coagulum from being dislodged from the augmented sinus compartment and to re-establish pneumatic conditions [8]. The greater stability of the blood coagulum could stimulate mesenchymal progenitor cells and osteogenic cells in the surrounding tissue, thereby promoting osteogenic differentiation [728]. This could explain why the NBH was more than six times greater (3.99 mm) than the original bone thickness (0.54 mm) in the BN group.
Coating the implant surface with rhBMP-2 was expected to result in more favorable bone formation overall and along the implant surface, regardless of the presence of a space filler. However, combining rhBMP-2 coating with blood filling did not produce a discernible effect. Moreover, in combination with ACS, nonsignificant increases in the NBV and NDV were observed in the AC group in comparison with the AN group, although the NBV and NDV were greater than in the blood-filled group. These findings may have been due to the space-maintaining function of ACS being a more important factor for bone regeneration. However, the tendency for bone formation near the Schneiderian membrane was greater in the AC group, in agreement with previous observations of the osteogenic potential of the Schneiderian membrane under the influence of rhBMP-2 [293031].
Coating the implant with rhBMP-2 improved the BIC in the AC group in comparison to the AN group. The BIC in the AN group decreased by approximately 15%. In other studies using rhBMP-2-coated implants, a BIC value of 37.4% was found in the sinus of a mini-pig [32], and values of 28%–36.8% were reported for supra-alveolar defects in dogs [33]. These differences may have been due to the use of different animals and experimental models, as well as the small sample sizes.
No previous study has evaluated rhBMP-2-coated implants in a rabbit sinus model. Choi et al. [31] found that adding 0.15 mg of rhBMP-2 to a coating of biphasic calcium phosphate did not support sinus augmentation in rabbits, which prompted the use of a lower total dose to 0.1 mg in this pilot study. Kim et al. [34] found that 0.015 mg of rhBMP-2 was not sufficient to induce a statistically significant effect in a similar model. While no adverse events were noted when that dose was used, the bone regeneration associated with the rhBMP-2-coated implants did not significantly differ from what was observed in other groups. Therefore, increasing the amount of newly formed bone and the bone density most likely requires further adjustment of the rhBMP-2 concentration.
Based on the results of this study, it can be concluded that the insertion of ACS following the elevation of the Schneiderian membrane and simultaneously with implant placement can significantly increase the augmented volume. However, the use of rhBMP-2 coating in the present study had limited effects in terms of enhancing the quantity and quality of regenerated bone.
 XML Download