

 PDF
PDF ePub
ePub Citation
 Print
Print


J Periodontal Implant Sci 2015;45:101-10. doi: 10.5051/jpis.2015.45.3.101
Some parts of published paper were misprinted. They should be corrected as follows.
Corrected parts
Correspondence:
Gwan-Shik Kim. Department of Molecular Genetics, Seoul National University School of Dentistry, 101 Daehak-ro, Jongno-gu, Seoul 110-744, Korea. Email: gskim@snu.ac.kr , Tel: +82-2-740-8687, Fax: +82-2-741-3193
Jeong-Hwa Baek. Department of Molecular Genetics, Seoul National University School of Dentistry, 101 Daehak-ro, Jongno-gu, Seoul 110-744, Korea. Email: baekjh@snu.ac.kr, Tel: +82-2-740-8688, Fax: +82-2-741-3193
Corrected Figures & Legends
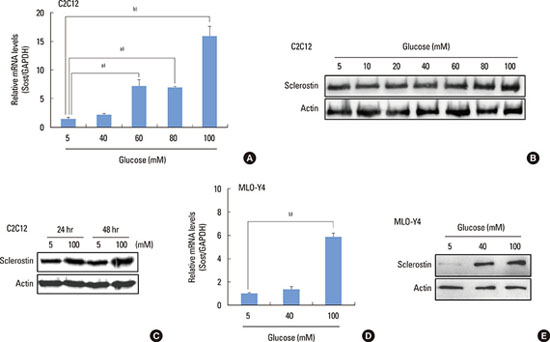
Figure 1. High glucose increases sclerostin expression. (A-C) C2C12 cells were cultured in osteogenic medium in the presence or absence of high glucose for 48 hours unless specified, and (A) RT-PCR and (B) Western blot analysis were performed. (D, E) MLO-Y4 cells were incubated for 48 hours in the presence or absence of high glucose treatment, followed by (D) quantitative RT-PCR and (E) Western blot analysis. The graphs (A, D) indicate the mean±standard deviation of the triplicate samples (a)P<0.001, b)P<0.0001). GAPDH, glyceraldehyde 3-phosphate dehydrogenase; RT-PCR, reverse transcription-polymerase chain reaction. In the Figure 1C, 5 and 100 mM indicate the concentration of glucose in the culture medium.
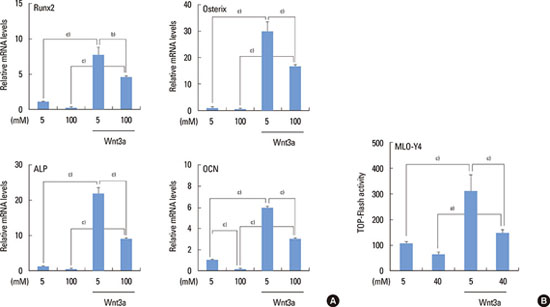
Figure 2. High glucose negatively regulates Wnt/β-catenin signaling. (A) C2C12 cells were incubated for 24 hours in the presence or absence of Wnt3a (50 ng/mL) or high glucose (100 mM), followed by quantitative reverse transcription-polymerase chain reaction of osteogenic marker genes. (B) MLO-Y4 cells were transiently transfected with the β-catenin expression vector and Top-Flash luciferase reporter and cultured in the presence or absence of Wnt3a or high glucose (40 mM) for 72 hours. The graphs indicate the mean±standard deviation of (A) the triplicate or (B) quadruplicate samples (a)P<0.05, b)P<0.001, c)P<0.0001). In the figures, 5 and 100 mM indicate the concentration of glucose in the culture medium.
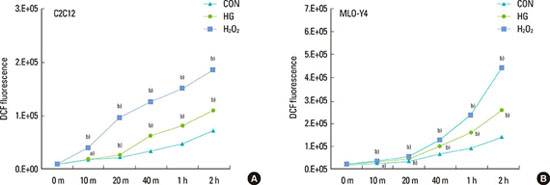
Figure 3. High glucose enhances reactive oxygen species production. Dichlorofluorescein diacetate was added to the culture medium, and (A) C2C12 and (B) MLO-Y4 cells were treated with high glucose (100 mM) or H2O2 (1 mM) for the indicated time periods, followed by measuring fluorescence from oxidized dichlorofluorescein. The graphs indicate the mean±standard deviation of the octuplicate samples (a)P<0.001, b)P<0.0001; significantly different from the control group at each time point). DCF, dichlorofluorescein; CON, control; HG, high glucose; m, minutes; h, hours.
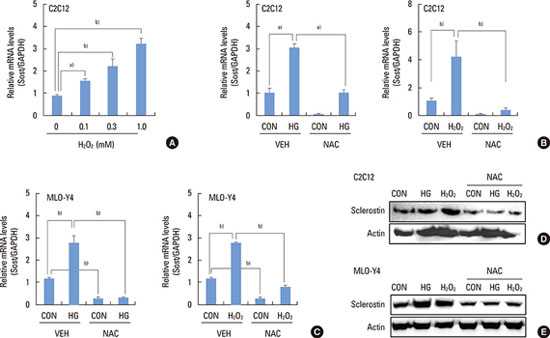
Figure 4. Reactive oxygen species contribute to high glucose-induced sclerostin expression. (A) C2C12 cells were incubated for 48 hours in the presence of H2O2 at the indicated concentrations, followed by (B-E) quantitative RT-PCR for sclerostin. (B, D) C2C12 and (C, E) MLO-Y4 (C, E) cells were incubated for 48 hours in the presence or absence of the indicated reagents, followed by (B, C) quantitative RT-PCR and (D, E) Western blot analysis (D, E). The graphs (A-C) indicate the mean±standard deviation of the three to five samples (a)P<0.01, b)P<0.0001). CON (control), 5 mM glucose; HG (high glucose), 100 mM glucose; H2O2, 1 mM H2O2; NAC, 20 mM N-acetylcysteine; GAPDH, glyceraldehyde 3-phosphate dehydrogenase; RT-PCR, reverse transcription-polymerase chain reaction.
 XML Download