

 PDF
PDF ePub
ePub Citation
 Print
Print


INTRODUCTION
Statistical methodology plays a critical role in the design of scientific studies, analysis of scientific data, interpretation of results, and drawing of conclusive statements. Therefore, appropriate statistical reasoning is gaining increasing importance in the field of scientific research. As misused statistics and inadequate interpretation may lead to an erroneous conclusion of a scientific study, many previous studies have investigated the occurrence of statistical errors in various fields of scientific health research [1,2,3,4]. Frequent statistical errors were found in procedures for calculating the sampling size, checking the assumptions of statistical methods, and confirming the independence in a traditional analysis. In an effort to solve such problems, the International Committee of Medical Journal Editors formulated important basic guidelines related to statistical analysis, stating that authors should provide a sufficient amount of detail of a statistical analysis to enable a reader to verify the reported results and that they need to apply appropriate indicators of measurement errors or uncertainty. Further, they recommended specifying the computer programs used [5]. Moreover, the consolidated standards of reporting trials (CONSORT), which have been developed to improve the quality of reporting randomized clinical trials, require the authors to clarify the methods of sample size calculation, the statistical methods used to compare groups for primary and secondary outcomes, and the methods used for additional analyses such as subgroup analysis and adjusted analysis [6].
With respect to the trend of statistical analysis methods, Altman [7] summarized 13 studies that had reviewed the quality of statistics in medical journals from 1966 to 1996 and found that the percentage of acceptable papers from a statistical viewpoint increased from only 10% to 61% in thirty years. Moreover, medical researchers' general understanding of basic statistical methods, such as the t-test or the chi-square test, had improved during the thirty-year period [7]. A considerable increase in the use of statistics and a much greater use of complex statistical methodology have been detected in medical research [7], while an increase in the use of complex methods including multivariate or specific methods was not detected in dental research between 1996 and 2006 [8]. In the field of dentistry, generally, aggregate data at the subject level are used for a statistical analysis, while the data collection unit is each tooth or surface (mesial, distal, etc.), which is an important reason that complex statistical methodologies have not been used frequently in the field of dentistry. Some dental data are not easily applicable by using a simple traditional statistical methodology. This could be attributed to one or more of the following factors: multiple observations from a person; reliability problem of measures; frequent ordinal data such as gingival bleeding index or oral hygiene index; count data whose distribution is non-normal such as number of caries teeth; and repeated measurements to measure improvement by intervention or treatment. These are specific conditions where complex analysis methods such as mixed effect modeling or nonparametric statistical methods need to be applied instead of traditional simple parametric methods.
The main purposes of this study were to assess the trend of the application of statistical methods including parametric and nonparametric methods and to evaluate the use of complex statistical methodology in recent periodontal studies. We analyzed studies published in the Journal of Periodontal & Implant Science (JPIS) to evaluate the recent trend of using statistical methods in scientific research.
MATERIALS AND METHODS
Selection of articles
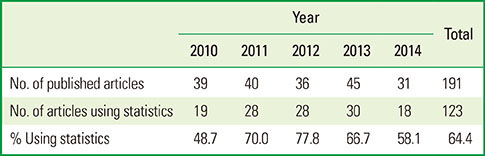
In this study, we collected 191 articles published in the JPIS between 2010 and 2014. Among them, studies including any statistical method were selected; this led to the selection of a total of 123 articles (64.4%) published in JPIS.
Methods
Categorization of studies that used statistical methods
Among 191 articles published in JPIS, studies were categorized according to whether any type of statistical method was used or not. Further, the number of statistical methods applied was counted.
Categorization of type of statistical techniques applied
The statistical techniques applied were categorized into parametric methods and nonparametric methods. Parametric methods were subdivided into 'simple methods,' including one-way or multiway analysis of variance (ANOVA), independent and paired t-test, Pearson correlation, chi-square test, and 'complex methods,' including regression, logistic regression, repeated measures ANOVA, mixed model, Cox regression, generalized linear model (GLM), Poisson regression, analysis of covariance (ANCOVA), and Mantel-Haenszel chi-square method. Nonparametric methods consisted of Mann-Whitney U-test, Wilcoxon signed-rank test, Kruskal-Wallis test, Fisher exact test, and Spearman correlation. When multiple statistical techniques were used in a study, each method was counted separately.
RESULTS
Frequency of statistical methods
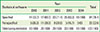
One hundred twenty-three articles (64.4%) published in JPIS between 2010 and 2014 used one or more statistical methods (Table 1). Since 2011, the percentage of articles using statistics in JPIS has increased to more than 55% as compared to 48.7% in 2010. On average, the number of statistical techniques used in JPIS was about 1.72. The number of statistical techniques used in JPIS articles increased consistently from 2011 to 2014 (Table 2).
Types of statistical methods: parametric methods
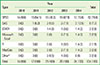
Based on the multiple counting of statistical methods, there were 121 cases (61.1% of the total of 198 cases considered) applying parametric statistical methods in JPIS articles during the period investigated. One-way or factorial ANOVA and independent t-test were the most frequently used parametric tests; 62.8% of JPIS articles used either of these two methods (Table 3). The paired t-test, Pearson correlation, and chi-square test comprised around 10% of all parametric methods used in JPIS. The frequency of parametric methods such as regression and logistic regression was about 4% and 1%, respectively, in JPIS. Among the articles published in JPIS, none of the following methods were found: repeated measures ANOVA, mixed model, GLM, Poisson regression, Mantel Haenszel chi-square test, and ANCOVA. In JPIS, complex statistical methods were used in only 6 of the published studies (5.0%).
Types of statistical methods: nonparametric methods
Based on multiple counting, 77 cases (38.9% of the 198 cases considered) of nonparametric statistical methods were found during the investigated period (Table 4). The most frequent nonparametric methods used were Mann-Whitney U-test, Wilcoxon signed-rank test, and Kruskal-Wallis test. The summed percentage of the use of these three methods among the JPIS articles considered was 74.1% of all nonparametric methods. Spearman correlation analysis comprised 10.4% of all nonparametric methods reported in the considered articles. The percentages of Fisher exact test and Kolmogorov-Smirnov test were 7.8% and 5.2% in the articles considered. The McNemar test was not used in any of the studies considered.
Types of statistical software packages
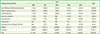
Among the published studies that used statistical analysis, 76.4% provided the details of the statistical software packages used for analysis (Table 5). More than 20% did not provide any details of the statistical software used. However, in JPIS, a remarkable reduction in the percentage of articles not reporting the software used was detected between 2010 (26.3%) and 2014 (0.0%). The SPSS (SPSS Inc., Chicago, IL, USA) was predominantly used in the studies considered (78.8%). In JPIS articles, SAS (SAS Institute Inc., Cary, NC, USA) and STATA (StataCorp LP., College Station, TX, USA) were used in less than 10% (7.7% and 2.9%) of the studies. Recently, MedCalc (MedCalc, Ostend, Belgium) has been used in a few studies published in JPIS (Table 6).
DISCUSSION
The results of this study showed a trend of increasing application of statistical methods and increasing use of nonparametric methods in recent periodontal studies in Korea. The percentage of studies using statistics published in JPIS between 2010 and 2014 was 64.4%, which is higher than the 19.3%, 49.0%, and 63.1% in periodontal studies published in Korea during the periods of 1973-1989, 1990-1999, and 2000-2006, respectively [9,10]. Therefore, there was a trend towards increasing use of statistical applications. In prosthodontics research in Korea, around 70% of the studies have reported the use of statistics [11,12]; similarly, around 70% of medical research studies have reported the use of statistics [4]. With respect to the type of statistical methods used in the studies we considered, the percentage of studies using parametric and nonparametric methods was 61.1% and 38.9%, respectively. The percentage of parametric methods was slightly lower than the percentage of parametric methods (>75%) used in periodontal studies published in 1973-1999 and 2000-2006, in orthodontic and prosthodontic research published in 1999-2003 [11,12,13]. 'Simple' parametric methods such as ANOVA, t-test, Pearson correlation, and chi-square test comprised 95% of all parametric methods used in studies published in JPIS. Complex methods including regression, mixed model, and Cox regression were used in about 5% or less of the studies published in JPIS or in other Korean dental research areas [11,12,13].
Sterne et al. [14] argued that there were five particular problems in analyzing data from periodontal research: multiple measurements made in each subject, the large magnitude of measurement error as compared to the changes in the attachment level, the analysis of longitudinal studies, the lack of measures of the instantaneous rate of attachment loss, and controversies over the nature of progression of the disease. Some data arising from periodontal research were difficult to analyze with standard statistical methods. Common response variables in periodontal research are the loss of connective tissue attachment measured using a periodontal probe, the measures of gingival inflammation, or alveolar bone levels measured by radiography of each tooth. However, common explanatory variables such as gender, age, or smoking habits are measured at the subject level. Therefore, modeling site-level responses to explanatory subject characteristics causes problems of nonindependence of sites within the same subject [14]. Therefore, applying complex analytic techniques that could reflect these data structures is needed. To reduce errors in the measurement of periodontal attachment and improve the precision of estimates, the attachment levels were measured using special instruments such as pressure probes, automated probes, and electronic probes.
Evaluation of the distribution of a dependent variable is critical in choosing the appropriate analytic method. In general, traditional parametric analysis requires data to meet basic assumptions such as normal distribution or equal variances. Therefore, the distribution of a continuous dependent variable needs to be assessed before applying such parametric methods. If the assumptions are not met, the researcher should consider the transformation of the dependent variable or choose an appropriate alternative analytic method such as a nonparametric method. In the field of dentistry, ordinal variables such as plaque index, gingival index, and periodontal disease index are used frequently. Sometimes, inattentive researchers neglect to check the nature of variables and erroneously apply parametric methods based on the assumption of normal distribution to ordinal outcome variables. As an inappropriate application of analytic methods may lead to false conclusions, researchers should be careful in selecting the appropriate analytic method.
In conclusion, we found an increasing trend towards the application of statistical methods and nonparametric methods in recent periodontal studies and thus, have concluded that increased use of complex statistical methodology may be preferred by researchers.
 XML Download