

 PDF
PDF ePub
ePub Citation
 Print
Print


INTRODUCTION
Regulatory T cells (Tregs), expressing CD4, CD25, and forkhead/winged helix transcription factor p3 (Foxp3), are key regulators of the immune response [1,2]. The mechanism of Treg action is unclear, but these cells are important for controlling a wide range of immune-mediated pathologies, including autoimmunity, colitis, and chronic infections [3,4]. Among the many types of Tregs reported thus far, naturally occurring CD4+ CD25+ Tregs have been the main focus of current research because accumulating evidence suggests that this population plays a key role in the maintenance of immunological self-tolerance and the negative control of pathological and physiological immune responses [5]. Therefore, a congenital deficiency of this population results in serious impairment of self-tolerance and immunoregulation, leading to severe autoimmunity, immunopathology, and allergy in humans [6]. Indeed, Tregs are deficient in patients with multiple sclerosis, type 1 diabetes, rheumatoid arthritis, and other autoimmune diseases [7,8,9].
The transcriptional factor Foxp3 appears to be a master control gene for the development and function of natural CD4+ CD25+ Tregs [1]. Mutations in the Foxp3 gene cause rapidly fatal X-linked lymphoproliferative disease (scurfy) in mice [10]. Similarly, mutations in the human ortholog of Foxp3 result in aggressive, fatal lymphoproliferative disorders, such as immune dysregulation, polyendocrinopathy, enteropathy and X-linked syndrome [11,12]. Fontenot et al. [13] reported that Foxp3 is specifically required for CD4+ CD25+ regulatory T-cell development and is sufficient to activate a suppressor function in peripheral nonregulatory CD4+ T cells.
Inflammatory periodontal diseases are associated with chronic inflammation, resulting in the destruction of the periodontal ligament and bone. In periodontal patients, elevated inflammatory biomarkers can contribute to the perpetuation of atherosclerotic cardiovascular disease [14]. Furthermore, the microbial components responsible for a periodontal infection can trigger the development of various autoimmune diseases [15].
The concept of molecular mimicry was recently introduced, where the antigenic components of infectious pathogens mimicking the structures of the autoantigens in human tissues can induce either effector T cells (Teffs) or Tregs depending on their nature [16,17,18]. Based on this concept, cellular therapeutics have attracted considerable interest in regulating or suppressing pathogen-triggered autoimmune diseases or cancer [19,20]. Recently, Choi and Seymour [21] introduced the concept of a vaccine trial based on the hypothesis that an array of synthetic peptides from pathogenic organisms might be capable of inducing antigen-specific Tregs for suppressing the development of autoimmune diseases, such as atherosclerosis, type 1 diabetes, or rheumatoid arthritis.
Dendritic cells (DCs) are highly specialized antigen-presenting cells (APCs) with the unique capacity to establish and control the primary immune responses. In their immature state, DCs reside in the peripheral tissues, where they capture and process antigens for presentation in the context of major histocompatibility complex molecules [22]. Recently, DCs have been recognized for their role in the differentiation of naive T cells and are believed to play an important role in the generation of Treg cell responses. In mice, the DCs from the lamina propria, Peyer's patches, or mesenteric lymph nodes (MLN) can drive the differentiation of Treg cells [23,24].
Furthermore, the DCs present in gut-associated lymphoid tissue possess several functional specializations suggesting that they might be capable of inducing regulatory-type responses [25,26]. Remarkably, the integrin chain, CD103, was recently shown to identify DCs that are important for maintaining the proper ratio of Tregs to effector cells and avoiding autoimmune colitis [27]. Recent evidence suggests that only a subset of MLN DCs, which express CD103, are efficient in inducing gut-homing receptors on responding T cells and Foxp3+ T-cell differentiation [23,24]. Another study reported that CD103-deficient mice were unable to mediate the suppression of colitis by wild-type regulatory T cells, suggesting that the CD103+ DCs in mice are essential for the suppression of colitis [28].
Therefore, this study was performed to develop a strategy for promoting the conversion of T cells into peptide-specific CD4+CD25+ Foxp3+ Tregs by introducing the peptides of the heat shock protein (HSP)60 from Porphyromonas gingivalis, a major periodontal pathogen, into the CD103+ DCs derived from human peripheral blood mononuclear cells (PBMCs).
MATERIALS AND METHODS
Preparation of APCs from PBMCs and the generation of DCs
PBMCs were isolated from 10 healthy subjects by density gradient centrifugation using a Ficoll-Paque Plus (Amersham Biosciences, Saclay, France). For use as APCs, the PBMCs were treated with mitomycin (50 µg/mL) at 37℃ for 20 minutes.
Monocyte-derived DCs (MoDCs) were generated from CD14+ monocytes. Briefly, monocytes were purified by positive selection with anti-CD14 coupled to magnetic beads (Miltenyi, Bergisch Gladbach, Germany). To obtain immature DCs, the CD14+ cells were incubated for 6 days in complete medium (Rosewell Park Memorial Institute 1640, 100 U/mL penicillin, 100 g/mL streptomycin, and 10% fetal bovine serum) containing 50 ng/mL of granulocyte-monocyte colony-stimulating factor (R&D Systems, Minneapolis, MN, USA) and 20 ng/mL of interleukin (IL) 4 (R&D Systems), and with or without 1µM all-trans retinoic acid (RA; Sigma-Aldrich Co., St. Louis, MO, USA). The morphology of the DCs was examined by optical microscopy. The study was approved by the Institutional Review Board of Pusan National University Hospital. Informed consent for the surgical procedure was obtained from all patients.
Isolation of CD3+ T cells
Human CD3+ T cells were isolated from PBMCs by immunomagnetic selection using anti-CD3 coupled to magnetic beads. The purity of the CD3+ T cells was greater than 95%, as assessed by flow cytometry.
Synthetic peptide
Peptide numbers 14 and 19 (each consisting of 20 amino acids) from the entire HSP60 sequences of P. gingivalis as published and peptide number 19 of Streptococcus sanguinis HSP60, respectively, were synthesized by Fmoc solid-phase peptide synthesis using an ASP48S (Peptron Inc., Daejeon, Korea) (Table 1). The peptides were purified by reverse phase high-performance liquid chromatography (HPLC) using a Vydac Everest C18 column (Grace Vydac, Hesperia, CA, USA). Elution was carried out with a water/acetonitrile linear gradient (10%-75% (v/v) of acetonitrile) containing 0.1% (v/v) trifluoroacetic acid.
Coculture of peptides and DCs with CD3+ T cells
The PBMCs and MoDCs were washed extensively with Dulbecco's phosphate buffered saline (PBS; Invitrogen, Grand Island, NY, USA), and cocultured in complete medium with T cells (2×10⁵/well) at a 1:10 ratio in 96-well round-bottom plates (Corning Costar, Corning, NY, USA) and exogenous IL-2 (50 U/mL; eBioscience Inc., San Diego, CA, USA) in the presence of each synthetic peptide (10 g/mL). The coculture was maintained for 2 weeks with alternating stimulating and resting cycles. For the control experiment, PBS was added to T cells for coculture with PBMCs and MoDCs.
Flow cytometry analysis
Cultured T cells were incubated with fluorescently-labeled antibodies to CD4 and CD25, and with CD103, for 20 minutes at 4℃. After staining, the cells were washed, fixed, and permeabilized using a Cytofix/Cytoperm solution (BD Biosciences, San Jose, CA, USA) at room temperature for 20 minutes, rewashed with Perm Wash Buffer (BD Biosciences), and stained at the intracellular level with fluorescent-labeled antibodies to Foxp3 for 30 minutes at 4℃. The stained cells were acquired with a FACSCalibur flow cytometer and analyzed using CELLQuest software (BD Biosciences). All antibodies were purchased from eBioscience.
RESULTS
Promoting peptide-specific Tregs by conventional PBMCs and DCs as APCs
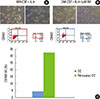
In case for peptide 14 of P. gingivalis HSP60, the mean proportion of Tregs were 13.5%±14.2% when the DCs were used as APCs, while it was 3.3%±4.3% when PBMCs were used for APCs in ten subjects (Fig. 1C). The mean percentage of peptide 14-specific Tregs of 10 subjects was statistically significant difference between PMBCs and DCs (P<0.05). In the case of peptide number 19 from P. gingivalis HSP60, the values were 14.1%±15.3% when DCs was used as APCs, while it was 4.2%±6.6% (Fig. 2C) when PBMCs were used for APCs. The mean percentage of peptide 19-specific Tregs of 10 subjects was not statistically significant difference between PMBCs and DCs. When DCs were pulsed with peptide number 19 from S. sanguinis HSP60 in one subject, the value increased from 0.05% to 17.02% when PBMCs were used as the APCs (Fig. 3).
Effect of RA on the phenotype and expression of CD103+ DCs
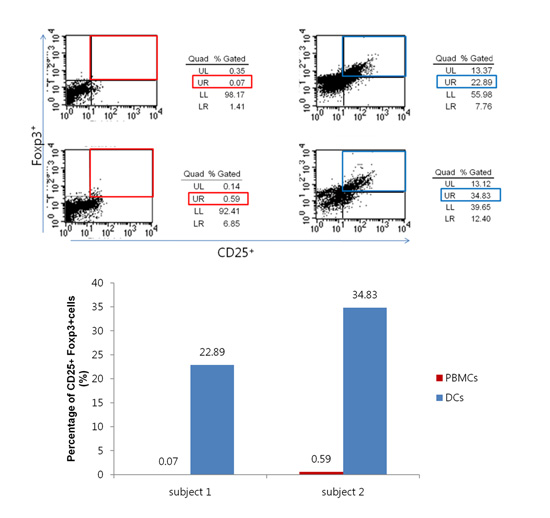
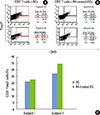
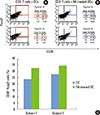
RA has been reported to stimulate the expression of CD103 by DCs when added to the culture medium after culturing the DCs for 6 days. As shown in Fig. 4, the morphology of the DCs exhibited the typical extension of dendritic processes characteristic of maturing DCs. The CD103+ cells were increased from 4.28% to 32.67%. This characteristic phenotype expression occurred in parallel with its functional capability of inducing Tregs. After adding RA, the percentage of induced Tregs increased from 21.12% to 22.89% in subject 1, and from 27.73% to 34.46% in subject 2 for peptide number 19, respectively (Fig. 5). In case of peptide 14, it increased from 23.70% to 32.54% in subject 1 and from 27.57% to 34.83% in subject 2 (Fig. 6). There were no statistical differences in Tregs stimulated by DCs and RA-stimulated DCs for both peptide 19 and 14.
DISCUSSION
The tolerizing effect conferred by antigen-specific Tregs has been of interest to both immunologists and clinicians in their attempts to suppress pathogen-triggered autoimmune diseases. The emerging concept that a periodontal infection might predispose a patient to the development of cardiovascular diseases has prompted the suggestion that HSP60 of P. gingivalis might play a role in modulating the immunopathologic process by either triggering or suppressing the Teffs through mobilizing Tregs [29]. Van Eden et al. [30] reported that HSP60 can be a target for molecular mimicry, and identifying a candidate T-cell epitope capable of inducing immunological tolerance might provide an opportunity for antigen-tailored therapy against infectious diseases or infection-triggered autoimmune disease, such as atherosclerosis.
Strategies for in vitro or in vivo augmenting (or expanding) the Tregs for use in immunotherapy against autoimmune diseases have been devised [31]. One of these has been to pulse the immunodominant epitope of the pathogenic antigens into CD103+ immature DCs, as APCs, which have a tolerizing effect on pathogenic Teffs [27]. In this experiment, the DCs pulsed with peptide number 19 or 14 profoundly stimulated the development of Tregs, regardless of the peptide number used. This is consistent with another study that reported on the capability of expanding CD4+CD25+ T cells [32].
Lohr et al. [33] claimed that although there may not be special conditions for antigen stimulation in the development of effect and regulatory cell populations, different subsets of DCs might induce these T-cell populations. transforming growth factor-β together with a subpopulation of CD103+ DCs was reported to promote the differentiation of Teffs to Foxp3+ Tregs [23].
In this study, peptide number 19 from P. gingivalis HSP60 exhibited a minimal ability to induce Tregs when PBMCs were used as APCs, which was confirmed in previous observations [34]. In the present experiment, peptide number 14 from P. gingivalis HSP60 exhibited a comparable capability to induce Tregs when PBMCs were used as APCs to peptide number 19. The peptide has been identified as an immunodominant epitope both for T and B cells in periodontitis patients, while not for atherosclerosis patients, despite the high sequence homology shared with their human counterpart (unpublished observations). Therefore, this peptide has the potential for development as a vaccine to suppress autoimmunity without eliciting cross-reactive immune responses with human autoantigens.
DCs have the ability to enhance the induction of Tregs by both peptide numbers 19 from P. gingivalis HSP60 and S. ganguinis HSP60 and peptide number 14 from P. gingivalis HSP60. However, the promotion of Tregs by the DCs was not greater for peptide 14 than by PMBCs. However, it was not the case for peptide number 19. Thus, CD103+ DCs seem to promote the antigen-specific Tregs in an antigen-dependent manner when compared with those observed by PMBC. This contrasts with our most recent observation that CD103+ DCs promoted Tregs in an antigen nondependent manner in an experimental mouse model [35].
One of the aims of this study was to determine whether peptide number 19 from S. sanguinis HSP60 can induce Tregs because commensal or probiotic bacteria induce Tregs to suppress autoimmune diseases or intestinal colitis [36]. Nevertheless, this phenomenon was not observed, presumably due to its inability to induce regulatory T cells, as observed in the case of P. gingivalis. Peptide number 19 cross-reacts with its human counterpart and HSPs from other bacteria. Future studies should examine the enhanced induction of Tregs by peptide number 14 from S. sanguinis HSP60.
In the present study, the development of Tregs was enhanced when the epitope peptides were introduced into DCs as APCs. This effect appeared to be anticipated consistently regardless of the epitope peptide sequences, despite slight differences by sequence. With the additional strategy of expanding the number of Tregs in vitro, this promising result would provide a venue for prospective cell-based immunotherapy in modulating infection-induced autoimmune diseases. Antigen-specific Tregs, once induced by a specific antigen, exhibit an antigen-nonspecific immune suppressive effect. Nevertheless, the importance of antigen- or organ-specific Treg therapy is being increasingly emphasized [1].
In the intestines, CD103+ DCs have the unique ability to induce adaptive Tregs because of their ability to produce RA, which is needed to stimulate naïve T cells to differentiate into Foxp3-expressing Tregs [4]. This phenomenon was confirmed in the present experiment. RA stimulates the development of mature DCs with the enhanced expression of CD103+ DCs with the typical extension of dendritic processes characteristic of mature DCs, which can again drive the naïve T cells into Tregs [37,38]. The enhanced expression of CD103 was associated with its functional capability of stimulating antigen-specific Tregs.
Overall, within the context of this experiment, CD103+ DCs have the potential to stimulate peptide-specific Tregs, which can be utilized further in the customized cell-based vaccine therapy against infection-induced autoimmune diseases, such as atherosclerosis and rheumatoid arthritis.
In conclusion, CD103+ DCs can stimulate the differentiation of antigen-specific Tregs from naïve T cells, when used as APCs for an epitope peptide from a periodontal pathogenic organism. RA is an effective reagent that induces mature DCs with the typical phenotypic expression of CD103, and enhanced their functional ability to stimulate Tregs.

 XML Download