Journal List > J Periodontal Implant Sci > v.44(4) > 1082419

Martinez, Koury, Martins, Nogueira, Fischer, Gustafsson, and Figueredo: Serum level changes of long chain-polyunsaturated fatty acids in patients undergoing periodontal therapy combined with one year of omega-3 supplementation: a pilot randomized clinical trial

Abstract

Purpose

We aimed to investigate the impact of nonsurgical periodontal treatment combined with one-year dietary supplementation with omega (ω)-3 on the serum levels of eicosapentaenoic acid (EPA), docosahexaenoic acid (DHA), docosapentaenoic acid (DPA), and arachidonic acid (AA).

Methods

Fifteen patients with chronic generalized periodontitis were treated with scaling and root planing. The test group consisted of seven patients (43.1±6.0 years) supplemented with ω-3, consisting of EPA plus DHA, three capsules, each of 300 mg of ω-3 (180-mg EPA/120-mg DHA), for 12 months. The control group was composed of eight patients (46.1±11.6 years) that took a placebo capsule for 12 months. The periodontal examination and the serum levels of DPA, EPA, DHA, and AA were performed at baseline (T0), and 4 (T1), and 12 (T2) months after therapy.

Results

In the test group, AA and DPA levels had been reduced significantly at T1 (P<0.05). AA and EPA levels had been increased significantly at T2 (P<0.05). The ΔEPA was significantly higher in the test compared to the placebo group at T2-T0 (P=0.02). The AA/EPA had decreased significantly at T1 and T2 relative to baseline (P<0.05).

Conclusions

Nonsurgical periodontal treatment combined with ω-3 supplementation significantly increased the EPA levels and decreased the AA/EPA ratio in serum after one year follow-up. However, no effect on the clinical outcome of periodontal therapy was observed.

Graphical Abstract

jpis-44-169-ab001

INTRODUCTION

Tissue destruction in chronic periodontitis is caused by a hyperinflammatory reaction against the biofilm. The excessive production of inflammatory cytokines, arachidonic acid (AA)-derived eicosanoids from omega-6 long chain-polyunsaturated fatty acids (ω-6 LC-PUFA), and other proinflammatory agents play a key role in stimulating irreparable damage to host tissues and therefore activating the periodontal tissue breakdown [1]. Omega-3 and ω-6 LC-PUFA-derivatives are involved in the inflammatory process: Most ω-6-derived mediators aggravate inflammation, while ω-3-derived mediators might display anti-inflammatory effects [2].
Clinical periodontal parameters, such as pocket depth and clinical attachment level (CAL), have been shown to have a significant positive correlation with LC-PUFAs [3], while experimental studies have failed to show any significant difference in the clinical outcome when ω-3 LC-PUFA supplementation and placebo groups were compared [4]. Martinez et al. [4] also showed that nonsurgical periodontal treatment significantly reduces the serum levels of LC-PUFAs. According to Sijben and Calder [5], the ω-6/ω-3 balance could be useful in the prevention and control of periodontal disease. However, only studies evaluating the effect of ω-3 LC-PUFA supplementation combined with low doses of aspirin as an adjunct to periodontal treatment have shown clinical improvements [6,7].
A lower ω-3 LC-PUFA intake associated with higher ω-6/ω-3 ratios has been observed in the Western population and might be related to a high prevalence of chronic diseases, including cancer, endometriosis, inflammatory and autoimmune diseases, cardiovascular disease, and chronic periodontitis [8,9,10,11,12]. The Food and Agriculture Organization, in collaboration with the World Health Organization (FAO/WHO) recently recommended a combined intake of ω-3 LC-PUFA derivatives: eicosapentaenoic acid (EPA) and docosahexaenoic acid (DHA). The consumption of 250 mg/day was recommended to healthy subjects for disease prevention, whereas high consumption levels, such as 3 g/day, were recommended to reduce inflammation and other cardiovascular risk factors without adverse effects in short- and intermediate-term randomized trials [13].
Omega-3 LC-PUFA supplementation has been used to increase the serum levels of ω-3 LC-PUFA, which consequently produced a positive effect on the resolution of inflammation [6]. Tong et al. [14] observed that healthy patients supplemented with 3 g/day of fish oil for 1 month showed 6.5 times higher EPA levels compared to a placebo group. Dawczynski et al. [15] showed that ω-3 LC-PUFA supplementation for 3 months significantly increased the serum levels of DHA and EPA in women with rheumatoid arthritis. We also showed that, after a period of 4 months' supplementation with ω-3 LC-PUFA, patients that received nonsurgical periodontal treatment sustained serum levels of EPA and DHA while AA was significantly reduced [4].
Since debate remains over the clinical periodontal outcomes after supplementation with ω-3 LC-PUFA and systematic reviews have suggested that longer follow-up periods are needed to confirm a beneficial effect in several diseases [16,17,18,19,20], we aimed to investigate the impact of nonsurgical periodontal treatment combined with one-year dietary supplementation with ω-3 on the serum levels of EPA, DHA, docosapentaenoic acid (DPA), and AA.

MATERIALS AND METHODS

Patient selection

All included patients were seeking treatment at the Dental School of the Rio de Janeiro State University (UERJ), Rio de Janeiro, Brazil. The participants had at least 20 teeth and were diagnosed according to the criteria described by the American Academy of Periodontology [21]. The participants had no apparent ongoing systemic disease and were not taking any medication that could affect their periodontal conditions. They had not taken antibiotics for at least six months nor had they taken nonsteroidal anti-inflammatory drugs for at least three months prior to starting the treatment in this study. Individuals taking LC-PUFA nutritional supplements were excluded. All individuals signed an informed consent prior to enrollment. The Ethics Committee of the Pedro Ernesto University Hospital (UERJ, Rio de Janeiro, Brazil) approved the study protocol (2,714/2,010). Fifteen patients with generalized chronic periodontitis (6 males and 9 females) participated in the study during 12 months. Seven generalized chronic periodontitis patients (mean age, 43.1±6.0 years) composed the test group and were treated with scaling and root planing (SRP) combined with ω-3 supplementation, three capsules/day, each of 300 mg of ω-3 (180 mg EPA/120 mg DHA; Quintaessencia, Rio de Janeiro, Brazil). The placebo group was composed of eight generalized chronic periodontitis patients (mean age, 46.1±11.6 years) who received SRP and placebo (3 capsules/day; Quintaessencia). This study was considered a pilot randomized controlled double-blind trial.

Omega-3 supplementation

All generalized chronic periodontitis patients were randomly assigned using a coin toss to receive one of the two treatments during 12 months. Each supplement capsule provided 300 mg of ω-3 (180-mg EPA/120-mg DHA: Quintaessencia). The patients in the test group were instructed to take three capsules per day comprising a total of 900 mg ω-3 per day. The patients in the placebo group received three placebo capsules per day with 450 mg of placebo (Quintaessencia). Three containers, each one containing 30 capsules, were delivered to the participants each month. Compliance was checked by the return of the empty capsule containers and by asking weekly about the supplement intake. The bottles were not decoded until all the follow-up evaluations and statistical analyses had been performed to ensure a proper double-blind study protocol. Patients also answered a questionnaire about the occurrence of stomach upsets, gastrointestinal disorders, or other adverse events.

Food frequency questionnaire and body mass index

The food frequency questionnaire (FFQ) was answered during a face-to-face interview with an experienced nutritionist. The FFQ was recorded at baseline (T0) and again at four (T1) and 12 (T2) months for test and placebo groups. The questionnaire was designed to capture the habitual food intake amongst adults, including questions concerning 30 food items, grouped together according to the Brazilian meal pattern. Items in the FFQ included an extensive list of specific sea foods and fish, plus walnuts, flaxseed, flaxseed oil, cod liver oil, and canola oil. For each item, the categories ranged from never to a number of times in each day, week, or month. The patients were instructed not to change their diet during the trial.

Nutritional status

Total body mass was measured with a portable scale to the nearest 0.1 kg. The height was measured to the nearest 0.5 cm. From the weight and height values, the body mass index (BMI) was defined as the ratio between weight in kilograms and squared height in meters (total body mass/height2). The adequacy of the BMI was determined according to the WHO Expert Committee on Physical Status (eutrophic, 18.5-24.99 kg/m2; overweight, 25-29.99 kg/m2; and obese, ≥30 kg/m2) [22].

Clinical measurements and treatment

The clinical periodontal parameters measured included the percentages of sites that bled on probing (BOP), in addition to the visible plaque index, probing depth (PD), and CAL. The PD and CAL were recorded at six sites per tooth (mesiobuccal, midbuccal, distobuccal, mesiolingual, midlingual, and distolingual), except for third molars. A periodontal computerized probe (Florida Probe, Gainesville, FL, USA) was used together with a silicone stent (1.0-mm plates) (Bio Art, São Paulo, Brazil). The measurements were recorded at T0, T1, and T2. There was an intraexaminer concordance of 98% within the interval of ±0.5 mm for the PD and CAL measurements.
After baseline examinations, patients received nonsurgical periodontal treatment, which consisted of oral hygiene instructions and supra- and subgingival debridement (SRP) under local anesthesia. The treatment was performed by an experienced periodontist (G.L.M.) with manual (Gracey and McCall curettes, Hu-Friedy, Chicago, IL, USA) and ultrasonic (Cavitron select, Dentsply, York, PA, USA) instruments. On average, the treatment took four 50-minute sessions carried out once a week. Re-evaluations were performed every four months after baseline during the 12 months.

Blood collection

The patients were instructed not to eat for 12 hours before sample collection. Blood samples (20 mL) were obtained in the morning (not later than 8 AM) by venous puncture. Four milliliters were transferred to glass tubes containing 7.2-mg K2-ethylenediaminetetraacetic acid (K2-EDTA; BD Vacutainer, Franklin Lakes, NJ, USA) for glycated hemoglobin and blood count. Another 4 mL were transferred to glass tubes with 6 mg of NaF and 12 mg Na2EDTA (BD Vacutainer) for glucose analysis. Eight milliliters were transferred to clot activator glass tubes (BD Vacutainer) for lipid profile, high-sensitivity C-reactive protein, insulin and ω-3 and ω-6 LC-PUFA (EPA, DHA, DPA, and AA). All of the samples were immediately centrifuged for 5 minutes, except the K2-EDTA, and used for immediate analysis or stored at -70℃. Blood collection was carried out at T0, T1, and T2.

Laboratory assays

Plasma glucose, triacylglycerols, total cholesterol, high-density lipoprotein cholesterol (HDL-c), low-density lipoprotein cholesterol (LDL-c), very-low-density lipoprotein cholesterol (VLDL-c), glycated hemoglobin, insulin, and leukocyte counts were measured using an automatic analyzer (DLE Medicina Laboratorial, Rio de Janeiro, Brazil). CRP levels were determined using a highly sensitive immunoturbidimetric assay (DiaSys Diagnostic Systems, Holzheim, Germany). LC-PFAs in serum were analyzed after the extraction of lipids, and oxidation was prevented by the addition of butylated hydroxytoluene. The organic phase containing total lipids was dried under nitrogen flow and the residue was methylated. LC-PUFAs in serum were analyzed by gas chromatography. The identification and quantification of gas chromatographic peaks of fatty-acid methyl esters were performed using a commercial standard (Supelco, Bellefonte, PA, USA).

Statistical analysis

Age and BMI are presented as mean and standard deviation, while the other data are presented as median and interquartile range (IQR). Clinical data were obtained from six sites per tooth in each patient at baseline and after periodontal therapy, at 4 and 12 months, and the median and IQR were calculated in the percentage of sites from different consumption frequency categories in each group at each point in time. The categories were grouped according to their PDs into ≤3 (shallow), 4-5 (moderate), and ≥6 (deep) mm and CAL into -1, 2-4, and ≥5 mm. The significance of differences between groups was calculated using the Mann-Whitney U-test. The significance of differences between groups by gender, race, and smoking status were tested using Fisher exact test. The significance of changes (Δ=final value-initial value) in clinical, biological blood, and LC-PUFA serum data by the point in time were determined using the Wilcoxon rank sum test for each group. P-values <0.05 were considered to be significant. The correlation between clinical variables and serum levels of LC-PUFA were calculated with Spearman rho correlation coefficient. The statistical analyses were performed using IBM SPSS Statistics ver. 19.0 (IBM Co., Armonk, NY, USA).

RESULTS

Demographic data and clinical outcome

The demographic data indicated that both groups were similar regarding age, gender, smoking, race, and BMI (Table 1). The mean BMI was 27.9±2.4 and 27.5±3.3 kg/m2 in the test and placebo groups, respectively. All the participants were classified as overweight (BMI, 25-29.99 kg/m2), except one patient in the test group who was eutrophic (BMI, 23.6 kg/m2), and two patients in the placebo group, one on whom was eutrophic (BMI, 20.6 kg/m2) and other obese (BMI, 31.4 kg/m2). The FFQ showed that the estimated intake of ω-3 LC-PUFA was lower than the 250 mg/day (DHA+EPA) recommended by the FAO/WHO for both groups before the study. Therefore, the groups were considered to be homogeneous in relation to the habitual intake of ω-3 LC-PUFA (data not shown).
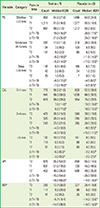
The clinical periodontal parameters, percentage of sites from categories grouped according to their PDs into ≤3 (shallow), 4-5 (moderate), and ≥6 mm (deep), and CAL into 0-1, 2-4, and ≥5 mm, VIP, and BOP, showed that there were no significant differences between test and placebo groups at T0. The PD and CAL had improved significantly in both groups after nonsurgical periodontal treatment at T1 and T2. The percentage of BOP-positive sites had fallen significantly in the placebo group at T1 and T2. No significant differences in clinical periodontal parameters were found between the test and placebo groups after nonsurgical periodontal treatment at T1 and T2 (Table 2).

LC-PUFA serum levels

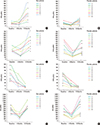
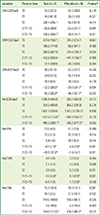
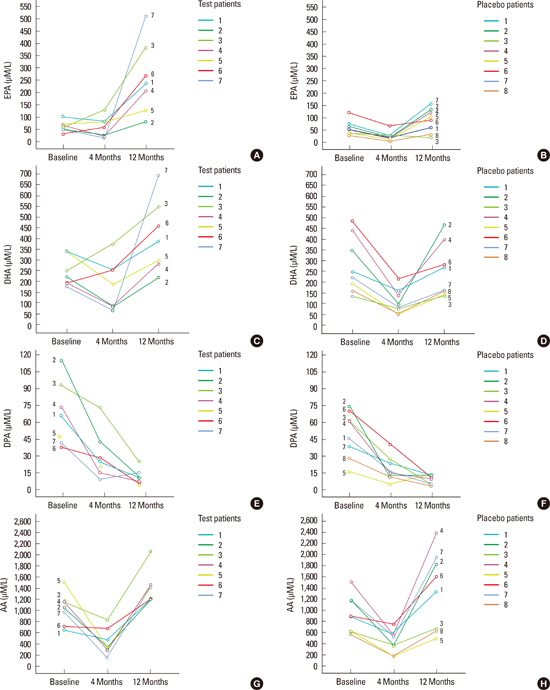
At baseline, no significant differences in DHA, DPA, EPA, or AA were observed between the groups. After four months, the test group showed a significant reduction in DPA and AA (P<0.05). The placebo group showed a significant reduction in DHA, DPA, EPA, and AA at T1 (P<0.05). No significant differences were found between the test and placebo groups in ΔDHA, ΔDPA, ΔEPA, or ΔAA at T1-T0 (Table 3, Fig. 1).
After 12 months, EPA and AA had increased significantly, whereas DPA had decreased significantly compared to T0 in the test group (P<0.05). The placebo group showed a significant reduction in DPA and a significant increase in AA at T2 compared to T0 (P<0.05). The ΔEPA was significantly higher in the test compared to the placebo group at T2-T0 (P=0.021). No significant differences were found in ΔDHA, ΔDPA, or ΔAA at T2-T0 between the test and placebo groups (Table 3, Fig. 1). The ΔCAL showed a significant positive correlation with the ΔDPA level at T1 and T2 (r=0.7, P=0.01). The other parameters did not show any significant correlation (data not shown).
Regarding the ratios, no significant differences between the test and placebo groups in AA/EPA, AA/DHA, and AA/DPA at baseline were observed. In the test group, the AA/EPA and AA/DHA ratios had been reduced significantly at T1 (P<0.05). However, in the placebo group, the AA/DHA and AA/EPA ratios had increased significantly at T1 (P<0.05). After 12 months, in the test group, the AA/EPA ratio had decreased significantly, whereas AA/DPA had increased significantly compared to T0 (P<0.05). In the placebo group, the AA/DHA and AA/DPA ratios had increased significantly compared to T0 (P<0.05). The ΔAA/EPA and ΔAA/DHA ratios had decreased significantly in the test compared to the placebo group at T1-T0 (P=0.001) and T2-T0 (P<0.05) (Table 3, Fig. 2).

Biological blood parameters

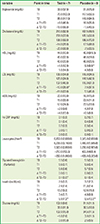
Similar biological blood parameters were observed between the test and placebo groups at T0. The test group showed a significant reduction in LDL level at T1 (P<0.05). The placebo group showed a significant increase in HDL level at T1 (P<0.05). After 12 months, the insulin level had increased significantly both in the test and placebo groups (P<0.05). In contrast, glycated hemoglobin had increased significantly only in the test group (P<0.05). No differences in the change in biological blood parameters were found between the test and placebo groups at T1-T0 and T2-T0 (Table 4).

DISCUSSION

In the present study, supplementation significantly increased the EPA level and decreased the AA/EPA ratio in serum after one year of nonsurgical periodontal therapy. However, this change in serum levels had no effect on the clinical outcome of the periodontal treatment. Our finding of higher serum levels of EPA is in agreement with several earlier studies in both healthy subjects and in patients with renal disease or rheumatoid arthritis [7,8,23]. High serum EPA is important to stimulate the expression of EPA-derived resolvin E1, a well-known proresolving lipid mediator very important during the inflammatory resolution process [24].
The AA/EPA ratio reached mean levels of 7:1 in the test group, which is quite similar to the one found in populations with a Mediterranean diet [25]. On the other hand, this ratio remained very high in the placebo group (18:1). Experimental evidence indicates that the optimum ratio between ω-6 and ω-3 should be close to 4:1-5:1, and not exceeding 10:1 for the promotion of health and longevity [26,27,28,29].
The clinical analysis of periodontal status failed to demonstrate any difference between test and placebo groups even after one year of dietary ω-3 LC-PUFA supplementation, which is in agreement with our previous results [4] and with Rosenstein et al. [30], both with a shorter period of supplementation.
We were not able to find significant differences between the groups regarding any of the blood parameters measured. However, the test group showed a significant reduction in LDL level at T1, and increased insulin and glycated hemoglobin after 12 months. Our results are somewhat in agreement with previous studies that have reported an unfavorable effect or no effect of ω-3 PUFA on glucose metabolism [31,32]. Others have shown that DHA supplementation increases HDL and LDL, and reduces triglyceride [33,34].
Our present study does not support the concept of dietary supplementation with ω-3 in order to improve clinical healing after periodontal therapy. It is possible that the outcome of periodontal treatment is mainly dependent on local conditions. The additional anti-inflammatory effect of the ω-3 PUFA might be so small that it was not clinically measurable, or perhaps for clinical observations a greater sample size could have provided more consistent evidence. Although it is quite difficult to follow a greater number of patients for a long period, the present pilot study might encourage more investigations in this field. There are two earlier studies reporting a clinical effect but both studies combined the ω-3 PUFA with low doses of aspirin [6,7], which changes the main object of the study from supplementation to a more complex situation including medication.
In conclusion, nonsurgical periodontal treatment combined with ω-3 supplementation significantly increased the EPA levels and decreased the AA/EPA ratio in serum after one year follow-up. However, no effect on the clinical outcome of periodontal therapy was observed.

Figures and Tables

Figure 1
The omega (ω)-3 and ω-6 long chain-polyunsaturated fatty acids (µM/L) serum levels for patients in placebo and test groups at baseline, four, and 12 months are presented. Eicosapentaenoic acid levels (EPA) in test (A) and in placebo group (B). Docosahexaenoic acid (DHA) levels in test (C) and in placebo group (D). Docosapentaenoic acid (DPA) levels in test (E) and in placebo group (F). Arachidonic acid (AA) levels for patients in test (G) and in placebo (H) group.
jpis-44-169-g001
Figure 2
The omega (ω)-6/ω-3 and arachidonic acid (AA)/LALC-PUFA ratio in serum levels (µM/L) for patients in placebo and test groups at baseline, four, and 12 months are presented. AA/eicosapentaenoic acid levels (EPA) serum levels in test group (A) and in placebo group (B). AA/docosahexaenoic acid (DHA) serum levels in test group (C) and in placebo group (D). AA/docosapentaenoic acid (DPA) serum levels in group test (E) and in placebo group (F).
jpis-44-169-g002
Table 1
Demographic data in test and control groups at baseline.
jpis-44-169-i001
Variable Test Placebo
GCP patient 7 8
Gender
 Malea) 3 3
 Female 4 5
Ageb) (year), mean ± SD 43.1 ± 6.0 46.1 ± 11.6
Race
 Whitea) 3 6
 Non-White 4 2
Smoking
 Smokera) 0 1
 Nonsmoker 7 7
BMIb) (kg/m2), mean ± SD 27.9 ± 2.4 27.5 ± 3.3

GCP: generalized chronic periodontitis, SD: standard deviation, BMI: body mass index.

a)No differences were found between the groups using Fisher exact test. b)No differences were found between the groups using the Mann-Whitney U-test.

Table 2
The median (IQR) in the percentage of sites from different categories in the test and placebo groups at baseline (T0), 4 months (T1), and 12 months (T2).
jpis-44-169-i002
Variable Category Point in time Test (n=7) Placebo (n=8)
Count Median (IQR) Count Median (IQR)
PD Shallow (≤3 mm) T0 953 64.0 (27.0) 1,098 63.5 (24.5)
T1 1,211 91.0 (16.0) 1,377 93.5 (10.5)
T2 887 89.0 (7.0) 1,212 93.0 (6.5)
Δ T1-T0 19.0 (16.0)* 20.5 (17.5)*
Δ T2-T0 21.0 (25.0)* 25.0 (18.0)*
Moderate (4-5 mm) T0 287 17.0 (11.0) 318 28.0 (20.5)
T1 134 7.0 (9.0) 120 5.5 (9.0)
T2 101 9.0 (3.0) 80 6.0 (5.5)
Δ T1-T0 -6.0 (10.0)* -11.5 (14.0)*
Δ T2-T0 -5.0 (14.0)* -17.0 (13.5)*
Deep (≥6 mm) T0 145 8.0 (18.0) 105 6.0 (7.5)
T1 40 2.0 (8.0) 24 1.0 (2.5)
T2 25 1.0 (5.0) 7 0.0 (1.0)
Δ T1-T0 -8.0 (12.0)* -4.5 (6.0)*
Δ T2-T0 -7.0 (19.0)* -5.5 (8.5)*
CAL 0-1 mm T0 772 56.0 (21.0) 820 52.5 (28.0)
T1 941 68.0 (30.0) 1,038 68.5 (30.5)
T2 673 69.0 (29.0) 954 75.0 (29.5)
Δ T1-T0 7.0 (11.0)* 13.0 (13.0)*
Δ T2-T0 8.0 (17.0)* 16.0 (15.5)*
2-4 mm T0 423 28.0 (15.0) 560 39.5 (19.0)
T1 326 28.0 (14.0) 395 26.0 (26.5)
T2 243 23.0 (22.0) 285 20.0 (20.5)
Δ T1-T0 -4.0 (10.0) -9.0 (9.5)*
Δ T2-T0 -6.0 (16.0) -15.5 (11.5)*
≥5 mm T0 190 10.0 (12.0) 141 8.5 (9.0)
T1 118 6.0 (5.0) 88 4.0 (8.0)
T2 97 8.0 (7.0) 60 4.0 (9.5)
Δ T1-T0 -6.0 (8.0)* -2.0 (4.5)*
Δ T2-T0 -3.0 (9.0)* -2.0 (2.5)*
VPI T0 878 65.0 (54.0) 858 65.0 (14.5)
T1 697 51.0 (18.0) 730 45.0 (48.5)
T2 463 40.0 (36.0) 608 49.0 (35.0)
Δ T1-T0 -15.0 (54.0) -26.0 (59.0)
Δ T2-T0 -18.0 (50.0)* -14.5 (18.0)*
BOP T0 293 13.7 (30.0) 227 20.4 (16.8)
T1 117 8.0 (20.0) 98 6.5 (10.0)
T2 47 3.0 (9.0) 26 0.5 (3.0)
Δ T1-T0 -5.7 (15.4) -14.2 (13.5)*
Δ T2-T0 -14.0 (38.0) -14.5 (14.0)*

The category sites were grouped according to their PDs into ≤3 (shallow), 4-5 (moderate), and ≥6 (deep) mm and CAL into 0-1, 2-4, and ≥5 mm.

The number of total sites in the test group was 1,385, 1,385, and 1,013, and in the placebo group was 1,521, 1,521, and 1,299, respectively at T0, T1, and T2.

No differences were found between the groups (Mann-Whitney U-test).

IQR: interquartile range, PD: probing depth, CAL: clinical attachment level, VPI: visible plaque index, BOP: bleeding on probing.

*P<0.05 compared the changes (Δ) at T0-T1 and T0-T2 in the test and placebo groups (Wilcoxon rank sum test).

Table 3
The median (IQR) serum level of LC-PUFA (µM/L) and the ω-6/ω-3 LC-PUFA ratios in the test and placebo groups at baseline (T0), 4 (T1), and 12 (T2) months.
jpis-44-169-i003
Variable Point in time Test (n = 7) Placebo (n = 8) P-valuea)
EPA (C20:5ω3) T0 53.2 (22.2) 52.0 (30.8) 0.779
T1 54.2 (61.5) 20.2 (14.9) 0.121
T2 238.1 (255.1) 95.9 (81.0) 0.014
Δ T1-T0 -20.8 (38.5) -33.2 (24.1)* 0.094
Δ T2-T0 139.2 (269.7)* 36.6 (75.7) 0.021
DHA (C22:6ω3) T0 221.6 (150.7) 234.3 (215.7) 0.867
T1 186.9 (174.8) 88.6 (84.1) 0.189
T2 386.6 (267.9) 214.6 (185.7) 0.054
Δ T1-T0 -102.8 (203.4) -141.1 (158.1)* 0.189
Δ T2-T0 91.1 (298.9) -20.0 (63.8) 0.054
DPA (C22:5ω3) T0 66.2 (51.5) 53.3 (32.2) 0.336
T1 24.8 (27.5) 15.1 (14.4) 0.232
T2 10.5 (8.9) 10.0 (8.2) 0.779
Δ T1-T0 -33.2 (38.5)* -29.8 (24.1)* 0.694
Δ T2-T0 -55.7 (36.3)* -46.7 (32.1)* 0.232
AA (C20:4ω6) T0 1,045.4 (445.0) 900.3 (562.0) 0.613
T1 324.2 (404.0) 455.2 (291.0) 0.779
T2 1,422.1 (259.4) 1,473.0 (1243.1) 0.100
Δ T1-T0 -722.9 (715.6)* -426.1 (456.1)* 0.779
Δ T2-T0 449.3 (390.1)* 545.2 (677.2)* 0.955
AA/EPA T0 21.5 (4.5) 17.2 (3.9) 0.189
T1 13.2 (7.7) 22.3 (10.7) 0.014
T2 5.4 (7.0) 19.1 (8.7) 0.014
Δ T1-T0 -8.0 (7.1)* 4.4 (3.5)* 0.001
Δ T2-T0 -10.6 (12.2)* -1.4 (14.7) 0.021
AA/DHA T0 4.6 (1.8) 3.6 (0.7) 0.094
T1 2.7 (1.3) 3.6 (0.9) 0.009
T2 3.8 (2.6) 5.0 (2.0) 0.121
Δ T1-T0 -1.5 (2.4)* 0.3 (0.9)* 0.001
Δ T2-T0 -0.8 (1.9) 1.0 (2.8)* 0.040
AA/DPA T0 15.7 (13.4) 19.9 (13.1) 0.281
T1 18.3 (3.5) 27.9 (18.7) 0.152
T2 114.5 (108.0) 150.9 (96.7) 0.536
Δ T1-T0 2.6 (10.5) 4.9 (18.4) 0.463
Δ T2-T0 104.6 (115.5)* 130.7 (88.7)* 0.613

Values are presented as median (IQR).

IQR: interquartile range, LC-PUFA: long chain-polyunsaturated fatty acids, EPA: eicosapentaenoic acid, DHA: docosahexaenoic acid, DPA: docosapentaenoic acid, AA: arachidonic acid.

a)Compared test and placebo groups (Mann-Whitney U-test). *P<0.05 compared the changes (Δ) at T0-T1 and T0-T2 in test and placebo groups (Wilcoxon rank sum test).

Table 4
The median (IQR) for biological blood parameters in the test and placebo groups at baseline (T0), 4 (T1) and 12 (T2) months.
jpis-44-169-i004
Variable Point in time Test (n = 7) Placebo (n = 8)
Triglyceride (mg/dL) T0 98.0 (97.0) 91.0 (76.0)
T1 76.0 (163.0) 117.5 (56.5)
T2 85.0 (117.0) 119.0 (94.5)
Δ T1-T0 -9.0 (46.0) 18.0 (35.0)
Δ T2-T0 -19.0 (66.0) -1.5 (43.5)
Cholesterol (mg/dL) T0 216.0 (82.0) 187.5 (49.5)
T1 208.0 (33.0) 185.5 (56.0)
T2 198.0 (69.0) 186.5 (70.0)
Δ T1-T0 -14.0 (26.0) 17.5 (48.0)
Δ T2-T0 -20.0 (88.0) 7.5 (33.5)
HDL (mg/dL) T0 44.0 (10.0) 40.0 (919.5)
T1 45.0 (22.0) 48.0 (19.0)
T2 43.0 (20.0) 49.0 (20.5)
Δ T1-T0 -1.0 (12.0) 9.0 (8.0)*
Δ T2-T0 1.0 (14.0) 4.0 (9.0)
LDL (mg/dL) T0 136.0 (54.0) 116.0 (34.5)
T1 125.0 (24.0) 116.5 (42.0)
T2 137.0 (49.0) 116.0 (61.0)
Δ T1-T0 -10.0 (35.0)* 7.5 (37.5)
Δ T2-T0 -11.0 (63.0) 5.5 (45.0)
VLDL (mg/dL) T0 20.0 (19.0) 18.0 (15.0)
T1 15.0 (33.0) 23.5 (11.0)
T2 17.0 (24.0) 23.5 (19.0)
Δ T1-T0 -2.0 (9.0) 4.0 (7.0)
Δ T2-T0 -4.0 (13.0) -0.5 (8.0)
Hs-CRP (mg/dL) T0 0.1 (0.3) 0.2 (0.7)
T1 0.1 (0.4) 0.4 (0.8)
T2 0.2 (0.3) 0.3 (0.4)
Δ T1-T0 0.0 (0.1) 0.0 (0.3)
Δ T2-T0 0.0 (0.2) 0.0 (0.1)
Leucocytes (/mm3) T0 6,850.0 (2,600.0) 7,515.0 (2,830.0)
T1 6,235.0 (3,160.0) 7,480.0 (1,595.0)
T2 7,320.0 (2,800.0) 7,230.0 (2,925.0)
Δ T1-T0 -210.0 (765.6) 455.0 (489.4)
Δ T2-T0 -260.0 (1,060.0) -435.0 (3,325.0)
Glycated hemoglobin (%HbA1c) T0 5.5 (0.6) 5.5 (0.3)
T1 5.6 (0.7) 5.6 (0.4)
T2 5.6 (0.6) 5.7 (0.5)
Δ T1-T0 0.0 (0.1) 0.0 (0.2)
Δ T2-T0 0.1 (0.2)* 0.1 (0.4)
Insulin (mcUI/mL) T0 7.0 (5.2) 3.2 (7.2)
T1 7.4 (7.4) 11.0 (7.4)
T2 13.2 (9.3) 12.6 (15.3)
Δ T1-T0 3.4 (5.7) 4.8 (8.0)
Δ T2-T0 5.9 (7.3)* 9.5 (13.2)*
Glucose (mg/dL) T0 102.0 (8.0) 91.5 (11.5)
T1 98.0 (11.0) 96.5 (18.0)
T2 102.0 (15.0) 94.5 (11.5)
Δ T1-T0 -1.0 (7.0) 3.0 (11.5)
Δ T2-T0 0.0 (15.0) 2.5 (9.5)

Values are presented as median (IQR).

IQR: interquartile range, HDL: high-density lipoprotein, LDL: low-density lipoprotein, VLDL: very-low-density lipoprotein, hs-CRP: high-sensitivity C-reactive protein.

No differences were found between the groups (Mann-Whitney U-test).

*P<0.05 compared the changes (Δ) at T0-T1 and T0-T2 in test and placebo groups (Wilcoxon rank sum test).

Notes

No potential conflict of interest relevant to this article was reported.

References

1. Seymour GJ, Gemmell E. Cytokines in periodontal disease: where to from here? Acta Odontol Scand. 2001; 59:167–173.
crossref
2. Ott J, Hiesgen C, Mayer K. Lipids in critical care medicine. Prostaglandins Leukot Essent Fatty Acids. 2011; 85:267–273.
crossref
3. Figueredo CM, Martinez GL, Koury JC, Fischer RG, Gustafsson A. Serum levels of long-chain polyunsaturated fatty acids in patients with periodontal disease. J Periodontol. 2013; 84:675–682.
crossref
4. Martinez GL, Koury JC, Brito F, Fischer RG, Gustafsson A, Figueredo CM. The impact of non-surgical periodontal treatment on serum levels of long chain-polyunsaturated fatty acids: a pilot randomized clinical trial. J Periodontal Res. 2014; 49:268–274.
crossref
5. Sijben JW, Calder PC. Differential immunomodulation with long-chain n-3 PUFA in health and chronic disease. Proc Nutr Soc. 2007; 66:237–259.
crossref
6. El-Sharkawy H, Aboelsaad N, Eliwa M, Darweesh M, Alshahat M, Kantarci A, et al. Adjunctive treatment of chronic periodontitis with daily dietary supplementation with omega-3 Fatty acids and low-dose aspirin. J Periodontol. 2010; 81:1635–1643.
crossref
7. Elkhouli AM. The efficacy of host response modulation therapy (omega-3 plus low-dose aspirin) as an adjunctive treatment of chronic periodontitis (clinical and biochemical study). J Periodontal Res. 2011; 46:261–268.
crossref
8. Sonestedt E, Ericson U, Gullberg B, Skog K, Olsson H, Wirfalt E. Do both heterocyclic amines and omega-6 polyunsaturated fatty acids contribute to the incidence of breast cancer in postmenopausal women of the Malmö diet and cancer cohort? Int J Cancer. 2008; 123:1637–1643.
crossref
9. Khanaki K, Nouri M, Ardekani AM, Ghassemzadeh A, Shahnazi V, Sadeghi MR, et al. Evaluation of the relationship between endometriosis and omega-3 and omega-6 polyunsaturated fatty acids. Iran Biomed J. 2012; 16:38–43.
10. Simopoulos AP. Omega-3 fatty acids in inflammation and autoimmune diseases. J Am Coll Nutr. 2002; 21:495–505.
11. Hayakawa S, Yoshikawa D, Ishii H, Tanaka M, Kumagai S, Matsumoto M, et al. Association of plasma ω-3 to ω-6 polyunsaturated fatty acid ratio with complexity of coronary artery lesion. Intern Med. 2012; 51:1009–1014.
crossref
12. Naqvi AZ, Buettner C, Phillips RS, Davis RB, Mukamal KJ. n-3 fatty acids and periodontitis in US adults. J Am Diet Assoc. 2010; 110:1669–1675.
crossref
13. Fats and fatty acids in human nutrition. Proceedings of the Joint FAO/WHO Expert Consultation. November 10-14, 2008. Geneva, Switzerland. Ann Nutr Metab. 2009; 55:5–300.
crossref
14. Tong H, Rappold AG, Diaz-Sanchez D, Steck SE, Berntsen J, Cascio WE, et al. Omega-3 fatty acid supplementation appears to attenuate particulate air pollution-induced cardiac effects and lipid changes in healthy middle-aged adults. Environ Health Perspect. 2012; 120:952–957.
crossref
15. Dawczynski C, Schubert R, Hein G, Muller A, Eidner T, Vogelsang H, et al. Long-term moderate intervention with n-3 long-chain PUFA-supplemented dairy products: effects on pathophysiological biomarkers in patients with rheumatoid arthritis. Br J Nutr. 2009; 101:1517–1526.
crossref
16. Gillies D, Sinn JKh, Lad SS, Leach MJ, Ross MJ. Polyunsaturated fatty acids (PUFA) for attention deficit hyperactivity disorder (ADHD) in children and adolescents. Cochrane Database Syst Rev. 2012; 7:CD007986.
crossref
17. Sydenham E, Dangour AD, Lim WS. Omega 3 fatty acid for the prevention of cognitive decline and dementia. Cochrane Database Syst Rev. 2012; 6:CD005379.
18. Liu T, Korantzopoulos P, Shehata M, Li G, Wang X, Kaul S. Prevention of atrial fibrillation with omega-3 fatty acids: a meta-analysis of randomised clinical trials. Heart. 2011; 97:1034–1040.
19. James S, Montgomery P, Williams K. Omega-3 fatty acids supplementation for autism spectrum disorders (ASD). Cochrane Database Syst Rev. 2011; (11):CD007992.
crossref
20. Friedman A, Moe S. Review of the effects of omega-3 supplementation in dialysis patients. Clin J Am Soc Nephrol. 2006; 1:182–192.
crossref
21. Armitage GC. Development of a classification system for periodontal diseases and conditions. Ann Periodontol. 1999; 4:1–6.
22. WHO Expert Committee on Physical Status. The use and interpretation of anthropometry. Geneva: World Health Organization;1995.
23. Rasmussen LE, Svensson M, Jorgensen KA, Schmidt EB, Christensen JH. The content of docosahexaenoic acid in serum phospholipid is inversely correlated with plasma homocysteine levels in patients with end-stage renal disease. Nutr Res. 2010; 30:535–540.
24. Fredman G, Serhan CN. Specialized proresolving mediator targets for RvE1 and RvD1 in peripheral blood and mechanisms of resolution. Biochem J. 2011; 437:185–197.
25. Gebauer SK, Psota TL, Harris WS, Kris-Etherton PM. n-3 fatty acid dietary recommendations and food sources to achieve essentiality and cardiovascular benefits. Am J Clin Nutr. 2006; 83:6 Suppl. 1526S–1535S.
crossref
26. Simopoulos AP. Omega-6/omega-3 essential fatty acids: biological effects. World Rev Nutr Diet. 2009; 99:1–16.
crossref
27. Russo GL. Dietary n-6 and n-3 polyunsaturated fatty acids: from biochemistry to clinical implications in cardiovascular prevention. Biochem Pharmacol. 2009; 77:937–946.
crossref
28. Caramia G. The essential fatty acids omega-6 and omega-3: from their discovery to their use in therapy. Minerva Pediatr. 2008; 60:219–233.
crossref
29. Gómez Candela C, Bermejo Lopez LM, Loria Kohen V. Importance of a balanced omega 6/omega 3 ratio for the maintenance of health: nutritional recommendations. Nutr Hosp. 2011; 26:323–329.
crossref
30. Rosenstein ED, Kushner LJ, Kramer N, Kazandjian G. Pilot study of dietary fatty acid supplementation in the treatment of adult periodontitis. Prostaglandins Leukot Essent Fatty Acids. 2003; 68:213–218.
crossref
31. Hartweg J, Perera R, Montori V, Dinneen S, Neil HA, Farmer A. Omega-3 polyunsaturated fatty acids (PUFA) for type 2 diabetes mellitus. Cochrane Database Syst Rev. 2008; (1):CD003205.
crossref
32. Akinkuolie AO, Ngwa JS, Meigs JB, Djousse L. Omega-3 polyunsaturated fatty acid and insulin sensitivity: a meta-analysis of randomized controlled trials. Clin Nutr. 2011; 30:702–707.
crossref
33. Jacobson TA, Glickstein SB, Rowe JD, Soni PN. Effects of eicosapentaenoic acid and docosahexaenoic acid on low-density lipoprotein cholesterol and other lipids: a review. J Clin Lipidol. 2012; 6:5–18.
crossref
34. Ryan AS, Keske MA, Hoffman JP, Nelson EB. Clinical overview of algal-docosahexaenoic acid: effects on triglyceride levels and other cardiovascular risk factors. Am J Ther. 2009; 16:183–192.
crossref
TOOLS
ORCID iDs

Gisele Lago Martinez
https://orcid.org/http://orcid.org/0000-0002-9503-2261

Josely Correa Koury
https://orcid.org/http://orcid.org/0000-0002-3189-9261

Marcela Anjos Martins
https://orcid.org/http://orcid.org/0000-0001-7744-7255

Fernanda Nogueira
https://orcid.org/http://orcid.org/0000-0002-4048-5116

Ricardo Guimarães Fischer
https://orcid.org/http://orcid.org/0000-0003-0695-8159

Anders Gustafsson
https://orcid.org/http://orcid.org/0000-0001-6481-858X

Carlos Marcelo S Figueredo
https://orcid.org/http://orcid.org/0000-0003-0222-9231

Similar articles