

 PDF
PDF ePub
ePub Citation
 Print
Print


INTRODUCTION
Titanium and titanium alloys have been widely used in dentistry and orthopedics due to their excellent biocompatibility and physical properties. Although titanium is biologically inert, it reacts with oxygen in the air and spontaneously forms a dense and stable oxide layer with a thickness of 1.5 to 10 nm [1], which has a low level of electronic conductivity [2], great thermodynamic stability [3], and a low tendency toward ionformation in aqueous environments [4]. Thus, the biocompatibility of titanium and its high corrosion resistance are attributed to this surface oxide film.
Although the "osseointegration" phenomenon was first described by Branemark et al. [5], integration between titanium and tissue depends on mainly morphological connection rather than chemical bonding [6]. Albrektsson et al. [7] observed that the bone-implant interface consisted of a fibrous tissue-free zone with a 20 to 40 nm thick proteoglycan coat immediately adjacent to the titanium oxide (TiO2) surface of the implant. Thus, many studies have been conducted to improve the bioactivity of the titanium surface. It has been reported that the activity of TiO2 is influenced by the crystal structure, surface area, size distribution, porosity, and surface hydroxyl density [8,9].
In its native form, the TiO2 layer has poor mechanical properties and is easily fractured under fretting and sliding wear conditions [10]. Thus, various techniques such as the sol-gel method, anodizing, and hydrothermal methods have been applied to change the layer's characteristics [11]. However, the sol-gel and anodizing methods have disadvantages such as cost and time needed. On the other hand, titanium with isothermal treatment has been found to be desirable for biomedical applications due to its controllable oxide layer thickness, good uniformity, and conformability over large areas at low cost. Furthermore, TiO2 with a rutile structure was typically formed by thermal treatment [8]. Studies have reported that a thick oxide layer could enhance the mechanical and biological properties of titanium [12,13]. Surface topography, crystalline structure, and roughness could be changed by thermal treatment, and the transition temperatures ranged from 400℃ to 1,000℃ according to the kind of titanium used [9,14,15]. Furthermore, surface topography and roughness can affect the surface energy [16].
During implantation of titanium implants, titanium contact with blood originated from bone marrow and surrounding tissue. Because blood-surface interactions are influenced by surface energy [17], the change in the surface composition and the increase in the specific surface area could be attributed to the high surface energy. Furthermore, cell spreading increases on the substratum with higher surface energy in both the presence and absence of serum proteins [18].
The morphology of cells grown on titanium can be informative of their interactions with the surface, especially in the early phase of culture, i.e., attachment and adhesion [19]. Some studies have reported that cell attachment to material and cell proliferation is sensitive to the micro-topography of the titanium surface [20,21].
Thermal treatment is a relatively simple method for surface modification of titanium to enhance its surface characteristics and bioactivity. Therefore, the aim of this study was to evaluate the surface characteristics and the response of osteoblasts on titanium (Ti-S) discs with different thermal treatments.
MATERIALS AND METHODS
Sample preparation
In this study, five samples of commercially pure titanium (grade 2) discs (25×2 mm) were prepared for each group. These sample surfaces were ultrasonically degreased in acetone and ethanol for 10 minutes each, with deionized water rinsing between applications of each solvent. To assess the chemical composition and surface characteristics of the TiO2 layer according to the treatment temperature, untreated machined smooth titanium (Ti-S) samples were treated by isothermal oxidation for 30 minutes in a tube furnace at 300℃, 500℃, or 750℃. Since moisture in the air which can enter the tube furnace could affect the oxidation, the air was passed through a drying tower filled with zeolite. The samples were divided into the following 4 groups: The control was untreated machined Ti-S, group I was Ti-S treated in the furnace at 300℃ for 30 minutes, group II was Ti-S treated at 500℃ for 30 minutes, and group III was Ti-S treated at 750℃ for 30 minutes.
Surface characteristics
Surface roughness test and atomic force microscope (AFM)
The surface roughness and micro-topography were examined by a surface roughness tester (Asmeto AG, Richterswil, Germany) and atomic force microscopy (AFM; Nano Scope IIIa, Digital Instruments, Santa Barbara, CA, USA).
Scanning electron microscope (SEM)
To assess the oxide layer thickness, test samples were embedded in resin and then cross-sectioned. The surface topography and oxide layer thickness were observed by scanning electron microscoy (SEM; S-4700, Hitachi, Tokyo, Japan).
X-ray diffraction (XRD)
The chemical compositions of the titanium surfaces were determined by an X-ray diffractometer (XRD; D/MAX-1200, Rigaku, Japan) using CuKα1 incident radiation, a tube voltage of 40 kV, and a current of 40 mA. The scanning speed was 2°/min and the scanning angle ranged from 20° to 90° 2θ.
Contact angle measurement
The contact angle of each sample was measured using an image analyzing microscope (Camscope, Sometech Inc., Seoul, Korea). The contact angles were determined using drops of distilled water at room temperature. The image of the water droplet was captured at 30 seconds after delivery. Then the contact angle was analyzed by using the image analyzing software (Surftens QA 3.0, OEG GmbH, Frankfurt, Germany).
Surface energy
The surface energy was calculated by Young's equation and Good and van Oss model using the following parameters and measured contact angles.
The three parameters influencing the shape of a drop on asolid surface are:
These three parameters are linked with the contact angle θ by Young's equation:
ϒS=ϒL cos θ+ϒSL
In the van Oss et al. [22], the surface energy is written as:
-  dispersive component (Lifshitz-van der Waals interactions)
dispersive component (Lifshitz-van der Waals interactions)-  ,
,  polar components (polar interactions, Lewis acid-base)
, polar components (polar interactions, Lewis acid-base)The relation between surface energy components, liquid components, and contact angle is written as:

Depositing a drop of 3 different liquids with known dispersive and polar components, one can calculate the solid surface energy. Table 1 gives the values of components of typical liquids used in the determination of surface energy.
Biologic characteristics
3-(4,5-Dimethylthiazol-2-yl)-2,5-diphenyltetrazolium bromide (MTT) assay
Cells were seeded on each disc in a 12-well plate at a density of 5×10⁴ cells/mL in BGJb media supplemented with 10% fetal bovine serum (FBS). Following incubation, cell viability was assessed after 3 days following the manufacturer's guidelines. In these experiments, the amount of reduced Formosan product is directly proportional to the number of viable cells. Formosan accumulation was quantitated by absorbance at 490 nm by an enzyme-linked immunoabsorbent assay plate reader and analyzed.
Alkaline Phosphatase (ALP) activity
To measure the ALP activity, MC3T3-E1 cells were seeded on each group of discs in a 12-well plate at a density of 1×10⁴ cells/mL in α-MEM 10% FBS. The ALP activity was determined on day 7. To induce differentiation into osteoblasts, 40 µg/mL ascorbate and 20 µg/mL β-glycerol phosphate were added to the α-MEM media. Determination of ALP activity was performed at day 7. Briefly, cells were lysed in Triton 0.1% (Triton X-100) in phosphate buffered saline, then frozen at -70℃ and thawed. One hundred microliters of cell lysates was mixed with 200 µL of 10 mM p-nitrophenol phosphate and 100 µL of 1.5 M 2-amino-2-methyl-1-propanol buffer, and then incubated for 60 minutes in the oven at 60℃. ALP activity was measured by absorbance reading at 405 nm with a spectrophotometer (Bio-Rad Laboratories Inc., Hercules, CA, USA). All experiments were carried out in triplicate.
RESULTS
The surface morphology and topography of control and thermally treated Ti-S are shown in Figs 1 and 2. There was a tendency toward an increase in the mean average surface roughness (Ra) as the treatment temperature increased (Table 2). The most noticeable surface change was observed in group III. In group III, most of the crystallites tended to be larger and the surface topography had a more spiked shape than the other groups. As shown in Fig. 3, the cross-sectioned image also showed that the thickness of the TiO2 layer increased as the temperature increased.
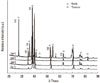
Fig. 4 shows the XRD patterns of the samples. For the control, group I, and group II samples, the XRD patterns are almost the same, presenting only the peaks of titanium. For group III, there are additional peaks belonging to rutile TiO2. This indicates that titanium was further oxidized in group III and formed oxide layers with a rutile structure instead of anatase.
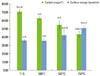
The contact angles and surface energies are shown in Fig. 5 and Table 3. The water contact angle of the samples gradually decreased as the temperature increased. Although there was no statistical difference between group I and group II, group III had a statistically significantly lower contact angle than the other groups. In contrast, the surface energies (dyne/cm) significantly increased as the temperature increased.
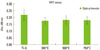
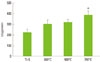
In the MTT assay, after 24 hours of incubation, the assessment of cell viability showed that the optical density of the control tended to be higher than the other groups, but there was no significant difference (Fig. 6). However, the ALP activity increased as the temperature increased, especially in group III (Fig. 7).
DISCUSSION
Osseointegration depends on the behaviors of cells at the bone-implant interface, such as their initial attachment, adhesion, and spreading [23]. These events can be affected by the surface characteristics of the implant, including chemical composition, wettability, and topography [20]. Theoretically, pure Ti surfaces exhibit high surface energy due to the oxide layer that grows spontaneously at room temperature [4]. Such oxide surfaces are known to be spontaneously nucleated calcium phosphate layers (apatite) in contact with simulated body fluid [8]. However, inorganic anions or organic hydrocarbon contaminants from the atmosphere were absorbed into surface with high energy within seconds. As a result, the surface chemical composition might change and the surface hydrophilicity decrease. Thus, many studies have been conducted to increase the wettability and surface energy. One study [14] reported that the anatase/rutile transition could occur at temperatures ranging from 400℃ to 1,000℃ and the transition could affect the surface morphology, chemical composition, crystal structure, and surface roughness [9], which could, in turn, increase the wetability and surface energy [8]. In this study, SEM and AFM examination also revealed that the crystal structure and surface topography changed as the treatment temperature increased. Although all of the tested samples showed differences among the groups, prominent changes could be seen in group III. This indicated that the anatase/rutile phase transition occurred only in group III, and XRD patterns confirmed this.
It has been reported [24] that as the treatment temperature is raised, the oxygen solubility of the titanium matrix is enhanced. Furthermore, the plane of rutile had the highest atomic density [25]. The higher density of titanium ions on the surfaces was responsible for more active sites. This indicated that a thicker oxide layer could be created by the rutile plane. Our cross-sectioned image also showed a significant increase in the oxide layer thickness in group III compared with group I and group II.
Some studies [8,17,18] have reported increased wettability due to high surface energy and enhanced interaction between the implant surface and biologic environment. Because the Gibb's function of the thermal-treated samples with higher surface energies should be greater, absorption and reaction occur more easily on such surfaces [8]. The present study showed a decrease in the contact angle and increase in the surface energy as the treatment temperature increased. Furthermore, group III showed a prominent difference in surface characteristics and physical properties from the other groups. This indicated that the phase transition of the oxide layer is another important factor in surface modification.
Actually, the mean Ra value of all of the groups involved a minimally rough surface and the differences are not substantial, but a surface topographical change was observed. Even though both the spiky surface and the undulating surface had the same Ra, the cells on the former surface would have influence on the behavior of cell adhesion than those on the latter [26]. It is generally known that as surface micro-roughness increases, osteoblast proliferation decreases, whereas as differentiation increases on such surfaces, the cells tend to increase production of factors like transforming growth factor-β1 that promote osteogenesis while decreasing osteoclastic activity [20]. Twenty-four hours is generally considered a key point in time in the analysis of short-term cellular interactions with biomaterials in vitro [19]. In this study, at 1 day, the MTT assay showed that the cell viability was higher in the untreated group; however, micro-roughness and ALP activity increased as the temperature increased, especially in group III. The ALP activity is used as a biomarker for expressing osteoblastic activity because ALP can mediate bone mineralization by decomposing phosphate compounds and stimulating the combination of phosphate and calcium in the extracellular matrix [27].
In this study, the surface characteristics of thermally treated titanium discs were observed. Consequently, the surface characteristics and bioactivities improved as the temperature increased. This indicates that surface modification by thermal treatment could be a useful method for medical and dental implants.
In the present study, the surface characteristics of Ti-S discs treated by different thermal conditions were evaluated. The results are as follows:
The TiO2 layer thickness increased as the treatment temperature increased.
For the control, group I, and group II samples, the XRD patterns were almost the same and there were only peaks of titanium. For group III, there were additional peaks belonging to rutile TiO2.
The contact angle in group III was significantly lower than any of the other groups, but there was no significant difference between group I and group II. The surface energy increased significantly as the treatment temperature increased.
The surface roughness increased as the treatment temperature increased.
After 1 day, cell viability was higher in the untreated group, but the difference was not significant.
ALP activity increased as the treatment temperature increased.
The micro-morphology, crystal structure, and cellular interactions of the TiO2 layer were influenced by the treatment temperature. Thermal treatment at 750℃ (group III) showed greater improvement in surface characteristics compared with the other groups.


 XML Download