

 PDF
PDF ePub
ePub Citation
 Print
Print


For a researcher, the power refers to the possibility of proving the difference between the two different groups. In other words, the probability that the test correctly rejects the null hypothesis when the alternative hypothesis. Generally, statistically significant results are obtained if statistical tests are performed with enough numbers.
In the usual case, the clinical difference is not something the researcher can arbitrarily adjust. Let's look at some of the things that researchers can adjust to increase the power.
INCREASE THE NUMBER OF SAMPLES
Most of the researchers already know this, but let's look at a simple example deeply.
First, visit https://goo.gl/n6dL5Q.
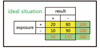
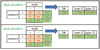
Let's put the numbers in the yellow cells as above. Suppose that the exposure group has a cure rate of 20%, the non-exposure group has a cure rate of 10%, and both groups have 100 people (Fig. 1).
Now, going right, the odds ratio (OR) is 2.25 and its 95% confidence interval (95% CI) is interpreted as statistically non-significant because the 95% CI contains 1 as 0.99–5.09 (Fig. 2).
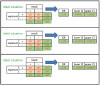
What if the total number is increased to 1.5 times or 2 times?
If you increase the number, there is no change in OR, but the 95% CI becomes narrower and get statistical significance. In other words, as the number of samples increases, the probability of becoming statistically significant increases and the power increases without any change of OR (Fig. 2).
INCREASE SENSITIVITY AND SPECIFICITY
We diagnose the disease with a specific diagnostic method. Assume that the sensitivity and specificity of the diagnostic method are 90%, respectively.
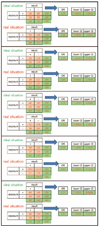
That means that only 90% of people with the disease are diagnosed as having the disease and 90% of people without the disease are diagnosed as having no disease, resulting in a 26% cure rate from 20% and resulting in a 18% cure rate from 10% (Fig. 3).
That is a ‘real situation’, so let's calculate the OR.
The OR is 1.6, which is closer to 1 than the original OR (2.25), and its 95% CI is quite large, resulting in statistically non-significant results. Let's also extend the numbers to 150 and 200 in the same way.
In the ‘ideal situation’, statistical significance was obtained even if only 150 subjects were used. However, if sensitivity and specificity were 90%, even increased number of samples to 150 or 200 would not be statistically significant (Fig. 4).
Now, let's increase the sensitivity and specificity to 0.95.
As the OR is moved away from 1, the 95% CI also deviates from 1, leading to statistically significant results (Fig. 4).
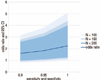
This can be summarized as one chart. As the sensitivity and specificity approaches 1, the OR increases. As the number of samples increases, the 95% CI narrows and the OR itself does not change. If we want to get statistically significant results and at the same time get real odds, it is better to increase the sensitivity and specificity rather than to increase the number of samples (Fig. 5).
Expensive diagnostic equipment might be needed to increase sensitivity and specificity. Even with expensive diagnostic equipment, the sensitivity and specificity are reduced if the test person is not trained. Therefore, accurate measurement methods should be established, the test person should be educated, and the whole test system should be checked repeatedly.
Good diagnostic equipment and sincere and trained examiners may not be good enough to get high sensitivity and specificity due to subject factor. Including blood pressure, blood sugar, various hormones blood levels, athletic ability and cognitive ability, many of subject factors vary with time. Even the height or even the weight varies with time. Therefore, it is necessary to thoroughly investigate and confirm the factors influencing the diagnosis such as taking a rest, eating, fasting, morning or evening, etc.
SELECT PROPER SUBJECTS
Clinical researchers often think that the number should be increased. Suppose you include an inaccurate subject.
For example, suppose you have a drug that works specifically for type 1 diabetes. To increase the number of subjects, let's include patients with type 2 diabetes.
If the new drug has a 30% success rate for type 1 diabetes, but only about 10% for type 2 diabetes. Suppose the old drug has a success rate of 10% in both type 1 diabetes and type 2 diabetes.
If the above results were obtained for 50 people with type 1 diabetes, it would be statistically significant by itself.
If there are 50 people with type 1 diabetes and 50 people with type 2 diabetes in new drug group, it is likely that the success rate will drop to 20%. Old drug shows a 10% success rate. The result is statistically insignificant (Fig. 6).
Eventually the number of samples increases but the OR becomes smaller and the 95% CI becomes wider and statistically insignificant. In other words, the inclusion of inappropriate subjects eventually led to an increase in numbers, but rather to a reduction in power.
1. Examples
The TOPCAT trial1) is a multi-center study involving six countries: 1,151 (United States), 326 (Canada), 167 (Brazil), 123 (Argentina), 1,066 (Russia), and 612 (Georgia) with the result being statistically insignificant (hazard ratio [HR], 0.89; 95% CI, 0.77–1.04; P=0.14).
However, when analyzing only the data except Russia and Georgia, they were statistically significant (HR, 0.82; 95% CI, 0.69–0.98; P=0.026). What happened?
Maybe in Russia and Georgia there really is no difference in the effectiveness of the treatment. The people in the area are genetically environmentally specific and the results may be different from others. Or in the case of Russia and Georgia, the researcher did not perform faithfully or was mistaken or had different diagnostic equipment. Or inappropriate subjects might be included. Anyway, the result is that the number has increased, but it shows that the power can be reduced. Or there may have been no statistical difference in the whole.
BEAUTIFUL trial2) and SIGNIFY trial3) were designed for large-scale study patients with stable coronary disease. However, these studies failed to show the efficacy of ivabradine.
The SHIFT trial4) showed a 26% reduction (P<0.0001) in studies involving chronic heart failure with same drug. These are studies that show that it is important to select the target correctly patients.
Although stable coronary disease and chronic heart failure are both heart diseases, they are different. It may be possible to reduce trial and error by examining the mechanism of the drug and examining previous studies deeply.
SUMMARY
The researchers want to show that effective treatment is effective. At the same time, they want to know how effective they are. Generally, as you can see, increasing the number of samples can prove to be effective. It is not the number of samples but accurate data that tells you how effective it is. Of course we want to have plenty of accurate data, but this is not always possible. Some people think that it is possible to solve the problem by increasing the number of incorrect data, but this may not be the case. Accurate diagnostic techniques, good diagnostic equipment, and accurate target selection can be more important than increasing the number. To do this, it is necessary to thoroughly identify the prior research, secure the budget, train the manpower and confirm the precise and specific protocol in advance.
Quantity does not replace quality. Let's thing what big data can and cannot solve.

 XML Download