Journal List > Asian Oncol Nurs > v.15(1) > 1081842

Seo and Yi: Distress and Quality of Life in Cancer Patients Receiving Chemotherapy

Abstract

Purpose

The purpose of this study was to identify the levels of distress and quality of life in cancer patients receiving chemotherapy and to identify the relationship between distress and quality of life.

Methods

Data were collected during 2013 from 128 cancer patients receiving chemotherapy at a hospital located in Seoul, South Korea. Distress thermometer and problem list were used to measure distress, and the Functional Assessment Cancer Therapy-general questionnaire was used to measure quality of life. Descriptive statistics, t-tests, one-way ANOVA, the post-hoc Scheffé test, and Pearson's correlation coefficients were used to analyze the data.

Results

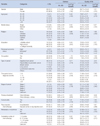
Among the 128 participants, 68 (53.1%) were male and the mean age was 52.55 years. Forty two (32.8%) were diagnosed with stage 4 and 73 (57.0%) were having recurrence or metastasis. The mean score for distress was 4.01 out of 10. Seventy four (57.8%) participants had a score of 4 or higher, indicating clinically significant distress. Emotional problems had the highest item mean among five domains. The mean score for quality of life was 68.51 ± 14.22 out of 108. Distress and quality of life were negatively correlated (r= -.52, p<.001).

Conclusion

Distress level with specific problems should be regularly assessed to relieve distress and improve the quality of life of cancer patients receiving chemotherapy.

Figures and Tables

Table 1

Difference in Distress and Quality of Life by Sociodemographic and Illness-related Characteristics (N=128)
aon-15-18-i001
Variables Categories n (%) Distress Quality of life
M ± SD t or F (p) Scheffé M ± SD t or F (p) Scheffé
Gender Male 68 (53.1) 3.74 ± 2.26 - 1.48 (.142) 69.71 ± 14.44 1.21 (.312)
Female 60 (46.9) 4.33 ± 2.32 67.15 ± 13.96
Age (year) 20~29 6 (4.7) 3.17 ± 2.32 0.44 (.781) 79.67 ± 9.77 1.29 (.276)
30~39 11 (8.6) 4.37 ± 1.57 67.55 ± 6.15
40~49 31 (24.2) 4.26 ± 2.29 65.65 ± 14.36
50~59 42 (32.8) 3.81 ± 2.32 68.52 ± 15.49
≥ 60 38 (29.7) 4.08 ± 2.50 69.34 ± 14.50
Marital status Single 12 (9.4) 4.00 ± 2.09 0.42 (.685) 71.42 ± 15.64 0.27 (.761)
Married 114 (89.1) 3.99 ± 2.31 68.20 ± 14.06
Other 2 (1.6) 5.00 ± 3.53 68.50 ± 23.33
Religion None 43 (33.6) 4.35 ± 2.52 0.69 (.604) 68.53 ± 12.14 1.08 (.369)
Christian 41 (32.0) 3.59 ± 2.36 71.41 ± 17.01
Buddhist 28 (21.9) 4.21 ± 2.13 65.89 ± 11.98
Catholic 15 (11.7) 3.93 ± 1.79 66.47 ± 15.08
Other 1 (0.8) 3.00 ± 0.00
Education ≤ Middle school 16 (12.5) 4.06 ± 2.21 0.44 (.957) 70.00 ± 13.24 2.27 (.107)
High school 64 (50.0) 4.06 ± 2.42 65.89 ± 14.40
≥ College/University 48 (37.5) 3.94 ± 2.20 71.50 ± 13.91
Perceived economic status Higha 6 (4.7) 5.00 ± 3.41 1.79 (.171) 68.00 ± 15.11 3.45 (.035) c<b
Moderateb 97 (75.8) 2.21 ± 0.22 70.22 ± 14.06
Lowc 25 (19.5) 2.27 ± 0.45 62.00 ± 13.27
Occupation Yes 42 (32.8) 3.79 ± 1.92 - .79 (.431) 70.31 ± 13.74 1.00 (.318)
No 86 (67.2) 4.13 ± 2.46 7.63 ± 14.45
Type of cancer Digestive tract cancer 48 (37.5) 3.75 ± 2.31 0.77 (.574) 72.52 ± 14.35 2.01 (.070)
Hepatobiliaty & pancreatic cancer 17 (13.3) 4.59 ± 2.43 61.24 ± 14.39
Breast cancer 17 (13.3) 4.35 ± 2.32 64.00 ± 12.84
Lung cancer 11 (8.6) 2.73 ± 2.24 67.55 ± 11.24
Lymphoma & sarcoma 23 (18.0) 3.83 ± 2.27 69.00 ± 15.15
Others 12 (9.4) 3.50 ± 2.24 69.08 ± 12.49
Time period since diagnosis (month) 1~6 51 (39.8) 3.80 ± 2.38 0.76 (.554) 71.86 ± 13.44 1.46 (.218)
7~12 20 (15.6) 3.65 ± 2.28 68.55 ± 12.69
13~18 14 (10.9) 3.93 ± 2.40 67.36 ± 15.13
19~24 7 (5.5) 5.00 ± 1.73 63.86 ± 9.08
≥ 25 36 (28.1) 4.36 ± 2.27 65.08 ± 16.00
Stage of cancer Stage 1 9 (7.0) 4.00 ± 2.29 0.51 (.729) 61.11 ± 17.95 1.14 (.342)
Stage 2 31 (24.2) 3.71 ± 2.44 71.03 ± 16.39
Stage 3 33 (25.8) 4.30 ± 2.40 66.82 ± 13.44
Stage 4 42 (32.8) 4.19 ± 2.12 68.57 ± 12.88
Unknown 13 (10.2) 3.46 ± 2.40 71.69 ± 11.38
Previous treatment Chemotherapy 50 (39.1) 4.08 ± 2.11 0.25 (.801) 69.08 ± 13.95 0.36 (.717)
Chemotherapy + others 78 (60.9) 3.97 ± 2.42 68.14 ± 14.47
Comorbodity Yes 33 (25.8) 4.36 ± 2.58 1.01 (.314) 71.61 ± 14.00 1.46 (.147)
No 95 (74.2) 3.89 ± 2.19 67.43 ± 14.47
Place injected chemotherapy Hospitalization 61 (47.7) 3.66 ± 2.99 - 1.70 (.091) 69.92 ± 14.69 1.07 (.286)
Daycare center or day injection room 67 (52.3) 4.34 ± 2.27 67.43 ± 14.26
Metastasis or recurrence Yes 73 (57.0) 4.08 ± 2.20 0.50 (.610) 67.66 ± 13.73 0.97 (.333)
No 39 (30.5) 3.74 ± 2.46 71.05 ± 15.38
Unknown 16 (12.5) 4.38 ± 2.42 66.19 ± 13.51
Cumulative cycles of chemotherapy 1~5 cycles 48 (37.5) 3.98 ± 2.42 0.42 (.794) 71.58 ± 12.88 1.47 (.217)
6~10 cycles 33 (25.8) 4.00 ± 2.26 66.15 ± 14.11
11~15 cycles 14 (10.9) 3.43 ± 2.62 70.43 ± 16.56
≥ 16 cycles 29 (22.7) 4.28 ± 1.89 66.48 ± 15.12
Unknown 4 (3.1) 4.75 ± 3.30 59.00 ± 11.52
Table 2

Levels of Distress (N=128)

aon-15-18-i002
Distress score n (%) Cumulation %
M ± SD = 4.01 ± 2.30
0 11 (8.6) 8.6
1 10 (7.8) 16.4
2 14 (10.9) 27.3
3 19 (14.8) 42.2
4 16 (12.5) 54.7
5 24 (18.8) 73.5
6 9 (7.0) 80.5
7 20 (15.6) 96.1
8 4 (3.1) 99.2
9 1 (0.8) 100.0
10 0 (0.0) 100.0
Total 128 (100.0) 100.0

Note. Distress score<4=54/128 (42.2%); Distress score≥4=74/128 (57.8%).

Table 3

Comparison of Problem List by Distress Group (N=128)

aon-15-18-i003
Problem list Total score Distress score <4 (n=54) Distress score ≥4 (n=74) t p
n (%) Ranking n (%) Ranking
Practical 34.83 ± 9.04 (27.2%) 10.17 ± 2.64 (18.8%) 26.33 ± 7.22 (35.6%) -5.15 <.001
 Child care 26 (20.3) 6 (11.1) 17 20 (27.0) 18
 Housing 44 (34.4) 10 (18.5) 13 34 (45.9) 10
 Insurance/financial 44 (34.4) 13 (24,1) 10 31 (41.9) 12
 Transportation 38 (29.7) 13 (24.1) 10 25 (33.8) 15
 Work/school 26 (20.3) 10 (8.5) 13 16 (21.6) 20
 Treatment decision 41 (32.0) 9 (16.7) 14 32 (43.2) 11
Family 24.50 ± 18.36 (19.1%) 5.50 ± 4.8 (10.18%) 19.00 ± 13.95 (25.7%) - 1.83 .117
 Dealing with children 24 (18.6) 3 (5.6) 20 21 (28.4) 17
 Dealing with partner 25 (19.5) 6 (11.1) 17 19 (25.7) 19
 Ability to have children 2 (1.6) 1 (1.9) 22 1 (1.4) 25
 Family health issues 47 (36.7) 12 (22.2) 11 35 (47.3) 9
Emotional 84.75 ± 16.13 (66.2%) 12.83 ± 7.28 (23.8%) 43.66 ± 9.07 (59.0%) - 6.50 <.001
 Depression 49 (38.3) 11 (20.4) 12 38 (51.4) 8
 Fear 52 (40.6) 11 (20.4) 12 41 (55.4) 6
 Nervousness 54 (42.2) 13 (24.1) 10 41 (55.4) 6
 Sadness 48 (37.5) 7 (13.0) 16 41 (55.4) 6
 Worry 89 (69.5) 27 (50.0) 1 62 (83.8) 1
 Loss of interest in usual activities 47 (36.7) 8 (14.8) 15 39 (52.7) 7
Spiritual/religious concerns 13 (10.2) 5 (9.3) 8 (10.8) 23 - 0.65 .197
Physical 41.68 ± 19.42 (32.6%) 12.82 ± 6.49 (23.7%) 28.85 ± 15.55 (39.0%) - 4.97 <.001
 Appearance 60 (46.9) 18 (33.3) 7 42 (56.8) 5
 Bathing/dressing 30 (23.4) 10 (18.5) 13 20 (27.0) 18
 Breathing 17 (13.3) 4 (7.4) 19 13 (17.6) 21
 Changes in urination 33 (25.8) 14 (25.9) 9 19 (25.7) 19
 Constipation 35 (27.3) 15 (27.8) 8 20 (27.0) 18
 Diarrhea 24 (18.6) 8 (14.8) 15 16 (21.6) 20
 Eating 58 (45.3) 14 (25.9) 9 44 (59.5) 4
 Fatigue 81 (63.3) 24 (44.4) 3 57 (77.0) 2
 Feeling Swollen 41 (32.0) 12 (22.2) 11 29 (39.2) 13
 Fevers 16 (12.5) 6 (11.1) 17 10 (13.2) 22
 Getting around 37 (28.9) 11 (20.4) 12 26 (35.1) 14
 Indigestion 43 (33.6) 12 (22.2) 11 31 (41.9) 12
 Memory/concentration 58 (45.3) 20 (37.0) 5 38 (51.4) 8
 Mouth sores 32 (25.0) 8 (14.8) 15 24 (32.4) 16
 Nausea 61 (47.7) 19 (35.2) 6 42 (56.8) 5
 Nose dry/congested 40 (31.3) 14 (25.9) 9 26 (35.1) 14
 Pain 34 (26.6) 8 (14.8) 15 26 (35.1) 14
 Sexual 28 (21.9) 7 (13.0) 16 21 (28.4) 17
 Skin dry/itchy 47 (36.7) 8 (14.8) 15 39 (52.7) 7
 Sleep 61 (47.7) 23 (42.6) 4 38 (51.4) 8
 Substance abuse 5 (3.9) 2 (3.7) 21 3 (4.1) 24
 Tingling in hands/feet 76 (59.4) 25 (46.3) 2 51 (68.9) 3
Total 40.41 ± 19.32 (31.6) 11.46 ± 6.27 (21.2) 29.20 ± 14.22 (39.5)
Table 4

Comparison of Quality of Life By Distress Group (N=128)

aon-15-18-i004
Variables Total (n = 128) Conversion (4) Distress score < 4 (n = 54) Distress score ≥ 4 (n = 74) t p
M ± SD M ± SD M ± SD
FACT-G ( = PWB + SWB + EWB + FWB) 68.51 ± 14.22 2.54 77.46 ± 11.52 61.97 ± 12.37 7.20 < .001
Physical well-being (PWB) 19.33 ± 5.38 2.76 22.17 ± 4.35 17.26 ± 5.13 5.69 < .001
Social/family well-being (SWB) 16.66 ± 5.18 2.38 17.61 ± 5.08 15.96 ± 5.17 1.79 .075
Emotional well-being (EWB) 16.14 ± 5.04 2.69 19.37 ± 3.10 13.78 ± 4.88 7.38 < .001
Functional well-being (FWB) 16.38 ± 5.39 2.34 18.31 ± 5.65 14.97 ± 4.76 3.62 < .001

FACT-G=Functional Assessment Cancer Therapy-General.

Table 5

Correlation between Distress and Quality of Life (N=128)

aon-15-18-i005
Variables Distress FACT-G PWB SWB EWB FWB
r (p) r (p) r (p) r (p) r (p) r (p)
Distress 1.00
FACT-G - .52 ( < .001) 1.00
PWB - .45 ( < .001) .66 ( < .001) 1.00
SWB - .09 (.294) .59 ( < .001) .06 (.463) 1.00
EWB - .52 ( < .001) .74 ( < .001) .51 ( < .001) .18 (.039) 1.00
FWB - .35 ( < .001) .71 ( < .001) .21 (.017) .36 ( < .001) .33 ( < .001) 1.00

FACT-G=Functional Assessment Cancer Therapy-General; PWB=Physical well-being; SWB=Social/family well-being; EWB=Emotional well-being; FWB=Functional well-being.

Notes

This article is a revision of the first author's master's thesis from Seoul National University

References

1. Statistics Korea. Cause of Death Statistics in 2011. Accessed January 19, 2015. http://www.index.go.kr/potal/main/EachDtlPageDetail.do?idx_cd=1012.
2. National Cancer Information Center. 2012 National Cancer statistics. Accessed January 19, 2014. http://www.cancer.go.kr/mbs/cancer/subview.jsp?id=cancer_040302000000.
3. Kyngäs H, Mikkonen R, Nousiainen EM, Rytilahti M, Seppänen P, Vaattovaara R, et al. Coping with the onset of cancer: coping strategies and resources of young people with cancer. Eur J Cancer Care. 2008; 10:6–11.
crossref
4. Zabora J, Brintzenhofeszoc K, Curbow B, Hooker C, Piantadosi S. The prevalence of psychological distress by cancer site. Psychooncology. 2001; 10:19–28.
crossref
5. National Comprehensive Cancer Network. Distress Management. Accessed December 20, 2014. http://www.nccn.org/professionals/physician_gls/pdf/distress.pdf.
6. Brown KW, Levy AR, Rosberger Z, Edgar L. Psychological distress and cancer survival: a follow-up 10 years after diagnosis. Psychosom Med. 2003; 65:636–643.
7. Carlson LE, Bultz BD. Efficacy and medical cost offset of psychosocial interventions in cancer care: making the case for economic analyses. Psychooncology. 2004; 13:837–849.
crossref
8. Strasser F, Sweeney C, Willey J, Benisch-Tolley S, Palmer JL, Bruera E. Impact of a half-day multidisciplinary symptom control and palliative care outpatient clinic in a comprehensive cancer center on recommendations, symptom intensity, and patient satisfaction: A retrospective descriptive study. J Pain Symptom Manage. 2004; 27:481–491.
crossref
9. Kvale EA, Murthy R, Taylor R, Lee JY, Nabors L. Distress and quality of life in primary high-grade brain tumor patients. Support Care Cancer. 2009; 17:793–799.
crossref
10. Kwon EJ, Yi MS. Distress and quality of Life in breast cancer survivors in Korea. Asian Oncol Nurs. 2012; 12:289–294.
crossref
11. Shim EJ, Shin JW, Jeon HJ, Hahm BJ. Distress and its correlates in Korean cancer patients: Pilot use of the distress thermometer and the problem list. Psychooncology. 2008; 17:548–555.
crossref
12. Bultz BD, Carlson LE. Emotional distress: the sixth vital sign in cancer care. J Clin Oncol. 2005; 23:6440–6441.
crossref
13. Roth AJ, Kornblith AB, Batel-Copel L, Peabody E, Scher HI, Holland JC. Rapid screening for psychologic distress in men with prostate carcinoma. Cancer. 1998; 82:1904–1908.
crossref
14. Dabrowski M, Boucher K, Ward JH, Lovell MM, Sandre A, Bloch J, et al. Clinical experience with the NCCN distress thermometer in breast cancer patients. J Natl Compr Canc Netw. 2007; 5:104–111.
crossref
15. Jeong K, Heo JE, Tae YS. Relationship among distress, family support, and health promotion Behavior in breast cancer survivors. Asian Oncol Nurs. 2014; 14:146–154.
crossref
16. National Cancer Information Center. 2012 National Cancer statistics. Accessed January 19. 2015. http://www.cancer.go.kr/mbs/cancer/subview.jsp?id=cancer_020403010000.
17. National Cancer Information Center. 2012 National Cancer statistics. Accessed January 19. 2015. http://www.cancer.go.kr/mbs/cancer/subview.jsp?id=cancer_020403020000.
18. Kim SG. Managements of chemotherapy induced nausea and vomiting. Korean J Clin Oncol. 2012; 8:23–29.
crossref
19. Yang YH. Anorexia, nausea and vomiting, and food intake patterns in patients on chemotherapy. J Korean Acad Fundam Nurs. 2004; 11:177–185.
20. Kim GD, Jang HJ. Effects of pain, sleep disturbance, and fatigue on the quality of life in patients with pancreatic cancer undergoing chemotherapy. Asian Oncol Nurs. 2012; 2:117–124.
crossref
21. Youn HJ, Jung SH. Review Article: Care for alopecia during chemotherapy of cancer patients. Korean J Clin Oncol. 2011; 7:34–39.
crossref
22. Chung C, Kim MJ, Rhee MH, Do HG. Functional status and psychosocial adjustment in gynecologic cnacer patients receiving chemotherapy. Korean J Women Health Nurs. 2005; 11:58–66.
crossref
23. An HJ, Tae YS, Han YI. The relationship between spiritual health and uncertainty in cancer patients having chemotherapy. J Korean Oncol Nur. 2007; 7:107–118.
24. LEE JY, Choi S. Quality of life in gynecological cancer patients during chemotherapy. Korean J Women Health Nurs. 2007; 13:290–298.
crossref
25. Cella DF, Tulsky DS. Quality of life in cancer: definition, purpose, and method of measurement. Cancer Invest. 1993; 11:327–336.
crossref
26. Kim H, Yoo HJ, Kim YJ, Han OS, Lee KH, Lee JH, et al. Development and validation of Korean Functional Assessment Cancer Therapy-General (FACT-G). Korean J Clin Psychol. 2003; 22:215–229.
27. Janelsins MC, Kohli S, Mohile SG, Usuki K, Ahles TA, Morrow GR. An update on cancer-and chemotherapy-related cognitive dysfunction: Current status. Semin Oncol. 2011; 38:431–438.
crossref
28. Ahles TA, Saykin AJ, Furstenberg CT, Cole B, Mott LA, Skalla K, et al. Neuropsychologic impact of standard-dose systemic chemotherapy in long-term survivors of breast cancer and lymphoma. J Clin Oncol. 2002; 20:485–493.
crossref
29. Do YS. The relationships between self-care behavior and quality of life among female patients under the chemotherapy [master's thesis]. Seoul: Ewha Womans Univ.;2007.
30. Yun YH, Rhee YS, Kang IO, Lee JS, Bang SM, Lee WS, et al. Economic burdens and quality of life of family caregivers of cancer patients. Oncology. 2005; 68:107–114.
crossref
TOOLS
Similar articles