

 PDF
PDF ePub
ePub Citation
 Print
Print


Abstract
Purpose
The purpose of the present study is to identify the relationship between practicing healthy diet and metabolic syndrome indicators in Koreans.
Methods
This research is a cross-sectional study based on the 2013~2014 Korea National Health and Nutritional Examination Survey. This study investigated 6,748 adults aged 19 to 64 yr (19~49 yr: n = 4,230, 50~64 yr: n = 2,518) to examine practice of healthy diet and metabolic syndrome indicators. In this study, according to practicing healthy diet, we classified subjects into the “Practicing healthy diet (PHD)” group (19~49 yr: n = 1,782, 50~64 yr: n = 937) and “Non-practicing healthy diet (NPHD)” group (19~49 yr: n = 2,448, 50~64 yr: n = 1,581). PHD score was determined by adding the number of practicing factors: adequate fat intake, sodium intake ≤ 2,000 mg/day, fruit & vegetable intake ≥ 500 g/day, and using nutrition label information in food selection.
Results
Female adults had a larger proportion of subjects who practiced a healthy diet compared to male adults (p < 0.001), and the percentages of 19~49 yr and 50~64 yr were 40.46% and 37.07%, respectively. The PHD group consumed significantly more calcium, vitamin B1, B2, and vitamin C density compared to the NPHD group. In 50~64 yr females, the subjects practicing healthy diet (PHD score ≥ 2) was inversely associated with risk of abdominal obesity (OR: 0.71, 95% CI: 0.54~0.93, p value = 0.0131) and metabolic syndrome (OR: 0.70, 95% CI: 0.52~0.94, p value = 0.0166) after adjustments for multiple confounding factors, compared with the lower PHD score (PHD score ≤ 1).
Figures and Tables
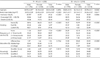
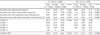
Table 3
Sex distribution and general characteristics of the subjects according to the practicing healthy diet
![]()


Table 6
ORs (95% CIs) of metabolic syndrome risk factors according to practicing healthy diet in adults
1) Model 1 unadjusted; Model 2 adjusted for age, sex, household income, education, smoking, alcohol frequency and energy intake
2) Model 1 unadjusted; Model 2 adjusted for age, household income, education, smoking, alcohol frequency and energy intake
Score is the number of parameters that met the target-specific values of practicing healthy diet.
![]()
References
1. Statistics Korea. A statistical table of the cause of death: 2014. Daejeon: Statistics Korea;2015.
2. Popkin BM. Global nutrition dynamics: the world is shifting rapidly toward a diet linked with noncommunicable diseases. Am J Clin Nutr. 2006; 84(2):289–298.

3. Ministry of Health and Welfare (KR). The forth health plan: 2016-2020. Cheongju: Ministry of Health and Welfare;2015.
4. Arisawa K, Uemura H, Yamaguchi M, Nakamoto M, Hiyoshi M, Sawachika F, Katsuura-Kamano S. Associations of dietary patterns with metabolic syndrome and insulin resistance: a cross-sectional study in a Japanese population. J Med Invest. 2014; 61(3-4):333–344.
5. Narasimhan S, Nagarajan L, Vaidya R, Gunasekaran G, Rajagopal G, Parthasarathy V, Unnikrishnan R, Anjana RM, Mohan V, Sudha V. Dietary fat intake and its association with risk of selected components of the metabolic syndrome among rural South Indians. Indian J Endocrinol Metab. 2016; 20(1):47–54.
6. Chobanian AV, Hill M. National heart, lung, and blood institute workshop on sodium and blood pressure: a critical review of current scientific evidence. Hypertension. 2000; 35(4):858–863.
7. Hennekens CH, Mayrent SL, Willett W. Vitamin A, carotenoids, and retinoids. Cancer. 1986; 58:8 Suppl. 1837–1841.
8. Ziegler RG. A review of epidemiologic evidence that carotenoids reduce the risk of cancer. J Nutr. 1989; 119(1):116–122.
9. Steinmetz KA, Potter JD. Vegetables, fruit, and cancer. II. Mechanisms. Cancer Causes Control. 1991; 2(6):427–442.
10. Ollberding NJ, Wolf RL, Contento I. Food label use and its relation to dietary intake among US adults. J Am Diet Assoc. 2011; 111:5 Suppl. S47–S51.
11. Staser KW, Zollinger TW, Saywell RM Jr, Kunapareddy S, Gibson PJ, Caine VA. Dietary behaviors associated with fruit and vegetable consumption, Marion County, Indiana, 2005. Prev Chronic Dis. 2011; 8(3):A66.
12. Graham DJ, Laska MN. Nutrition label use partially mediates the relationship between attitude toward healthy eating and overall dietary quality among college students. J Acad Nutr Diet. 2012; 112(3):414–418.
13. Zarkin GA, Dean N, Mauskopf JA, Williams R. Potential health benefits of nutrition label changes. Am J Public Health. 1993; 83(5):717–724.
14. WHO Expert Consultation. Appropriate body-mass index for Asian populations and its implications for policy and intervention strategies. Lancet. 2004; 363(9403):157–163.
15. Grundy SM, Cleeman JI, Daniels SR, Donato KA, Eckel RH, Franklin BA, Gordon DJ, Krauss RM, Savage PJ, Smith SC Jr, Spertus JA, Costa F. American Heart Association. National Heart, Lung, and Blood Institute. Diagnosis and management of the metabolic syndrome: an American Heart Association/National Heart, Lung, and Blood Institute Scientific Statement. Circulation. 2005; 112(17):2735–2752.
16. Lee S, Park HS, Kim SM, Kwon HS, Kim DY, Kim DJ, Cho GJ, Han JH, Kim SR, Park CY, Oh SJ, Lee CB, Kim KS, Oh SW, Kim YS, Choi WH, Yoo HJ. Cut-off points of waist circumference for defining abdominal obesity in the Korean population. Korean J Obes. 2006; 15(1):1–9.
17. Jung HJ, Song WO, Paik HY, Joung H. Dietary characteristics of macronutrient intake and the status of metabolic syndrome among Koreans. Korean J Nutr. 2011; 44(2):119–130.
18. Stran KA, Knol LL. Determinants of food label use differ by sex. J Acad Nutr Diet. 2013; 113(5):673–679.
19. Pérez-Escamilla R, Haldeman L, Gray S. Assessment of nutrition education needs in an urban school district in Connecticut: establishing priorities through research. J Am Diet Assoc. 2002; 102(4):559–562.
20. Bae YJ. Evaluation of nutrient and food intake status, and dietary quality in Korean adults according to nutrition label utilization: based on 2010-2011 Korean National Health and Nutrition Examination Survey. J Nutr Health. 2014; 47(3):193–205.
21. Peltzer K. Healthy dietary practices among black and white South Africans. Ethn Dis. 2002; 12(3):336–341.
22. Wardle J, Haase AM, Steptoe A, Nillapun M, Jonwutiwes K, Bellisle F. Gender differences in food choice: the contribution of health beliefs and dieting. Ann Behav Med. 2004; 27(2):107–116.
23. Shelton NJ. What not to eat: inequalities in healthy eating behaviour, evidence from the 1998 Scottish Health Survey. J Public Health (Oxf). 2005; 27(1):36–44.
24. Westenhoefer J. Age and gender dependent profile of food choice. Forum Nutr. 2005; (57):44–51.
25. Ministry of Health and Welfare. Korea Centers for Disease Control and Prevention. Korea Health Statistics 2014: Korea National Health and Nutrition Examination Survey (KNHANES VI-2). Cheongju: Korea Centers for Disease Control and Prevention;2015.
26. Tardivo AP, Nahas-Neto J, Nahas EA, Maesta N, Rodrigues MA, Orsatti FL. Associations between healthy eating patterns and indicators of metabolic risk in postmenopausal women. Nutr J. 2010; 9(1):64.
27. Fappa E, Yannakoulia M, Skoumas Y, Valourdou S, Panagiotakos DB, Pitsavos C, Stefanadis C. Promoting only the consumption of healthy foods may be an alternative stategy for treating patients with the metabolic syndrome. Metabolism. 2012; 61(10):1361–1369.
 XML Download