

 PDF
PDF ePub
ePub Citation
 Print
Print


Abstract
Purpose
This study was conducted among 235 children aged 3 up to 11 yrs to examine the relationship between subjects' eating behaviors and obesity.
Methods
The subjects were divided into three age groups: preschoolers aged 3 to 5 yrs, early elementary school students aged 6 to 8 yrs, and late elementary school students aged 9 to 11 yrs. As a tool for eating behaviors, the recently developed nutrition quotient (NQ) questionnaire was utilized. By age group, scores were gathered and calculated in the five factors, “Balance”, “Diversity”, “Moderation”, “Regularity”, and “Practice”, which make up the NQ scores.
Results
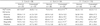
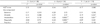
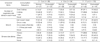
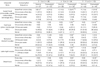
The NQ scores among those aged 3 to 5, 6 to 8, and 9 to 11 yrs did not exhibit any significant differences. Among the scores for the five factors of the NQ, the Diversity scores of those aged 9 to 11 yrs were significantly higher than the scores of those aged 3 to 5 and those aged 6 to 8 yrs. The scores of those aged 3 to 5 and those aged 6 to 8 yrs were higher than the scores of those aged 9 to 11 yrs in Moderation and Regularity. When the subjects were divided into low-weight/normal and overweight/obese groups, among those aged 6 to 8 yrs, the NQ scores, Moderation, Regularity, and Practice scores were higher in the overweight/obese group than those in the low-weight/normal group. Among those aged 9 to 11 yrs, the overweight/obese group scored higher than the low-weight/normal group only in the Moderation component.
Conclusion
From the results, to prevent obesity in elementary school students, it is practical to focus on training related to eating behavior items included in the Moderation component. Furthermore, personalized instructions on eating behaviors and nutritional education based on age are necessary to prevent obesity in children.
Figures and Tables
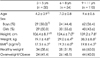


Table 4
Comparison of NQ scores and scores of NQ factors between children by weight status1)
1) Weight categories are based on BMI-for-age percentiles where healthy weight is the 5th percentile to less than the 85th percentile; overweight is the 85th percentile to less than the 95th percentile; and obese is equal to or greater thatn the 95th percentile. 2) NQ: nutrition quotient 3) All values are means ± SD. 4) *p < 0.05, ***p < 0.001 by Student's t-test
![]()
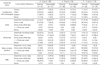
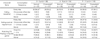
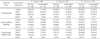
Table 5
Correlation coefficients between body weight and NQ scores of preschoolers and school children
![]()
References
1. Lee JS, Kim HY, Choi YS, Kwak TK, Chung HR, Kwon S, Choi YJ, Lee SK, Kang MH. Comparison of perception and practice levels of dietary life in elementary school children according to gender and obesity status. Korean J Nutr. 2011; 44(6):527–536.

2. Ministry of Health and Welfare, Korea Centers for Disease Control and Prevention. Korea Health Statistics 2013: Korea National Health and Nutrition Examination Survey (KNHANES VI-1). Cheongju: Korea Centers for Disease Control and Prevention;2014.
3. Dietz WH. Health consequences of obesity in youth: childhood predictors of adult disease. Pediatrics. 1998; 101(3 Pt 2):518–525.
4. Korea Centers for Disease Control and Prevention. Report of the Korean youth risk behavior web-based survey. Cheongwon: Korea Centers for Disease Control and Prevention;2012.
5. Martoni M, Carissimi A, Fabbri M, Filardi M, Tonetti L, Natale V. 24-h actigraphic monitoring of motor activity, sleeping and eating behaviors in underweight, normal weight, overweight and obese children. Eat Weight Disord. 2016; 21(4):669–677.
6. Kant AK. Indexes of overall diet quality: a review. J Am Diet Assoc. 1996; 96(8):785–791.
7. Kant AK. Dietary patterns and health outcomes. J Am Diet Assoc. 2004; 104(4):615–635.
8. Michels KB, Schulze MB. Can dietary patterns help us detect diet-disease associations? Nutr Res Rev. 2005; 18(2):241–248.
9. Kang MH, Lee JS, Kim HY, Kwon S, Choi YS, Chung HR, Kwak TK, Cho YH. Selecting items of a food behavior checklist for the development of nutrition quotient (NQ) for children. Korean J Nutr. 2012; 45(4):372–389.
10. Thiagarajah K, Fly AD, Hoelscher DM, Bai Y, Lo K, Leone A, Shertzer JA. Validating the food behavior questions from the elementary school SPAN questionnaire. J Nutr Educ Behav. 2008; 40(5):305–310.
11. Boo MN. Analysis of the children's nutrition quotient and the degree of keeping the dietary guidelines with regard to elementary school children in Jeju [dissertation]. Gyeongsan: Yeungnam University Graduate School of Education;2012.
12. Patterson RE, Haines PS, Popkin BM. Diet quality index: capturing a multidimensional behavior. J Am Diet Assoc. 1994; 94(1):57–64.
13. Kennedy ET, Ohls J, Carlson S, Fleming K. The healthy eating index: design and applications. J Am Diet Assoc. 1995; 95(10):1103–1108.
14. Yook SM, Park S, Moon HK, Kim K, Shim JE, Hwang JY. Development of Korean Healthy Eating Index for adults using the Korea National Health and Nutrition Examination Survey data. J Nutr Health. 2015; 48(5):419–428.
15. Blackburn ML, Townsend MS, Kaiser LL, Martin AC, West EA, Turner BJ, Joy AB. Food behavior checklist effectively evaluates nutrition education. Calif Agric (Berkeley). 2006; 60(1):20–24.
16. Branscum P, Sharma M, Kaye G, Succop P. An evaluation of the validity and reliability of a food behavior checklist modified for children. J Nutr Educ Behav. 2010; 42(5):349–352.
17. Lazarou C, Newby PK. Use of dietary indexes among children in developed countries. Adv Nutr. 2011; 2(4):295–303.
18. Yon M, Hyun T. Development of an eating habit checklist for screening elementary school children at high risk of energy overintake. Korean J Nutr. 2008; 41(5):414–427.
19. Yon M, Hyun T. Development of an eating habit checklist for screening elementary school children at risk of inadequate micronutrient intake. Korean J Nutr. 2009; 42(1):38–47.
20. Kang MH, Kwak TK, Choi YS, Chung HR, Kim HY, Lee JS, Yi NY, Choi JH. Production and evaluation of safety index for children's dietary life. Seoul: Korea Food & Drug Administration;2009.
21. Kim HY, Kwon S, Lee JS, Choi YS, Chung HR, Kwak TK, Park J, Kang MH. Development of a nutrition quotient (NQ) equation modeling for children and the evaluation of its construct validity. Korean J Nutr. 2012; 45(4):390–399.
22. Lee SJ, Kim Y. Evaluation of the diet and nutritional states of elementary and middle school students in the Daegu area by using nutrition quotient for children. J Nutr Health. 2013; 46(5):440–446.
23. Kim JR, Lim HS. Relationships between children’s nutrition quotient and the practice of the dietary guidelines of elementary school students and their mothers. J Nutr Health. 2015; 48(1):58–70.
24. Kim NH, Lee IS. Assessment of nutritional status of children in community child center by nutrition quotient (NQ): Gyeongiu. J East Asian Soc Diet Life. 2015; 25(1):73–86.
25. Yoo JS, Choi YS. Evaluation of items for the food behavior checklist and nutrition quotient score on children in rural areas of Gyeongbuk. J Nutr Health. 2013; 46(5):427–439.
26. Huang YC, Kim HY. Assessment of dietary behavior of Chinese children using nutrition quotient for children. J Nutr Health. 2014; 47(5):342–350.
27. Lim HW. The relationship among nutrient quotient, food environment and fruits and vegetables intake of middle school students in Seoul [dissertation]. Seoul: Kookmin University Graduate School of Education;2013.
28. Kim JH, Jung YH. Evaluation of food behavior and nutritional status of preschool children in Nowon-gu of Seoul by using nutrition quotient (NQ). Korean J Community Nutr. 2014; 19(1):1–11.
29. Reinehr T, Kleber M, Lass N, Toschke AM. Body mass index patterns over 5 y in obese children motivated to participate in a 1-y lifestyle intervention: age as a predictor of long-term success. Am J Clin Nutr. 2010; 91(5):1165–1171.
30. Kleber M, Schaefer A, Winkel K, Hoffmann D, Wunsch R, Kersting M, Reinehr T. Lifestyle intervention “Obeldicks Mini” for obese children aged 4 to 7 years. Klin Padiatr. 2009; 221(5):290–294.
31. Danielsson P, Svensson V, Kowalski J, Nyberg G, Ekblom O, Marcus C. Importance of age for 3-year continuous behavioral obesity treatment success and dropout rate. Obes Facts. 2012; 5(1):34–44.
32. Korea Centers for Disease Control and Prevention. The Korean Pediatric Society. Growth chart for Korean children and adolescents. Seoul: The Korean Pediatric Society;2007.
33. Moraeus L, Lissner L, Olsson L, Sjöberg A. Age and time effects on children's lifestyle and overweight in Sweden. BMC Public Health. 2015; 15(1):355–364.
34. Ek A, Chamberlain KL, Ejderhamn J, Fisher PA, Marcus C, Chamberlain P, Nowicka P. The more and less study: a randomized controlled trial testing different approaches to treat obesity in preschoolers. BMC Public Health. 2015; 15(1):735–751.
35. Golan M, Kaufman V, Shahar DR. Childhood obesity treatment: targeting parents exclusively v. parents and children. Br J Nutr. 2006; 95(5):1008–1015.
36. Larsen JK, Hermans RC, Sleddens EF, Engels RC, Fisher JO, Kremers SP. How parental dietary behavior and food parenting practices affect children’s dietary behavior. Interacting sources of influence? Appetite. 2015; 89:246–257.
37. Tschann JM, Martinez SM, Penilla C, Gregorich SE, Pasch LA, de Groat CL, Flores E, Deardorff J, Greenspan LC, Butte NF. Parental feeding practices and child weight status in Mexican American families: a longitudinal analysis. Int J Behav Nutr Phys Act. 2015; 12(1):66–75.
38. Mitchell GL, Farrow C, Haycraft E, Meyer C. Parental influences on children’s eating behaviour and characteristics of successful parent-focussed interventions. Appetite. 2013; 60(1):85–94.
39. Hughes SO, Power TG, Orlet Fisher J, Mueller S, Nicklas TA. Revisiting a neglected construct: parenting styles in a child-feeding context. Appetite. 2005; 44(1):83–92.
40. Ayyildiz TK, Kurtuncu M, Kulakci H, Celik S. Factors affecting the prevalence of obesity among primary school students in Turkey. Iran Red Crescent Med J. 2014; 16(12):e17785.
41. Sacchetti R, Dallolio L, Musti MA, Guberti E, Garulli A, Beltrami P, Castellazzi F, Centis E, Zenesini C, Coppini C, Rizzoli C, Sardocardalano M, Leoni E. Effects of a school based intervention to promote healthy habits in children 8-11 years old, living in the lowland area of Bologna Local Health Unit. Ann Ig. 2015; 27(2):432–446.
 XML Download