

 PDF
PDF ePub
ePub Citation
 Print
Print


Abstract
Purpose
The aim of this study was to estimate total sugar intake and sugar intake-related dietary habit and nutrient intake of elementary school students.
Methods
Subjects included 701 elementary school students (351 boys and 350 girls) residing in Jeju. The research analyzed a sample and was carried out using the 24 hour recall method and one day consumption of total sugar.
Results
The average daily total sugar intake was 55.3 g (male 53.1 g, female 57.6 g). Total sugar intake per meal was 6.3 g (11.4%) from breakfast, 6.9 g (12.5%) from lunch, and 7.2 g (13.0%) from dinner, 34.9 g (63.1%). Major food groups of total sugar were milks (17.04 g), grains and their products (12.79 g), fruits and their products (9.40 g), and sugars and sweets (7.30 g). In analysis of the amount of total sugar consumption from several recipes, much was taken in from dessert and snacks such as dairy products (15.08 g), bread and snacks (6.4 g), beverages (5.5 g), fruits (5.1 g), and ice cakes (4.8 g). Total sugar consumption was high for rices and side dishes such as noodles (5.1 g), stir-fried foods (2.3 g), fried foods (1.4 g), cooked rice with seasoning (1.4 g), and hard-boiled foods (1.1 g). In comparison of total sugar consumption for sugar sources, daily intake of natural sugar, added sugar, and natural and added sugar were 25.8 g, 23.3 g, and 6.2 g, respectively. High sugar intake group, which was over 20% of the energy from total sugar intakes, consumed significantly less Fe, Zn, and niacin than the low sugar intake group, which was below 20%.
Figures and Tables
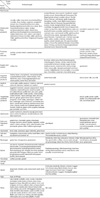
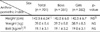
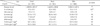
Table 4
Mean daily intake of energy, total sugars, and each sugar of meals in elementary school students
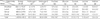
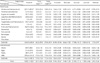
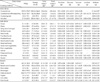
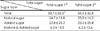
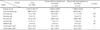
Table 8
Mean daily nutrient intakes by the group according to the percentage of energy gained from total sugars in elementary school students
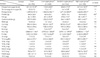
1)Low sugar group: below 10% of the percentage of energy gained from the total sugars according to daily energy intake 2)Medium sugar group: 10-20% of the percentage of energy gained from the total sugars according to daily energy intake 3)High sugar group: over 20% of the percentage of energy gained from the total sugars according to daily energy intake 4)Mean ± SD 5)Significant difference between boys and girls by Chi-square 6)Not significant difference between boys and girls by Chi-square
*p < 0.05, p < 0.01, ***p < 0.001
References
1. Cho SH, Chung CE, Kim SH, Chung HK. Establishment of total sugar reference value for Koreans. Korean J Nutr. 2007; 40:Suppl. 3–8.
2. Ludwig DS, Peterson KE, Gortmaker SL. Relation between consumption of sugar-sweetened drinks and childhood obesity: a prospective, observational analysis. Lancet. 2001; 357(9255):505–508.

3. Gross LS, Li L, Ford ES, Liu S. Increased consumption of refined carbohydrates and the epidemic of type 2 diabetes in the United States: an ecologic assessment. Am J Clin Nutr. 2004; 79(5):774–779.
4. Albrink MJ, Ullrich IH. Interaction of dietary sucrose and fiber on serum lipids in healthy young men fed high carbohydrate diets. Am J Clin Nutr. 1986; 43(3):419–428.
5. Reiser S, Bickard MC, Hallfrisch J, Michaelis OE 4th, Prather ES. Blood lipids and their distribution in lipoproteins in hyperinsulinemic subjects fed three different levels of sucrose. J Nutr. 1981; 111(6):1045–1057.
6. Marckmann P, Raben A, Astrup A. Ad libitum intake of low-fat diets rich in either starchy foods or sucrose: effects on blood lipids, factor VII coagulant activity, and fibrinogen. Metabolism. 2000; 49(6):731–735.
7. Feig DI. Sugar-sweetened beverages and hypertension. Future Cardiol. 2010; 6(6):773–776.
8. Kim Y, Chang H. Correlation between attention deficit hyperactivity disorder and sugar consumption, quality of diet, and dietary behavior in school children. Nutr Res Pract. 2011; 5(3):236–245.
9. Chung CE. Association of total sugar intakes and metabolic syndrome from Korean National Health and Nutrition Examination Survey 2001-2002. Korean J Nutr. 2007; 40:Suppl. 29–38.
10. World Health Organization (CH). Food and Agriculture Organization of the United Nations (IT). Carbohydrates in human nutrition: report of a joint FAO/WHO Expert Consultation Rome, 14-18 April 1997. Rome: Food and Agriculture Organization;1998.
11. Korea Food and Drug Administration. Food labelling regulation. Cheongju: Korea Food and Drug Administration;2006.
12. United States Department of Agriculture, United States Department of Health and Human Services. Nutrition and your health: dietary guidelines for Americans. Home and garden bulletin No. 232. 5th edition. Washington, D.C.: Government Printing Office;2000.
13. Kim SH, Chung HK. Sugar supply and intake of Koreans. Korean J Nutr. 2007; 40:Suppl. 22–28.
14. National Health and Medical Research Council (AU). Dietary guidelines for Australian adults. Canberra: National Health and Medical Research Council;2003.
15. Rayner M, Scarborough P, Williams C. The origin of Guideline Daily Amounts and the Food Standards Agency's guidance on what counts as 'a lot' and 'a little'. Public Health Nutr. 2004; 7(4):549–556.
16. Institute of Grocery Distribution (GB). IGD Working Group Report. Report of the IGD/PIC Industry Nutrition Strategy Group technical working group on Guideline Daily Amounts (GDAs). Watford: Institute of Grocery Distribution;2005.
17. Lee HS, Kwon SO, Yon M, Kim D, Lee JY, Nam J, Park SJ, Yeon JY, Lee SK, Lee HY, Kwon OS, Kim CI. Dietary total sugar intake of Koreans: based on the Korea National Health and Nutrition Examination Survey (KNHANES), 2008-2011. J Nutr Health. 2014; 47(4):268–276.
18. United States Department of Agriculture, Agriculture Research Service. National nutrient database for standard reference release 27 [Internet]. Beltsville (MD): National Agricultural Library;2011. cited 2011 Dec 10. Available from: http://ndb.nal.usda.gov/ndb/.
19. Choi MH, Kwon KI, Kim JY, Lee JS, Kim JW, Park HK, Kim MC, Kim GH. Safety management of children\'s foods: dietary intakes of total sugar and monitoring of total sugar contents in foods. Safe Food. 2008; 3(1):22–29.
20. Kim HY, Park SJ, Chung SY, Choi SH, Oh SW, Lee JS, Choi IS, Shin MS, Song JS. Monitoring the sugar content and intake in school meals from Incheon and Chuncheon. Korean J Food Sci Technol. 2011; 43(1):58–64.
21. Ruxton CH, Gardner EJ, McNulty HM. Is sugar consumption detrimental to health? A review of the evidence 1995-2006. Crit Rev Food Sci Nutr. 2010; 50(1):1–19.
22. The Korean Nutrition Society. Dietary reference intakes for Koreans. 1st revision. Seoul: The Korean Nutrition Society;2010.
23. Korea Centers for Disease Control and Prevention; ; . Korean Pediatric Society. Committee for the Growth Standard for Korean Children and Adolescents. Growth chart in Korean children and adolescent. Cheongwon: Korea Centers for Disease Control and Prevention;2007.
24. Chung CE. Dietary intakes and food sources of total sugars from Korean National Health and Nutrition Examination Survey 2001-2002. Korean J Nutr. 2007; 40:Suppl. 9–21.
25. Choi SK, Choi HJ, Chang NS, Cho SH, Choi YS, Park HK, Joung HJ. Snacking behaviors of middle and high school students in Seoul. Korean J Community Nutr. 2008; 13(2):199–206.
26. Kim SH, Kim KY, Kim HJ, Lee SS, Kim SY. A survey on added sugar intakes from general snacks by adolescents in Daejeon and development of educational materials for guiding their optimal intakes of sugars. Korean J Hum Ecol. 2008; 11(1):5–19.
27. Park YG, Lee EM, Kim CS, Eom JH, Byun JA, Sun NK, Lee JH, Heo OS. Survey on the content and intake pattern of sugar from elementary and middle school foodservices in Daejeon and Chungcheong province. J Korean Soc Food Sci Nutr. 2010; 39(10):1545–1554.
28. Choi MH, Kwon KI, Kim JY, Lee JS, Kim JW, Park HK, Kim MC, Kim GH. Monitoring of total sugar contents in processed foods and noncommercial foodservice foods. Korean J Food Sci Technol. 2008; 40(3):337–342.
29. Panel on Macronutrients, Panel on the Definition of Dietary Fiber, Subcommittee on Upper Reference Levels of Nutrients, Subcommittee on Interpretation and Uses of Dietary Reference Intakes, Standing Committee on the Scientific Evaluation of Dietary Reference Intakes, Food and Nutrition Board, Institute of Medicine (US). Dietary reference intakes for energy, carbohydrate, fiber, fat, fatty acids, cholesterol, protein, and amino acids. Washington, D.C.: National Academies Press;2002.
30. Chung HK, Park SS, Chang MJ. Sugar intake and dietary behavior of children with and without school lunch program. Korean J Diet Cult. 1995; 10(2):107–117.
31. Yu NH, Kim MJ, Han JS. A study on the food intake frequency, dietary habits and nutrition knowledge of middle school students who like sweets in Busan. J Korean Soc Food Sci Nutr. 2007; 36(6):735–744.
32. Ministry of Health and Welfare, Korea Institute for Health and Social Affairs. 2001 National health and nutrition survey. Seoul: Korea Institute for Health and Social Affairs;2002.
33. Song MJ, An EM, Shon HS, Kim SB, Cha YS. A study on the status of beverage consumption of the middle school students in Jeonju. Korean J Community Nutr. 2005; 10(2):174–182.
 XML Download