

 PDF
PDF ePub
ePub Citation
 Print
Print


Abstract
Purpose
Methods
Results
Figures and Tables
Fig. 1
Effect of dietary oils on epidermal proliferation in guinea pigs. (A) Histological appearance of epidermal proliferation in control guinea pigs fed the borage oil (BO) diet for 10 wks (group BO), and essential fatty acid (EFA) deficient guinea pigs fed the hydrogenated coconut oil (HCO) diet for 10 wks or 8 wks followed by feeding BO diet (group HCO + BO) or safflower oil (SO) diet (group HCO + SO) for 2 wks. Arrows indicate that the bottom layer of epidermis and epidermal proliferation is correlated with epidermal thickness from the arrow to the top. (B) Epidermal proliferation of guinea pigs fed different diets as indicated in A. Values are mean ± SEM (n = 4). Means with different letters indicate significant differences at p < 0.05 levels by one-way ANOVA and Tukey's honestly significant difference (HSD) post hoc test.
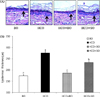
Fig. 2
Altered expression of ceramide metabolic enzymes in control guinea pigs fed the borage oil (BO) diet for 10 wks (group BO), and essential fatty acid (EFA) deficient guinea pigs fed the hydrogenated coconut oil (HCO) diet for 10 wks or 8 wks followed by feeding BO diet (group HCO + BO) or safflower oil (SO) diet (group HCO + SO) for 2 wks. (A) Representative expressions of serine palmitoyltransferase (SPT), β-glucocerebrosidase (GCase), acid sphingomyelinase (aSMase) and acid ceramidase (aCDase) in epidermis of guinea pigs. Protein extracts (15 µg each) from groups BO, HCO, HCO + BO and HCO + SO were subjected to 8% sodium dodecylsulfate-polyacrylamide gel electrophoresis and immunoblotted with polyclonal antiserum against SPT (55 kDa), GCase (60 kDa), aSMase (75 kDa) or aCDase (55 kDa) and with actin (Santa Cruz, CA). (B) The signal intensities from multiple experiments of (A) were quantified, and the integrated areas were normalized, first to the corresponding value of actin and then to the signal observed in the normal control group (group BO). Values are mean ± SEM (n = 4). Means with different letters indicate significant differences at p < 0.05 levels by one-way ANOVA and Tukey's honestly significant difference (HSD) post hoc test. p < 0.01(**) between groups by unpaired Student's t-test.
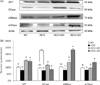
Table 1
Compositions of experimental diets
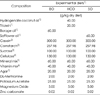
1) Group BO: borage oil (BO) diet for 10 wks, Group HCO: hydrogenated coconut oil (HCO) diet for 10 wks, Group HCO + BO and HCO + SO: HCO diet for 8 wks followed by feeding BO diet (group HCO + BO) or safflower oil (SO) diet (group HCO + SO) for 2 wks 2) Kyungdong (Sungbookgu, Seoul, Korea) 3) Cheiljedang (Seoul, Korea) 4) Sigma, St. Louis, MO 5) Briggs chick salt mixture A, contained in (g/kg) mix: CaCO3, 250; Ca3(PO4)2· 5H2O, 233; CuSO4· H2O, 0.3; ferric citrate· 5H2O, 6.7; MgSO4· 7H2O, 83.3; MnSO4· 4H2O, 7.0; KI, 0.7; K2HPO4, 150; NaCl, 146.7; Na2HPO4, 121.7; ZnCO3, 0.3; ICN Biomedicals, Aurora, OH 6) Vitamin mix provided the following (mg/kg) of the complete diet: D-a-tocopherol, 134; L-ascorbic acid, 1,800; choline chloride, 30,000; D-calcium panththenate, 120; inositol, 200; menadione, 90; niacin, 180; p-amino-benzoic acid, 200; pyridoxine HCL, 40; riboflavin, 40; thiamin HCL, 40; retinyl acetate, 10.8; biotin, 0.8; folic acid, 3.6; cyanocobalamin, 0.054; ICN Biomedicals, Aurora, OH 7) BD Biosciences (Sparks, MD)
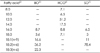
Table 3
Levels of ceramide, glucosylceramide and sphingomyelin species
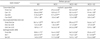
1) Control guinea pigs fed the borage oil (BO) diet for 10 wks (group BO), and essential fatty acid (EFA) deficient guinea pigs fed the hydrogenated coconut oil (HCO) diet for 10 wks or 8 wks followed by feeding BO diet (group HCO + BO) or safflower oil (SO) diet (group HCO + SO) for 2 wks. 2) Individual species of Cer1-7, GlcCer-A/B/C/D or SM1-3 were fractionated by high-performance thin layer chromatography (HPTLC). 3) Values are mean ± SEM (n = 4).
a,bMeans with different letters in the same row indicate significant differences (p < 0.05) using one way ANOVA and Tukey's honestly significant difference (HSD) post hoc test.
 XML Download