

 PDF
PDF ePub
ePub Citation
 Print
Print


Abstract
Purpose:
This study was planned to determine the characteristics of extremely obese patients during Bariatric surgery and to evaluate how the difference in the number of postsurgical personal nutritional educations they received affected the weight loss.
Methods:
This is a retrospective study on the basis of the medical records of extremely obese patients for 15 months after receiving gastric banding. A total of 60 people were selected as the study subjects and they were divided into the Less Educated Group and the More Educated Group according to the average number of personal nutritional educations they received. We investigated both groups to determine the general characteristic, health related lifestyle habits, obesity related complications and symptoms in possession, and eating habits before their surgery, the body composition measurement result, obesity determination indices at 1, 3, 6, 9, 12, and 15 months before and after their surgery, and the biochemical parameters at 6 months before and after their surgery.
Results:
Body fat and weight showed rapid reduction until 6 months after the surgery, but thereafter reduced slowly depending on the result of body composition measurement. Regarding body fat and weight, the More Educated Group, who received nutrition education more often, showed significantly lower levels than the Less Educated Group at 15 months after surgery. Regarding BMI and degree of obesity, the More Educated Group showed significantly lower levels than the Less Educated Group at 15 months after surgery. Here, we were assured that BMI is reversely proportional to the number of personal nutritional educations at 15 months, which is more outstanding after surgery than before surgery.
Conclusion:
Long-term nutritional education is a key factor for the extremely obese patient in maintaining the effects of Bariatric surgery on weight and body fat reduction onwards. In the next stage, considering the characteristics of the study subjects, adoption of individual nutrition education is recommended for postsurgical prospective arbitration of obesity in order to monitor blood pressure, obesity related complications, symptoms in possession, and how eating habits and health related life habits change, and to judge the actual effect of the nutritional education method at the same time.
Go to : 
REFERENCES
1.World Health Organization (CH). Obesity and overweight [Internet]. Geneva: WHO Media Centre;2011. [cited 2014 Jun 12]; Available from:. http://www.who.int/mediacentre/factsheets/fs311/en/.
2.Ministry of Health and Welfare, Korea Centers for Disease Control and Prevention. Korea Health Statistics 2012: Korea National Health and Nutrition Examination Survey (KNHANES V-3). Cheongwon: Korea Centers for Disease Control and Prevention;2013.
3.Heo YS., Park JM., Kim YJ., Kim SM., Park DJ., Lee SK., Han SM., Shim KW., Lee YJ., Lee JY., Kwon JW. Bariatric surgery versus conventional therapy in obese Korea patients: a multicenter retrospective cohort study. J Korean Surg Soc. 2012. 83(6):335–342.

4.Eckel RH. Clinical practice. Nonsurgical management of obesity in adults. N Engl J Med. 2008. 358(18):1941–1950.
5.Ahn BC., Joung H. Socioeconomic cost of obesity in Korea. Korean J Nutr. 2005. 38(9):786–792.
6.Nam S., Park J. Depression and stress related to obesity among normal, obese, and severe obese groups: comparison among normal, obesity, and severe obesity group. Korean J Hum Ecol. 2012. 21(6):1199–1210.
7.Wittgrove AC., Clark GW., Schubert KR. Laparoscopic Gastric Bypass, Roux-en-Y: technique and results in 75 patients with 3-30 months follow-up. Obes Surg. 1996. 6(6):500–504.
8.Björntorp P. Metabolic implications of body fat distribution. Diabetes Care. 1991. 14(12):1132–1143.
9.Kang JG., Lee CB., Lee HS., Bae SC., Choi WH. Effect of weight reduction after group therapy on the quality of life of patients with obesity. Korean J Obes. 2005. 14(3):149–154.
10.Hur Y. A review of bariatric surgery procedures and outcomes. Korean J Obes. 2008. 17(4):141–153.
11.Cummings DE., Overduin J., Foster-Schubert KE. Gastric bypass for obesity: mechanisms of weight loss and diabetes resolution. J Clin Endocrinol Metab. 2004. 89(6):2608–2615.
12.Belle SH., Berk PD., Courcoulas AP., Flum DR., Miles CW., Mitchell JE., Pories WJ., Wolfe BM., Yanovski SZ. Longitudinal Assessment of Bariatric Surgery Consortium Writing Group. Safety and efficacy of bariatric surgery: Longitudinal Assessment of Bariatric Surgery. Surg Obes Relat Dis. 2007. 3(2):116–126.
13.Schauer PR., Ikramuddin S., Gourash W., Ramanathan R., Luketich J. Outcomes after laparoscopic Roux-en-Y gastric bypass for morbid obesity. Ann Surg. 2000. 232(4):515–529.
14.O'Brien PE., Brown WA., Smith A., McMurrick PJ., Stephens M. Prospective study of a laparoscopically placed, adjustable gastric band in the treatment of morbid obesity. Br J Surg. 1999. 86(1):113–118.
15.Belachew M., Belva PH., Desaive C. Long-term results of laparoscopic adjustable gastric banding for the treatment of morbid obesity. Obes Surg. 2002. 12(4):564–568.
16.Allied Health Sciences Section Ad Hoc Nutrition Committee. Aills L., Blankenship J., Buffington C., Furtado M., Parrott J. ASMBS allied health nutritional guidelines for the surgical weight loss patient. Surg Obes Relat Dis. 2008. 4(5 Suppl):S73–S108.
17.Kim DM., Ahn CW., Choi SH. Surgical treatment of morbid obesity-focusing on laparoscopic Roux-en-Y Gastric Bypass Surgery. J Korean Soc Study Obes. 2004. 13(2):97–100.
18.Lee H., Kim M., Kwon H., Song K., Kim E. The impact of metabolic and bariatric surgery on morbidly obese patients with type 2 DM. J Korean Surg Soc. 2010. 79(1):8–13.
19.Kim HJ., Namgung SA., Hong JI., Mok HJ. A study on the standards of medical-nutritional-education by the type of bariatric surgery in morbid-obesity patients. J Korean Diet Assoc. 2010. 16(2):178–187.
20.Drewnowski A., Popkin BM. The nutrition transition: new trends in the global diet. Nutr Rev. 1997. 55(2):31–43.
21.Giusti V., Suter M., Héraïef E., Gaillard RC., Burckhardt P. Effects of laparoscopic gastric banding on body composition, metabolic profile and nutritional status of obese women: 12-months follow-up. Obes Surg. 2004. 14(2):239–245.
22.Schindler K., Prager G., Ballaban T., Kretschmer S., Riener R., Bura-nyi B., Maier C., Luger A., Ludvik B. Impact of laparoscopic adjustable gastric banding on plasma ghrelin, eating behaviour and body weight. Eur J Clin Invest. 2004. 34(8):549–554.
23.Kim OH., Jung H., Kim JH. Comparison of food intakes and serum lipid levels in overweight and obese women by body mass index. Korean J Community Nutr. 2007. 12(1):40–49.
24.Suter PM. Effect of alcohol on body weight. Nutr Clin Care. 2000. 3(2):102–108.
25.Westerterp-Plantenga MS., Verwegen CR. The appetizing effect of an aperitif in overweight and normal-weight humans. Am J Clin Nutr. 1999. 69(2):205–212.
26.Bamia C., Trichopoulou A., Lenas D., Trichopoulos D. Tobacco smoking in relation to body fat mass and distribution in a general population sample. Int J Obes Relat Metab Disord. 2004. 28(8):1091–1096.
27.Canoy D., Wareham N., Luben R., Welch A., Bingham S., Day N., Khaw KT. Cigarette smoking and fat distribution in 21,828 British men and women: a population-based study. Obes Res. 2005. 13(8):1466–1475.
28.Choe JM. Dynamical trait for Korean obesity: based on data for National Health Nutrition Surveys, 1998. J Korean Soc Study Obes. 2001. 10(3):293–295.
29.Holty JE., Parimi N., Ballesteros M., Blackwell T., Cirangle PT., Jos-sart GH., Kimbrough ND., Rose JM., Stone KL., Bravata DM. Does surgically induced weight loss improve daytime sleepiness? Obes Surg. 2011. 21(10):1535–1545.
30.Kang JS., Kim HS. A study on the evaluation of a nutritional education program for the middle aged obese women. Korean J Food Nutr. 2004. 17(4):356–367.
31.Kim HK., Kim MJ. Effects of weight control program on dietary habits and blood composition in obese middle-aged women. Korean J Nutr. 2010. 43(3):273–284.
32.Kim MK., Lee GC. Weight reduction dieting survey and satisfaction degree and diet related knowledge among adult women by age. J Korean Soc Food Sci Nutr. 2006. 35(5):572–582.
33.Yoo SJ. Pharmacological treatment of obesity. J Korean Endocr Soc. 2008. 23(4):223–233.
34.Thompson WR., Gordon NF., Pescatello LS. American College of Sports Medicine. ACSM's guidelines for exercise testing and prescription. 8th edition.Philadelphia (PA): Wolters Kluwer Lippin-cott Williams & Wilkins;2010.
35.Wang N., Hikida RS., Staron RS., Simoneau JA. Muscle fiber types of women after resistance training—quantitative ultrastructure and enzyme activity. Pflugers Arch. 1993. 424(5-6):494–502.
36.Park SK., Kim EH., Kwon YC., Park JK., Kang SY., Jang JH. Effects of combined exercise program on health-related physical fitness, anti-aging hormone and prevention of sarcopenia in elderly women with sarcopenia. J Sport Leis Stud. 2010. 40(1):435–442.
37.Hong JY., Oak JS. Effects of 12 weeks aerobic.anaerobic combined exercise training on fitness, body composition, skeletal muscle index and blood lipid profiles in obese elderly women. Korean J Obes. 2013. 22(1):30–38.
38.Park SK., Kim EH. Effects of combined training and ACE polymorphism on risk factors of metabolic syndrome in the older women. Korean J Phys Educ. 2006. 45(2):503–514.
39.Won HS., Lee HJ., Kwak JS., Kim J., Kim MK., Kwon O. Study on purchase and intake patterns of individuals consuming dietary formula for weight control or health/functional foods. Korean J Nutr. 2012. 45(6):541–551.
40.Chang KJ. Treatment of obese women with low calorie diet, aerobic exercise and behavior modification. J Korean Soc Food Nutr. 1995. 24(4):510–516.
41.Kenler HA., Brolin RE., Cody RP. Changes in eating behavior after horizontal gastroplasty and Roux-en-Y gastric bypass. Am J Clin Nutr. 1990. 52(1):87–92.
42.Lee JH. Bariatric surgery. Korean J Med. 2013. 84(5):640–649.
43.Rexrode KM., Carey VJ., Hennekens CH., Walters EE., Colditz GA., Stampfer MJ., Willett WC., Manson JE. Abdominal adiposity and coronary heart disease in women. JAMA. 1998. 280(21):1843–1848.
44.Baik I., Ascherio A., Rimm EB., Giovannucci E., Spiegelman D., Stampfer MJ., Willett WC. Adiposity and mortality in men. Am J Epidemiol. 2000. 152(3):264–271.
45.Clark JM., Alkhuraishi AR., Solga SF., Alli P., Diehl AM., Magnuson TH. Roux-en-Y gastric bypass improves liver histology in patients with non-alcoholic fatty liver disease. Obes Res. 2005. 13(7):1180–1186.
46.International Expert Committee. International Expert Committee report on the role of the A1C assay in the diagnosis of diabetes. Diabetes Care. 2009. 32(7):1327–1334.
47.Cummings S., Apovian CM., Khaodhiar L. Obesity surgery: evidence for diabetes prevention/management. J Am Diet Assoc. 2008. 108(4 Suppl 1):S40–S44.
48.Guidone C., Manco M., Valera-Mora E., Iaconelli A., Gniuli D., Mari A., Nanni G., Castagneto M., Calvani M., Mingrone G. Mechanisms of recovery from type 2 diabetes after malabsorptive bariatric surgery. Diabetes. 2006. 55(7):2025–2031.
49.Jung MS., Bae JH., Kim YH. Relationships between dietary intake and serum lipid profile of subjects who visited health promotion center. J Korean Soc Food Sci Nutr. 2008. 37(12):1583–1588.
Go to :
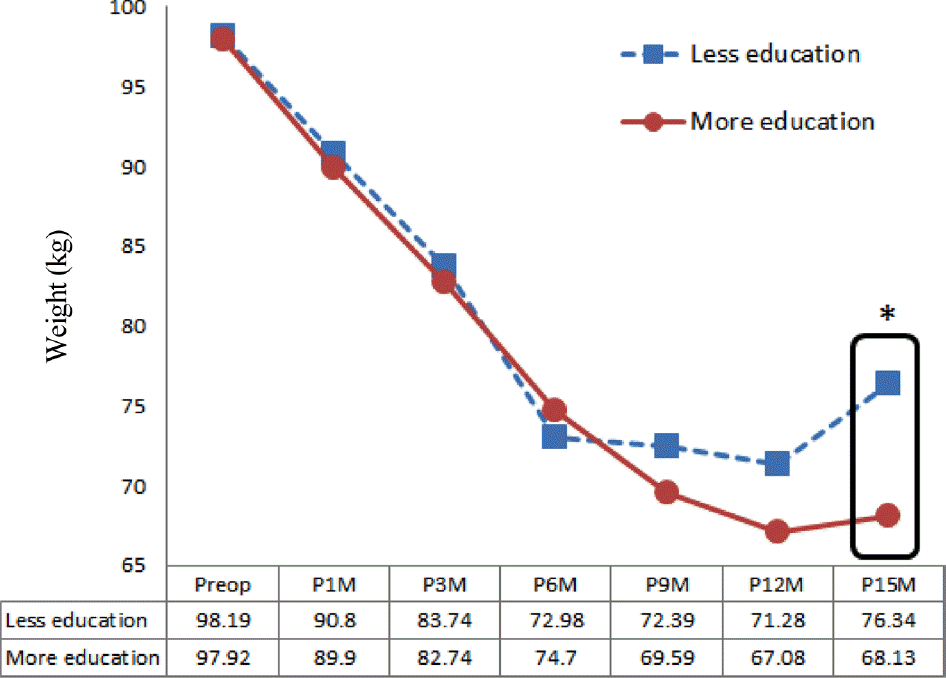
Table 1.
Nutrition education contents
Table 2.
General characteristics of the subjects according to level of education
Table 3.
Health-related lifestyle of the subjects according to level of education
Table 4.
Obesity complications of the subjects according to level of education
Table 5.
Dietary habits of the subjects according to level of education
Table 6.
Nonoperative treatments of the subjects according to level of education
Table 7.
Body composition of the subjects according to level of education1)
Table 8.
Change of nutritional assessment index1)
Table 9.
Blood biochemical parameters in preoperation and 6 months postoperation1)
 XML Download