

 PDF
PDF ePub
ePub Citation
 Print
Print


Abstract
The aim of this study was to determine whether Nutrition Quotient (NQ) for children, which has been developed from data on urban children, can be applied to children in rural areas. A total of 200 children (108 boys and 92 girls) in fifth and sixth grade at three elementary schools in rural areas of Gyeongbuk participated in the survey conducted during June 2012. Questionnaires consisted of items on food intake frequency and dietary behavior. Food intake data were obtained using the 24-hour recall method, and nutrient intake was calculated using the CAN-Pro 4.0 Program. Percentages of children who took less than the estimated average requirement were 76.5%, 49.5%, 45.5%, 33.5%, and 26.0% for calcium, vitamin C, iron, vitamin A, and folate, respectively. Significant associations were observed between intake frequencies of vegetables, kimchi, and fruits, and intake of vitamin C, folate, and dietary fiber. White milk and legumes showed positive correlation with intake of calcium and vitamin A. Eating breakfast, meal regularity, and diverse side dishes showed positive correlation with intake of folate and calcium. The 19 food checklist items could be categorized according to five factors. The mean NQ score of the subjects was 62.0, which was similar to that of urban children, 64.4. NQ score and factor scores for balance, regularity, and practice were significantly lower in children with lower socioeconomic level as compared to those with higher socioeconomic level. Higher NQ score showed an association with increased intake of vitamin B2, folate, vitamin C, and calcium. In conclusion, NQ offers a valuable instrument for evaluation of food habit and dietary quality of rural children as well as urban children, and children with low socioeconomic status should be monitored by testing with NQ checklist before implementation of nutrition programs.
Figures and Tables
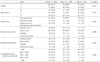

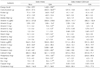
Table 4
Pearson correlation coefficients between scores of food frequency checklist items of NQ and dietary nutrient intakes by the children
![]()
Table 5
Pearson correlation coefficients between scores of food behavior checklist items of NQ and dietary nutrient intakes by the children
![]()
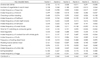


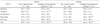
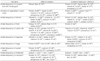
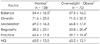
Table 10
Comparison of NQ scores and scores of factors between children with normal weight and overweight·obese children
![]()
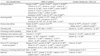
Table 11
Percentage of intake level to recommended intake or adequate intake according to NQ grade
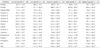
Lowest grade: NQ percentile < 10% (0-47.5 points), Low grade: 10%≤ NQ percentile < 25% (47.6-56.4 points), Medium grade: 25% ≤ NQ percentile < 75% (56.5-73.7 points), High grade: 75% ≤ NQ percentile < 90% (73.8-80.9 points), Highest grade: NQ percentile ≥ 90% (81.0-100 points)
1) Mean ± SD 2) abc: Different alphabets are significantly different by Duncan's multiple test (p < 0.05).
![]()
References
1. Willett WC, Stampfer MJ. Current evidence on healthy eating. Annu Rev Public Health. 2013; 34:77–95.

2. Story M, Kaphingst KM, Robinson-O'Brien R, Glanz K. Creating healthy food and eating environment: policy and environmental approaches. Annu Rev Public Health. 2008; 29:253–272.
3. Lee JS, Kim HY, Choi YS, Kwak TK, Chung HR, Kwon S, Choi YJ, Lee SK, Kang MH. Comparison of perception and practice levels of dietary life in elementary school children according to gender and obesity status. Korean J Nutr. 2011; 44(6):527–536.
4. Ministry of Education, Science and Technology. 2012 School Health Examinations. Seoul: Ministry of Education, Science and Technology;2013.
5. Davis MM, Gance-Cleveland B, Hassink S, Johnson R, Paradis G, Resnicow K. Recommendations for prevention of childhood obesity. Pediatrics. 2007; 120:Suppl 4. S229–S253.
6. Grimes CA, Riddell LJ, Campbell KJ, Nowson CA. Dietary salt intake, sugar-sweetened beverage consumption, and obesity risk. Pediatrics. 2013; 131(1):14–21.
7. Kim HY, Lee NR, Lee JS, Choi YS, Kwak TK, Chung HR, Kwon S, Choi YJ, Lee SK, Kang MH. Meal skipping relates to food choice, understanding of nutrition labeling, and prevalence of obesity in Korean fifth grade children. Nutr Res Pract. 2012; 6(4):328–333.
8. Jeong NY, Kim KW. Nutrition knowledge and eating behaviors of elementary school children in Seoul. Korean J Community Nutr. 2009; 14(1):55–66.
9. Na SY, Ko SY, Eom SH, Kim KW. Intakes and beliefs of vegetables and fruits, self-efficacy, nutrition knowledge, eating behavior of elementary school students in Kyunggi area. Korean J Community Nutr. 2010; 15(3):329–341.
10. Kim KH. Food habits, eating behaviors and food frequency by gender and among Seoul and other regions in upper-grade elementary school children. Korean J Community Nutr. 2010; 15(2):180–190.
11. Taylor JP, Evers S, McKenna M. Determinants of healthy eating in children and youth. Can J Public Health. 2005; 96:Suppl 3. S20–S26. S22–S29.
12. Jang HB, Park JY, Lee HJ, Kang JH, Park KH, Song J. Association between parental socioeconomic level, overweight, and eating habits with diet quality in Korean sixth grade school children. Korean J Nutr. 2011; 44(5):416–427.
13. Kant AK. Indexes of overall diet quality: a review. J Am Diet Assoc. 1996; 96(8):785–791.
14. Lazarou C, Newby PK. Use of dietary indexes among children in developed countries. Adv Nutr. 2011; 2(4):295–303.
15. Patterson RE, Haines PS, Popkin BM. Diet quality index: capturing a multidimensional behavior. J Am Diet Assoc. 1994; 94(1):57–64.
16. Haines PS, Siega-Riz AM, Popkin BM. The Diet Quality Index revised: a measurement instrument for populations. J Am Diet Assoc. 1999; 99(6):697–704.
17. Kim S, Haines PS, Siega-Riz AM, Popkin BM. The Diet Quality Index-International (DQI-I) provides an effective tool for cross-national comparison of diet quality as illustrated by China and the United States. J Nutr. 2003; 133(11):3476–3484.
18. Kennedy ET, Ohls J, Carlson S, Fleming K. The Healthy Eating Index: design and applications. J Am Diet Assoc. 1995; 95(10):1103–1108.
19. Guenther PM, Reedy J, Krebs-Smith SM, Reeve BB, Basiotis PP. Development and evaluation of the healthy eating index-2005: technical report. Alexandria (VA): U.S. Department of Agriculture, Center for Nutrition Policy and Promotion;2007.
20. Hurley KM, Oberlander SE, Merry BC, Wrobleski MM, Klassen AC, Black MM. The healthy eating index and youth healthy eating index are unique, nonredundant measures of diet quality among low-income, African American adolescents. J Nutr. 2009; 139(2):359–364.
21. Townsend MS, Kaiser LL, Allen LH, Joy AB, Murphy SP. Selecting items for a food behavior checklist for a limited-resource audience. J Nutr Educ Behav. 2003; 35(2):69–77.
22. Murphy SP, Kaiser LL, Townsend MS, Allen LH. Evaluation of validity of items for a food behavior checklist. J Am Diet Assoc. 2001; 101(7):751–761.
23. Serra-Majem L, Ribas L, Ngo J, Ortega RM, García A, Pérez-Rodrigo C, Aranceta J. Food, youth and the Mediterranean diet in Spain. Development of KIDMED, Mediterranean Diet Quality Index in children and adolescents. Public Health Nutr. 2004; 7(7):931–935.
24. Branscum P, Sharma M, Kaye G, Succop P. An evaluation of the validity and reliability of a food behavior checklist modified for children. J Nutr Educ Behav. 2010; 42(5):349–352.
25. Yon M, Hyun T. Development of an eating habit checklist for screening elementary school children at high risk of energy over-intake. Korean J Nutr. 2008; 41(5):414–427.
26. Yon M, Hyun T. Development of an eating habit checklist for screening elementary school children at risk of inadequate micronutrient intake. Korean J Nutr. 2009; 42(1):38–47.
27. Kang MH, Lee JS, Kim HY, Kwon S, Choi YS, Chung HR, Kwak TK, Cho YH. Selecting items of a food behavior checklist for the development of Nutrition Quotient (NQ) for children. Korean J Nutr. 2012; 45(4):372–389.
28. Kim HY, Kwon S, Lee JS, Choi YS, Chung HR, Kwak TK, Park J, Kang MH. Development of a Nutrition Quotient (NQ) equation modeling for children and the evaluation of its construct validity. Korean J Nutr. 2012; 45(4):390–399.
29. Korea Centers for Disease Control and Prevention. 2007 Korean national growth charts: review of developmental process and outlook. Cheongwon: Korea Centers for Disease Control and Prevention;2007.
30. Centers of Disease Control and Prevention. Healthy weight: children and teens - about BMI [Internet]. Atlanta (GA): Centers of Disease Control and Prevention;2011. cited 2013 Sep 23. Available form: http://www.cdc.gov/healthyweight/assessing/bmi/childrens_bmi/about_childrens_bmi.html.
31. The Korean Nutrition Society. Dietary reference intakes for Koreans 2010. Seoul: The Korean Nutrition Society;2010.
32. Blackburn ML, Townsend MS, Kaiser LL, Martin AC, West EA, Turner BJ, Joy AB. Food behavior checklist effectively evaluates nutrition education. Calif Agric. 2006; 60(1):20–24.
33. Ministry of Health and Welfare, Korea Centers for Disease Control and Prevention. The fifth Korea National Health and Nutrition Examination Survey report (KNHANES V-1). Seoul: Ministry of Health and Welfare;2011.
34. Lee Y, Shim JE, Yoon J. Change of children's meal structure in terms of temporal and spatial dimensions: analysis of the data from the Korea National Health and Nutrition Examination Surveys of 1998 and 2009. Korean J Community Nutr. 2012; 17(1):109–118.
35. Kleiser C, Mensink GB, Scheidt-Nave C, Kurth BM. HuSKY: a healthy nutrition score based on food intake of children and adolescents in Germany. Br J Nutr. 2009; 102(4):610–618.
36. Kleiser C, Schaffrath Rosario A, Mensink GB, Prinz-Langenohl R, Kurth BM. Potential determinants of obesity among children and adolescents in Germany: results from the cross-sectional KiGGS study. BMC Public Health. 2009; 9:46.
37. Ahrens W, Bammann K, de Henauw S, Halford J, Palou A, Pigeot I, Siani A, Sjöström M. European Consortium of the IDEFICS Project. Understanding and preventing childhood obesity and related disorders--IDEFICS: a European multilevel epidemiological approach. Nutr Metab Cardiovasc Dis. 2006; 16(4):302–308.
38. Jeon MS, Kim HO. A predictive model of health promotion behavior in obese school-age children. J Korean Acad Nurs. 2010; 40(2):264–276.
 XML Download