Abstract
Caloric restriction is recognized as one of the best treatment options for obesity, and is associated with changes in body composition. The purpose of this study was to determine the influence of age in caloric restriction in overweight and obese women. In this caloric restriction study, nutrient intake of 61 women was evaluated using food records written by subjects for three days. Body composition and metabolic risk factors were assessed before and after caloric restriction. Blood levels of lipids, glucose, leptin, and adiponectin were measured. Visceral fat and subcutaneous fat were evaluated using bioimpedance analysis. General linear models (GLM) identified the independent effects of age after co-varying baseline weight and difference of energy intake. Weight, fat mass, visceral fat, subcutaneous fat, and blood pressure showed a significant decrease by caloric restriction of 452 kcal/day. The percent changes in weight, visceral fat, and subcutaneous fat were −4.5%, −12.0%, and −8.2%, respectively, after caloric restriction. The percent changes of weight, visceral fat, and subcutaneous fat showed an independent association with age co-varying baseline weight and difference of energy intake. Decreased change in percent of leptin by caloric restriction also showed an association with age. Changes in body composition and leptin by caloric restriction showed an independent association with age. This may indicate greater difficulty in achievement of change of body composition as well as greater obesity-related metabolic risk with aging. Therefore, caloric restriction considering age should be recommended for effective dietary treatment in overweight or obese women. (J Nutr Health 2013; 46(5): 410 – 417)
References
1). Ministry of Health and Welfare, Korea Centers for Disease Control and Prevention. Korea health statistics 2009: Korea National Health and Nutrition Examination Survey (KNHANESIV-3). Seoul: Ministry of Health and Welfare;2010.
2). Ogden CL, Carroll MD. Prevalence of overweight, obesity, and extreme obesity among adults: United States, trends 1960-1962 through 2007–2008. Atlanta (GA): National Center for Health Statistics;2010.
3). Laddu D, Dow C, Hingle M, Thomson C, Going S. A review of evidence-based strategies to treat obesity in adults. Nutr Clin Pract. 2011; 26(5):512–525.

4). Swinburn B, Egger G. Preventive strategies against weight gain and obesity. Obes Rev. 2002; 3(4):289–301.

5). Ahmadi N, Eshaghian S, Huizenga R, Sosnin K, Ebrahimi R, Siegel R. Effects of intense exercise and moderate caloric restriction on cardiovascular risk factors and inflammation. Am J Med. 2011; 124(10):978–982.

6). Kim MS, Choi MS, Kim KN. Effect of nutritional education and exercise intervention on reducing and maintaining weight in obese women. Korean J Community Nutr. 2007; 12(1):80–89.
7). Schwarz NA, Rigby BR, La Bounty P, Shelmadine B, Bowden RG. A review of weight control strategies and their effects on the regulation of hormonal balance. J Nutr Metab. 2011; 2011:237932.

8). Arrebola E, Gómez-Candela C, Fernández-Fernández C, Loria V, Muñoz-Pérez E, Bermejo LM. Evaluation of a lifestyle modification program for treatment of overweight and nonmorbid obesity in primary healthcare and its influence on health-related quality of life. Nutr Clin Pract. 2011; 26(3):316–321.

9). Kim YY, Lee IH, Lee IS, Choue RW. Effect of 8 weeks of low calorie diet on body composition and blood parameters in the people with BMI greater than 23 kg/m2. J East Asian Soc Diet Life. 2008; 18(5):725–731.
10). Lee J, Lee H, Yim J, Kim Y, Choue R. Effects of medical nutrition therapy on changes of anthropometric measurements, dietary pattern and blood parameters in over weight or obese women. Korean J Nutr. 2005; 38(6):432–444.
11). Choi IS, Kim KA, Yim JE, Kim YS. Calorie restriction and obesity under the regulation of SIRT1. Korean J Obes. 2011; 20(4):170–176.

12). Finkler E, Heymsfield SB, St-Onge MP. Rate of weight loss can be predicted by patient characteristics and intervention strategies. J Acad Nutr Diet. 2012; 112(1):75–80.

13). Kim S, Choue R, Yim J, Kim Y. Effects of Apo E polymorphisms and dietary counseling on the levels of plasma lipids in hyperlipidemic patients. Korean J Nutr. 1998; 31(9):1411–1421.
14). Choue R, Yim J, Kim S, Kim Y. Effects of nutrition therapy and drug treatment on the blood lipid levels in patients with hyperlipidemia according to genetic polymorphism of Apo CIII. Korean J Nutr. 2000; 33(8):813–823.
15). St-Onge MP, Gallagher D. Body composition changes with aging: the cause or the result of alterations in metabolic rate and macronutrient oxidation? Nutrition. 2010; 26(2):152–155.

16). Amati F, Pennant M, Azuma K, Dubé JJ, Toledo FG, Rossi AP, Kelley DE, Goodpaster BH. Lower thigh subcutaneous and higher visceral abdominal adipose tissue content both contribute to insulin resistance. Obesity (Silver Spring). 2012; 20(5):1115–1117.

17). Yoon JH. Resistance exercise strategies for sarcopenic obesity in elderly people. Korean J Obes. 2012; 21(1):5–10.

18). Shin HM, Jee SH, Kim JH, Kim MR. The influence on cardiovascular mortality of the metabolic syndrome in Korean postmenopausal women. J Korean Soc Menopause. 2012; 18(1):6–14.

19). Ahn HJ, Cho YO, Kwon HR, Ku YH, Koo BK, Han KA, Min KW. The effects of low-calorie diets on abdominal visceral fat, muscle mass, and dietary quality in obese type 2 diabetic subjects. Korean Diabetes J. 2009; 33(6):526–536.

20). Seo YW, Lee HJ, Yun KE, Park HS. Energy intake and resting energy expenditure of middle-aged obese Korean women. Korean J Obes. 2009; 18(1):31–37.
21). Son SM, Kim HJ. Effect of 12-week low calorie diet and behavior modification on the anthropomeric indices and biochemical nutritional status of obese woman. Korean J Community Nutr. 2005; 10(4):525–535.
22). Choi MS. Effects of nutrition education and exercise intervention on health and diet quality of middle-aged women. Korean J Nutr. 2009; 42(1):48–58.
23). Kim HK, Kim MJ. Effects of weight control program on dietary habits and blood composition in obese middle-aged women. Korean J Nutr. 2010; 43(3):273–284.

24). Gasteyger C, Larsen TM, Vercruysse F, Pedersen D, Toubro S, Astrup A. Visceral fat loss induced by a low-calorie diet: a direct comparison between women and men. Diabetes Obes Metab. 2009; 11(6):596–602.

25). Kang JH, Kim SW, Park HS, Kim HS. Comparison of clinical usefulness of low-calorie-diet combined with exercise and low-calorie-diet alone. J Korean Acad Fam Med. 1998; 19(2):167–176.
26). Barone Gibbs B, Kinzel LS, Pettee Gabriel K, Chang YF, Kuller LH. Short- and longterm eating habit modification predicts weight change in overweight, postmenopausal women: results from the WOMAN study. J Acad Nutr Diet. 2012; 112(9):1347–1355. 1355.e1–2.

27). Poehlman ET, Goran MI, Gardner AW, Ades PA, Arciero PJ, Ka-tzman-Rooks SM, Montgomery SM, Toth MJ, Sutherland PT. Determinants of decline in resting metabolic rate in aging females. Am J Physiol. 1993; 264(3 Pt 1):E450–E455.

28). Yeo E. Menopause, aging and obesity. J Korean Soc Study Obes. 2002; 11(3):289–298.
29). Tchernof A, Després JP. Sex steroid hormones, sex hormone-binding globulin, and obesity in men and women. Horm Metab Res. 2000; 32(11–12):526–536.

30). Lovejoy JC, Champagne CM, de Jonge L, Xie H, Smith SR. Increased visceral fat and decreased energy expenditure during the menopausal transition. Int J Obes (Lond). 2008; 32(6):949–958.

31). Carr MC. The emergence of the metabolic syndrome with menopause. J Clin Endocrinol Metab. 2003; 88(6):2404–2411.

32). Park JA, Kim KJ, Kim JH, Park YS, Koo J, Yoon JS. A comparison of the resting energy expenditure of Korean adults using indirect calorimetry. Korean J Community Nutr. 2003; 8(6):993–1000.
33). Suk MH, Shin YA, Lim KI. The effects of age and obesity on energy expenditure and fat oxidation according to exercise intensity in women. J Korean Phys Edu Assoc Girls Women. 2010; 24(3):213–223.
34). Lee KY, Jang MR, Kim EK, Huh KB. A study on body fat distribution in obese human-Specially related to risk factors in degenerated diseases. Korean J Nutr. 1991; 24(3):157–165.
35). Moon SJ, Kim HS, Kim JH, Park GS, You YH. The effect of weight control on obese women. Korean J Nutr. 1995; 28(8):759–770.
36). Caro JF, Sinha MK, Kolaczynski JW, Zhang PL, Considine RV. Leptin: the tale of an obesity gene. Diabetes. 1996; 45(11):1455–1462.

37). Nagatani S, Guthikonda P, Thompson RC, Tsukamura H, Maeda KI, Foster DL. Evidence for GnRH regulation by leptin: leptin administration prevents reduced pulsatile LH secretion during fasting. Neuroendocrinology. 1998; 67(6):370–376.

38). Duggal PS, Van Der Hoek KH, Milner CR, Ryan NK, Armstrong DT, Magoffin DA, Norman RJ. The in vivo and in vitro effects of exogenous leptin on ovulation in the rat. Endocrinology. 2000; 141(6):1971–1976.

39). Agarwal SK, Vogel K, Weitsman SR, Magoffin DA. Leptin an-tagonizes the insulinlike growth factor-I augmentation of steroidogenesis in granulosa and theca cells of the human ovary. J Clin Endocrinol Metab. 1999; 84(3):1072–1076.

40). Lee SY, Choi SH, Kim YJ. Impact of weight change on hepatic markers in overweight, middle-aged patients. J Korean Soc Study Obes. 2002; 11(4):362–368.
41). Motoshima H, Wu X, Sinha MK, Hardy VE, Rosato EL, Barbot DJ, Rosato FE, Goldstein BJ. Differential regulation of adiponectin secretion from cultured human omental and subcutaneous adipocytes: effects of insulin and rosiglitazone. J Clin Endocrinol Metab. 2002; 87(12):5662–5667.

42). Kamari Y, Grossman E, Oron-Herman M, Peleg E, Shabtay Z, Shamiss A, Sharabi Y. Metabolic stress with a high carbohydrate diet increases adiponectin levels. Horm Metab Res. 2007; 39(5):384–388.

43). Arvidsson E, Viguerie N, Andersson I, Verdich C, Langin D, Arner P. Effects of different hypocaloric diets on protein secretion from adipose tissue of obese women. Diabetes. 2004; 53(8):1966–1971.

44). Kasim-Karakas SE, Tsodikov A, Singh U, Jialal I. Responses of inflammatory markers to a low-fat, high-carbohydrate diet: effects of energy intake. Am J Clin Nutr. 2006; 83(4):774–779.

45). Lee MY, Kim JH. Association of serum lipids and dietary intakes with serum adiponectin level in overweight and obese Korean women. Korean J Community Nutr. 2010; 15(1):27–35.
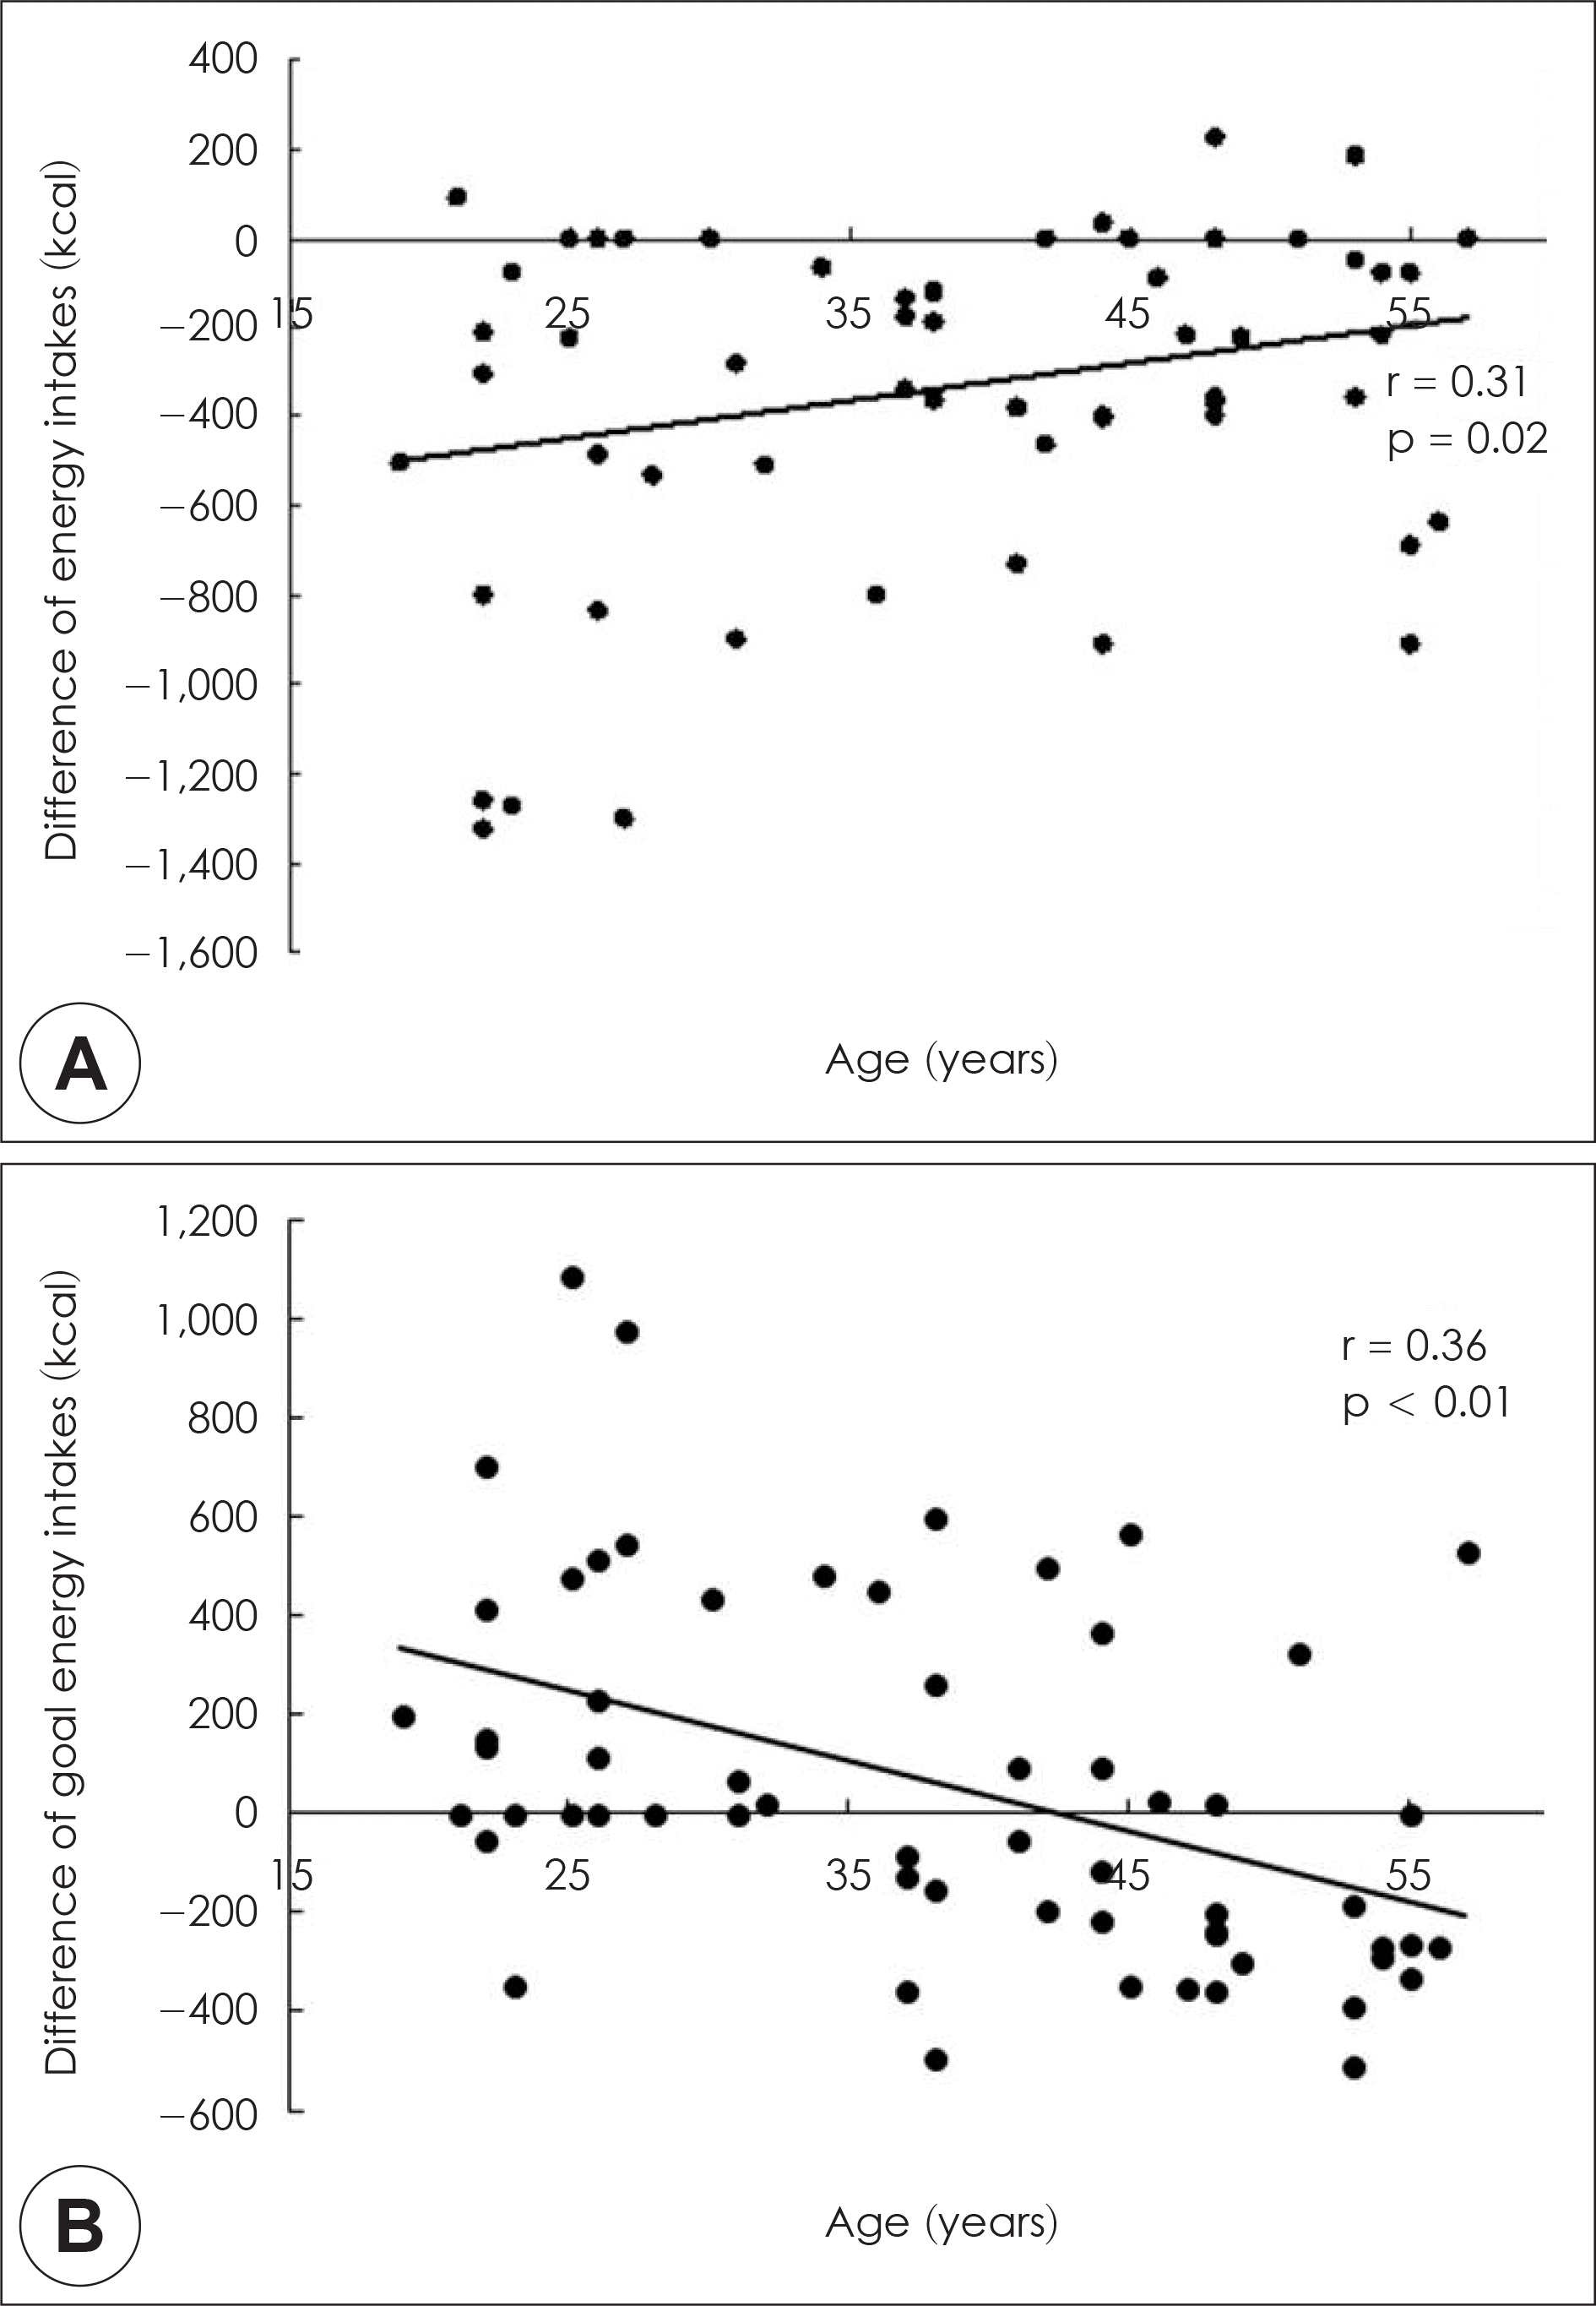
Fig. 1.
The association of age with difference of energy intakes (A) and difference of goal energy intakes (B) after caloric restriction.

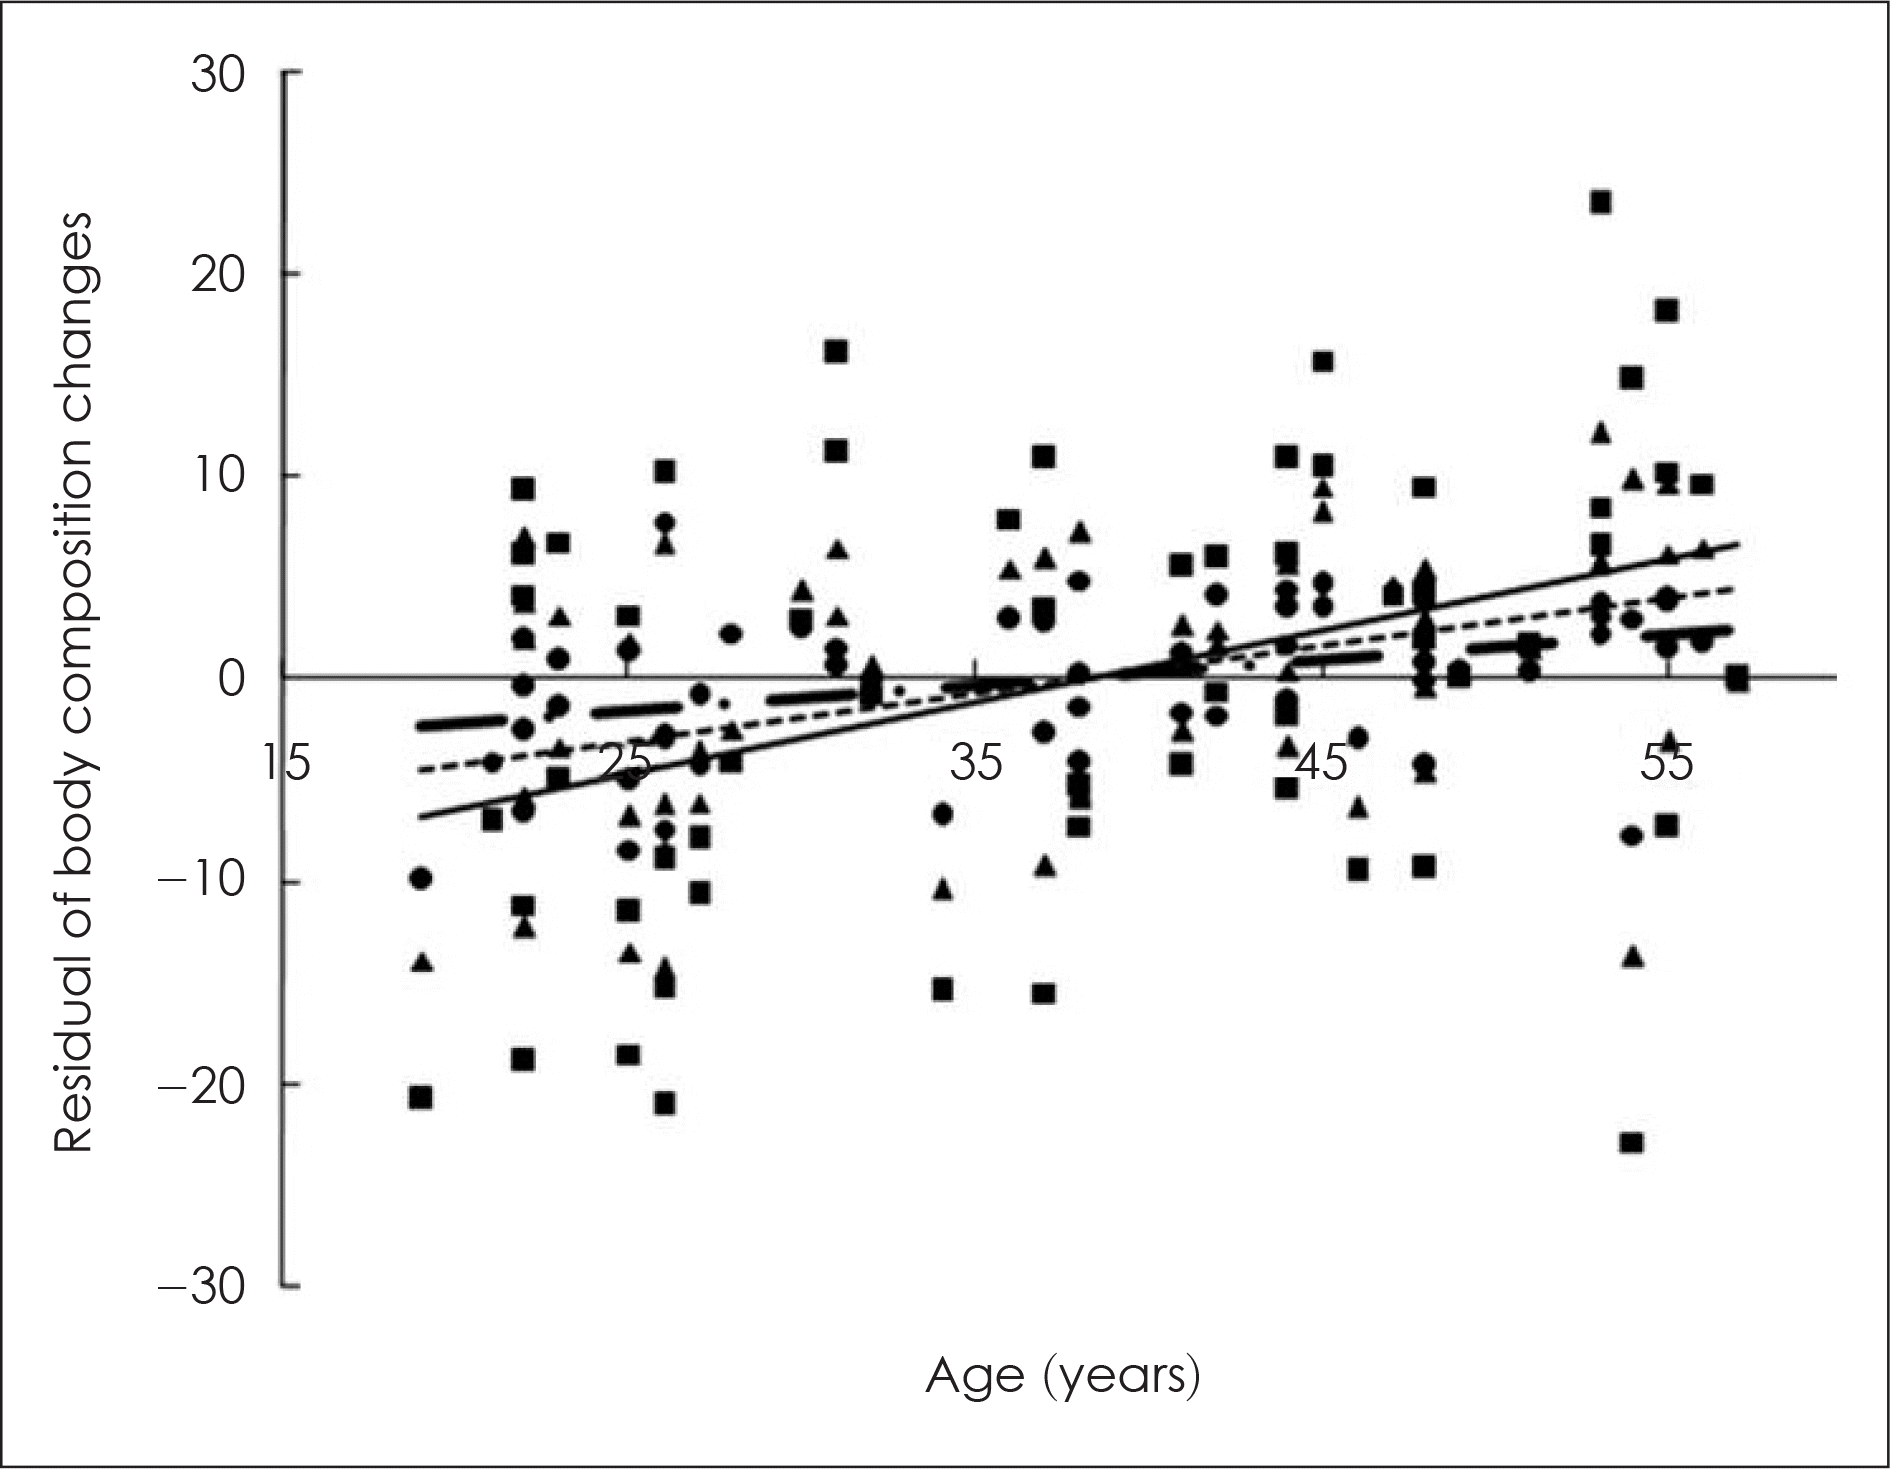
Fig. 2.
Residual of body composition percent changes after adjustment for baseline weight and difference of energy intakes according to the regression equation. Percent change of weight (●) = −10.80–0.02* (baseline weight) + 0.02* (difference of energy intakes), Change percent of subcutaneous fat (▲) = −19.93–0.04* (baseline weight) + 0.06* (difference of energy intakes), Change percent of visceral fat (■) = −24.08–0.01* (baseline weight) + 0.11* (difference of energy intakes) as a function of age (years). Solid, dashed and solid-dashed lines represent percent changes of visceral fat, subcutaneous fat, and weight, respectively.

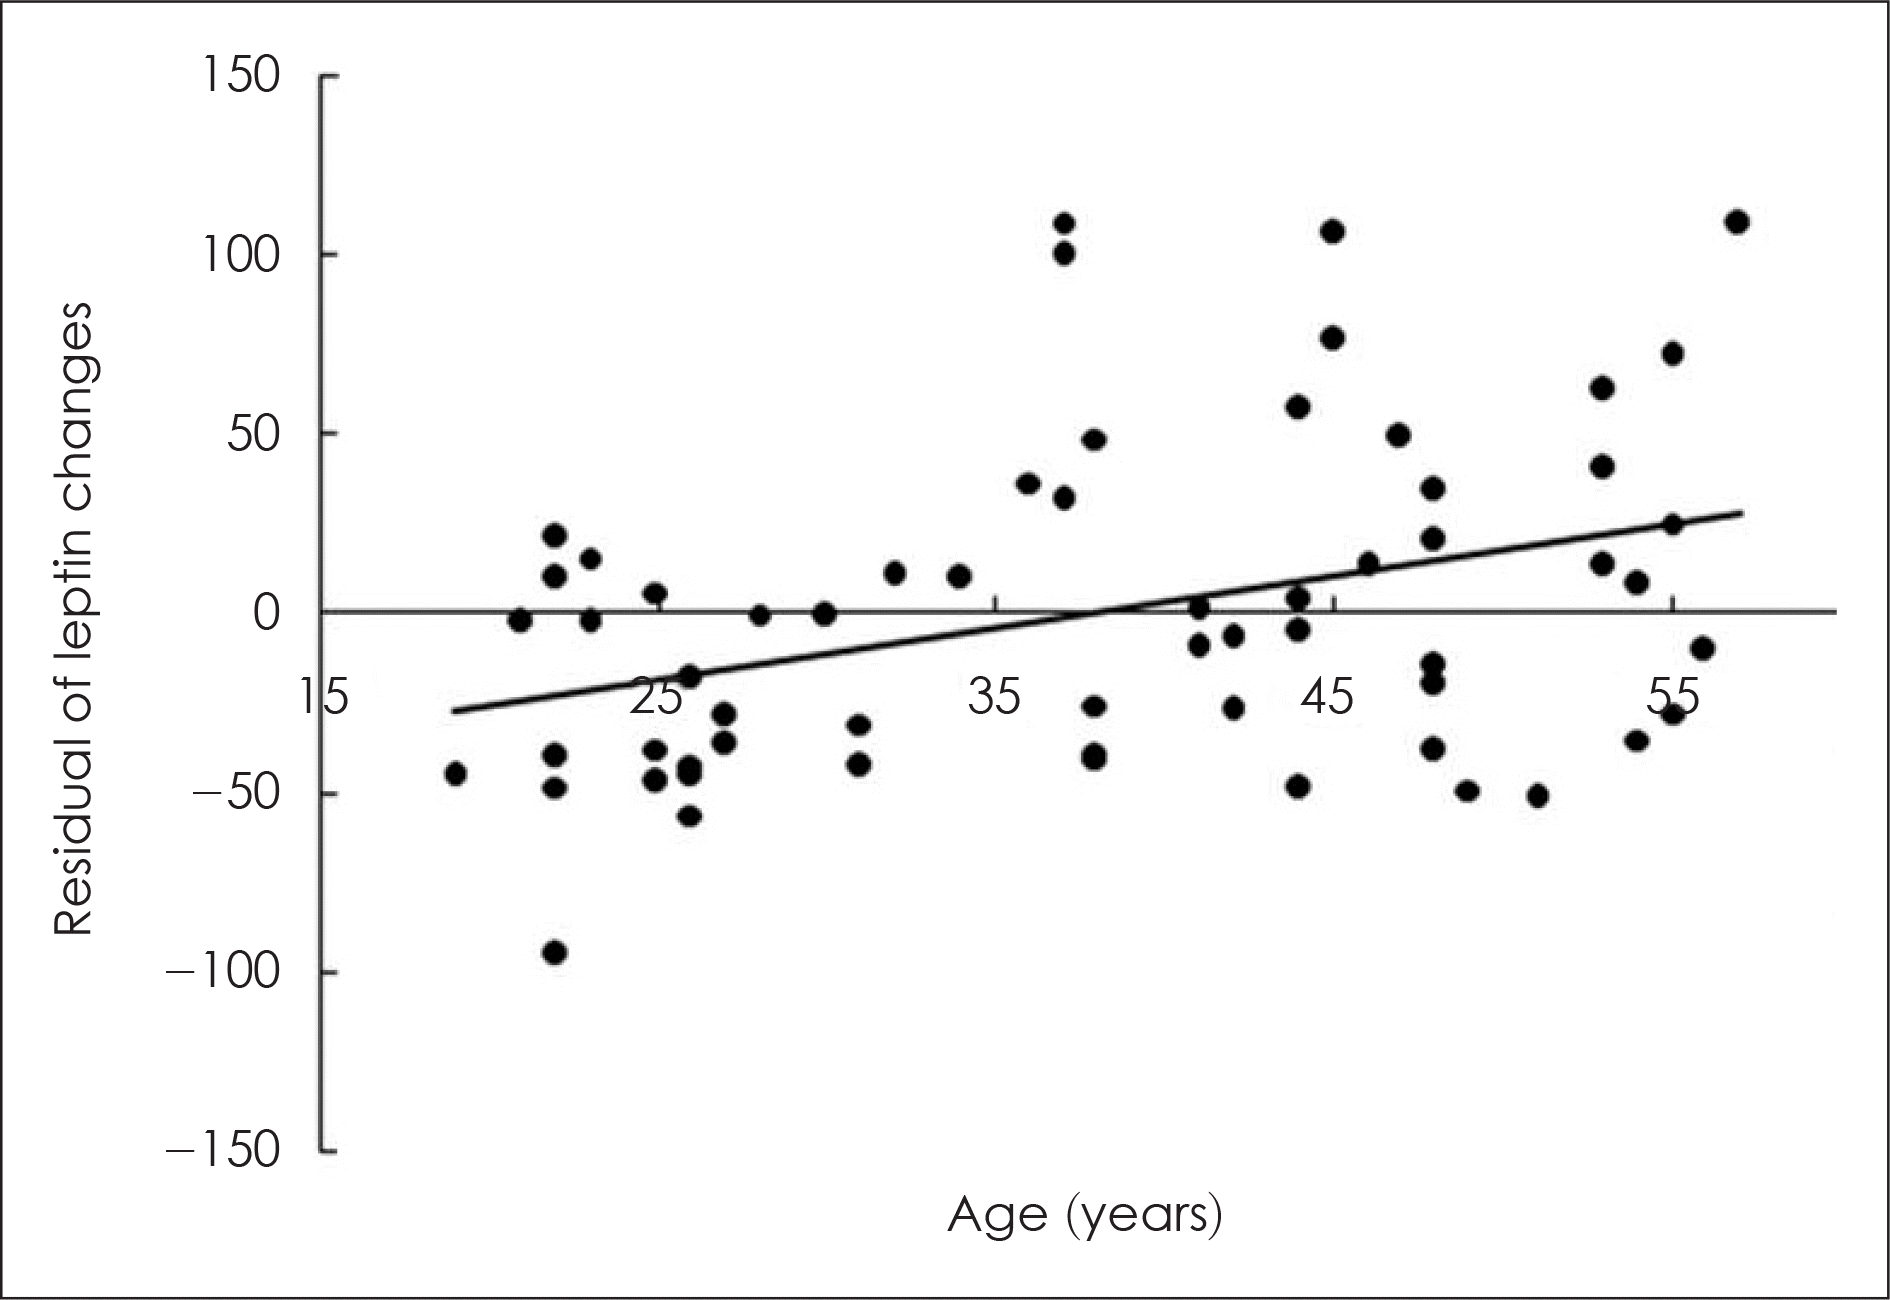
Fig. 3.
Residual of leptin percent changes after adjustment for baseline weight and difference of energy intakes according to the regression equation. Leptin = −138.45 + 1.00* (baseline weight) + 0.05* (difference of energy intakes) as a function of age (years).

Table 1.
Descriptive data and anthropometric data before and after caloric restriction
| Baseline | After caloric restriction | Change percent | |
|---|---|---|---|
| Age (years) | 38.1 ± 11.5 | 38.1 ± 11.5 | – |
| Height (cm) | 158.5 ± 5.5 | 158.5 ± 5.5 | – |
| Weight (kg) | 68.2 ± 10.4 | 65.1 ± 10.0** | –4.5 ± 3.8 |
| BMI (kg/m2) | 27.2 ± 3.2 | 25.7 ± 3.1** | –4.5 ± 3.8 |
| Waist (cm) | 82.2 ± 10.3 | 79.4 ± 10.6** | –3.4 ± 4.9 |
| LBM (kg) | 44.4 ± 5.6 | 43.2 ± 5.9* | –2.9 ± 3.7 |
| Fat percent (%) | 33.3 ± 5.5 | 32.2 ± 3.7** | –1.9 ± 13.6 |
| Fat mass (kg) | 24.4 ± 8.0 | 21.5 ± 5.6** | –9.0 ± 16.5 |
| Vfat (kg) | 2.9 ± 1.1 | 2.5 ± 1.0** | –12.0 ± 11.1 |
| Sfat (kg) | 20.3 ± 5.1 | 18.6 ± 5.1** | –8.2 ± 6.9 |
| SBP (mmHg) | 122.1 ± 13.2 | 114.4 ± 13.4** | –6.2 ± 6.8 |
| DBP (mmHg) | 73.2 ± 8.4 | 68.8 ± 8.6** | –5.6 ± 10.2 |
Table 2.
Daily nutrients intakes before and after caloric restriction
| Baseline | After caloric restriction | Change percent | |
|---|---|---|---|
| Calorie (kcal) | 1812.4 ± 396.2 | 1360.5 ± 288.5** | –22.3 ± 19.3 |
| CHO (g) | 259.3 ± 55.6 | 200.3 ± 54.0** | –20.1 ± 23.3 |
| Protein (g) | 75.7 ± 22.2 | 56.8 ± 12.8** | –20.0 ± 30.7 |
| Fat (g) | 53.4 ± 20.1 | 36.2 ± 10.7** | –24.5 ± 19.9 |
| CHO: Pro: Fat | 57.0: 16.6: 26.4 | 59.2: 16.8: 24.1 | – |
| Fiber (g) | 20.4 ± 5.9 | 18.2 ± 4.5* | –5.5 ± 29.4 |
| Cholesterol (mg) | 311.6 ± 123.4 | 243.9 ± 106.8* | 0.1 ± 102.7 |
| Ca (mg) | 594.3 ± 270.9 | 530.5 ± 197.3 | 1.9 ± 52.5 |
| Fe (mg) | 14.9 ± 6.7 | 11.3 ± 2.9** | –16.4 ± 26.6 |
| Zn (mg) | 8.9 ± 2.2 | 6.6 ± 1.6** | –22.6 ± 23.5 |
| Vit A (μ gRE) | 940.7 ± 379.1 | 848.6 ± 249.8 | –0.1 ± 41.9 |
| Vit B1 (mg) | 1.1 ± 0.3 | 1.0 ± 0.2* | –5.6 ± 35.3 |
| Vit B2 (mg) | 1.4 ± 1.4 | 1.1 ± 0.2 | –2.6 ± 43.8 |
| Vit B6 (mg) | 2.1 ± 0.6 | 1.7 ± 0.4** | –15.8 ± 25.0 |
| Niacin (mg) | 17.3 ± 5.7 | 14.9 ± 4.3* | –5.3 ± 40.6 |
| Vit C (mg) | 109.1 ± 54.7 | 85.4 ± 19.2* | –3.2 ± 45.7 |
| Folate (μ g) | 271.5 ± 98.7 | 227.9 ± 77.8* | –11.3 ± 28.4 |
| Vit E (mg) | 15.3 ± 4.7 | 11.2 ± 4.8** | –16.4 ± 45.4 |
Table 3.
Blood parameters before and after caloric restriction
| Baseline | After caloric restriction | Change percent | |
|---|---|---|---|
| TG (mg/dL) | 106.8 ± 60.3 | 98.0 ± 67.1 | –2.2 ± 40.7 |
| TC (mg/dL) | 198.9 ± 36.4 | 196.9 ± 33.0 | 0.4 ± 12.4 |
| HDL-C (mg/dL) | 58.0 ± 15.6 | 57.7 ± 13.0 | 2.1 ± 18.2 |
| LDL-C (mg/dL) | 125.6 ± 37.6 | 126.8 ± 32.4 | 5.7 ± 23.1 |
| GPT (Units) | 21.7 ± 15.8 | 18.3 ± 10.3* | –3.4 ± 42.1 |
| FBS (mg/dL) | 86.2 ± 8.8 | 85.9 ± 9.1 | 0.1 ± 9.9 |
| Leptin (ng/mL) | 10.3 ± 4.2 | 9.5 ± 4.6 | –0.2 ± 45.3 |
| Adiponectin (ng/mL) | 7.9 ± 4.1 | 12.5 ± 8.6** | 56.0 ± 77.6 |
Table 4.
Independent association of difference of energy intakes with changes of weight, subcutaneous fat, and visceral fat
| Variables | Weight change | Sfat change | Vfat change |
|---|---|---|---|
| Difference of energy intakes | –0.001 ± 0.0009 | –0.002 ± 0.001 | –0.0001 ± 0.0001 |
| Age | 0.13 ± 0.05** | 0.09 ± 0.04* | 0.02 ± 0.005** |
| Baseline | –0.04 ± 0.03 | –0.14 ± 0.08 | –0.199 ± 0.04** |
| Intercept | –5.92 ± 3.12 | –3.01 ± 2.72 | –0.42 ± 0.25 |
| R2 | 0.31 | 0.20 | 0.43 |
| s.e.e. | 2.49 | 2.81 | 0.34 |


 PDF
PDF ePub
ePub Citation
 Print
Print


 XML Download