

 PDF
PDF ePub
ePub Citation
 Print
Print


INTRODUCTION
Facial esthetics plays an inherent role in social behavior and perception worldwide. The increased awareness of facial esthetics has also led to an increase in the number of adults seeking orthognathic and orthodontic treatment.123
Different facial features, their roles in facial esthetics, and the overall composition of the face have been previously assessed. Evaluations of the positions of the lip and chin have been conventionally performed by using lateral view photographs or lateral cephalograms,4567 but few studies have based their evaluations on frontal view photographs.89 Several studies have demonstrated that an attractive lip proportion is a key factor for an esthetically pleasing lower face.456 Other reports have shown that the eyes, nose, and mouth were the preferred targets during the visual perception of a face.10 Yet another study suggested that the central area of average faces was perceived visually more quickly than the central area of unusual faces.11 A previous study also confirmed the importance of the eyes and mouth in emotional decoding.12
Currently, the parameters that determine whether a face is attractive are still controversial. Sharma et al.13 showed a lack of consensus and confidence regarding a reliable, validated, and reproducible scoring system for facial esthetics. Galantucci et al.14 assessed the facial features on three-dimensional (3D) images of subjects with a preferred facial appearance by using principal component analysis. However, they reported that their method was not a valid prediction tool for attractiveness. Moreover, no previous study has compared a group with a preferred facial appearance to a group from the general population.
Facial esthetics has been compared between fashion models and non-fashion models from the same ethnic group and between models from different ethnic groups.89 Kim et al.15 evaluated the facial dimensions of young adult women with a preferred facial appearance. However, these studies were based on two-dimensional (2D) measurements taken using unstandardized photographs. Row and Rhu16 assessed the facial esthetics of the finalists of the Miss Korea contest in the late 1980s by using lateral cephalograms. They found that the Korean beauty standards favored a less prominent nose, more prominent lip, and deeper sulcus depth than did the Caucasian beauty standards. Nevertheless, the study was based on lateral cephalometric variables and overlooked the importance of the measurements on facial photographs.
Three-dimensional photogrammetry has recently been introduced to the medical and dental fields, and its accuracy, precision, reproducibility, and reliability have been reported.171819 Kim et al.20 reported no significant differences in the position of any landmark between 2 repeated digitizations. Several studies have developed 3D facial analyses based on 3D photogrammetric data.2021 Nevertheless, volumetric or curve variables were not incorporated into these 3D facial analyses. Ancient Greeks believed that a specific proportion between the elements of a body contributes to its beauty. The Greek mathematician Euclid described the “golden ratio” or the “divine proportion” that was later found to be equivalent to 1:1.618 and was denoted by the symbol “Phi” (Φ). Intriguingly, the golden ratio is seen in nature, for example in the spirals of seashells. Moreover, for a long time, this ratio was considered the ideal ratio for beauty. Several studies have demonstrated that the proportions between facial measurements of attractive faces were close to the golden ratio.2223 However, other authors have reported minimal, if any, significant association between the golden ratio and facial attractiveness.242526 This controversy encourages further studies on the relationship between the golden ratio and contemporary facial proportions in different ethnicities.
To our knowledge, no study to date has been conducted to evaluate the modern facial esthetic standards of the Korean population by using 3D analysis, including the assessment of curve lengths and volumetric variables. Moreover, no study has evaluated the association between the proportions of these variables and the golden ratio, or other neoclassical canons or indices even though they have been suggested for a different ethnic group at a different time.
Therefore, the aims of this study were to measure and compare the facial dimensions of a group comprising the Miss Korea pageant contestants and a selected group of women from the general population by using 3D image analysis, as well as to compare various facial ratios to the golden ratio within each group.
MATERIALS AND METHODS
The Miss Korea (MK) group comprised 52 young female adult who had participated in the final round of the Miss Korea contest in 2012 (age, 21.8 ± 2.0 years). The selected group of women from the general population (GP) comprised 41 young adult female students of a nursing school at Wonkwang Health Science University, Korea (age, 20.2 ± 1.3 years).
The inclusion criteria for the GP group were a straight profile with a mesocephalic face type and balanced facial appearance (judged by the consensus of 2 orthodontists), no previous plastic or maxillofacial surgery or orthodontic treatment, and absence of mentalis hyperactivity with an interlabial gap less than 1 mm. The participants in both groups signed an informed consent form to participate in this study, which was approved by the institutional review board of The Catholic University of Korea (KC140ISE0057).
A 3D scanner (Morpheus3D Co., Ltd., Seongnam, Korea) was used to acquire the 3D photographs of the participants in both groups. The camera resolution was 0.8 megapixels, and the data accuracy was less than 0.1 mm (declared by the manufacturer). The images were acquired in the natural head position at a distance of about 650 mm from the scanner, with no make-up and under normal room lighting. Each participant's face was scanned 3 times frontally and at 45° on the right and left sides for 0.8 seconds each time. Then, Morpheus3D Dental Solution 3.0.8 (Morpheus3D Co., Ltd.) was used to convert the images acquired using the 3D scanner into models by registering the 3 scans, i.e., converting their data into a single coordinate system by using iterative closest point algorithms to determine a pair of points closest to the predefined, overlapped area between the 2 data sets and calculate the 3D conversion parameter that minimizes the distance between the points.27 The same software was used for analyzing the 3D models.
Reorientation was performed as follows: a horizontal plane was constructed to contain the right and left pupils and the soft-tissue nasion (N); then the sagittal plane was set to be the perpendicular plane that contains the N-subnasale (Sn) line. Finally, the coronal plane was set as the one perpendicular to both the previously described planes (Figure 1).
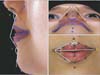
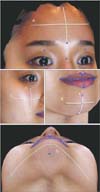
Tables 1 and 2, and Figures 2, 3, 4, 5 illustrate the linear, angular, curve length, areal, and volumetric variables. The following neoclassical canons were calculated28:
Canon 1: Trichion (Tr)-N = N-Sn = Sn-gnathion (Gn). However, for easier comparisons, the canon was rewritten as follows: Tr-N/N-Sn = 1, Tr-N/Sn-Gn = 1, and N-Sn/Sn-Gn = 1.
Canon 2: nasal width/facial width = 1/4
Canon 3: nasal height/ear height = 1
Canon 4: endocanthal width/nasal width = 1
Canon 5: endocanthal width/eye width = 1
Canon 6: mouth width/nasal width = 3/2
Moreover, several proportion indexes (PIs) were calculated (Table 3).29 In addition, the ratios between the variables forming each PI were calculated.
The landmarks were digitized on each 3D image by a single operator. Ten models from each group were redigitized 2 weeks later by the same operator. Intraclass correlation coefficient (ICC) was applied to evaluate the intraobserver reliability. The reliability of the digitization process showed an ICC > 0.8.
Statistical analysis
Statistical evaluation was performed using IBM SPSS Statistics, version 20.0 (IBM Corp., Armonk, NY, USA). Normal distribution was confirmed using the Shapiro-Wilk test. The right and left variables were compared using a paired t-test, and then averaged for further analysis because no significant differences were observed. Multivariate analysis of variance (MANOVA) was performed to compare the intergroup differences. The classical canons and PIs were compared between the two groups by using independent-sample t-test. Within each group, the classical canons were compared to their known values by using one-sample t-test, and the ratios were compared to the golden ratio (1.618) by using one-sample t-test as well. The p-values were adjusted for multiple comparisons by using the Holm-Bonferroni correction. Significance level was set at 0.05.
RESULTS
Linear and angular measurements (Table 4)
Compared to the GP group, the MK group had lesser facial, lower-facial, and nasal widths and greater eye widths. The MK group also had greater forehead, eye, nasal, and total facial heights, but lesser lower-facial and lower-lip-and-chin heights, than did the GP group. The nose was also more protruded in the MK group than in the GP group. Moreover, the MK group had greater nasolabial angle and smaller nasal tip angle than did the GP group.
A proportional diagram of the average face of the MK group and another of the GP group were sketched to visually present the differences between the average faces of both groups (Figure 6).
Curves, surface areas, and volumetric measurements (Table 4)
Compared to the GP group, the MK group demonstrated a greater vertical curvature of the forehead, but smaller horizontal curvature of the cheek and vertical curvature of the chin. The MK group also showed lesser lower-lip-and-chin volume and chin volume than did the GP group. In addition, no significant intergroup differences were observed in the areal or perimeter variables.
Canons, PIs, and ratios (Table 5)
Canon 1 in both groups was significantly different from the traditional value. Moreover, it was significantly different between the two groups except for the Tr-N/N-Sn. For Canons 3 and 5, significant differences were observed between the two groups, and within each group, they were significantly different from the traditional values. Canon 6 showed no significant difference between the groups, but within each group, it was significantly different from the traditional value. For Canons 2 and 4, no significant difference was observed between the groups or from the traditional value of the canon except in the GP group, which showed a significantly greater value than the traditional one for Canon 2.
Regarding Farka proportion index (PI), the MK group showed greater nasal protrusion/width and nasal/facial height than did the GP group. However, the MK group exhibited lesser lower-lip-and-chin/facial height, lower-facial/facial width and height, endocanthal/exocanthal width, nasal width/height, and upper lip/nasal height than did the GP group. All ratios in each of the groups were significantly different from the golden ratio.
DISCUSSION
Assessment of facial appearance is a multifaceted process in modern globalized societies. Several interacting factors have been suggested to assess facial attractiveness; however, no consensus has currently been reached.303132 A few 3D parameters have been reported for the evaluation of facial attractiveness,33 including the volume of facial structures,34 but no study to our knowledge has yet evaluated the implications of curve length on attractiveness by using 3D facial imaging.
Therefore, in our study, several curve lengths and volumetric variables were evaluated. The MK group showed greater vertical curvature of the forehead than did the GP group, and this was consistent with the forehead height measurement. This finding was also in agreement with the finding of a previous study, which reported that, among Asian women, the most attractive group had greater forehead height than did the least attractive group.35 Moreover, the MK group in our study had smaller horizontal cheek and vertical chin curvatures, as well as lesser lower-lip-and-chin and chin volumes, than did the GP group.
The MK group had longer faces but smaller lower-facial portions than did the GP group. The MK group also had narrower facial and lower-facial widths. This was contradictory to the results of Sforza et al.,33 who reported that attractive adolescents have wider and shorter faces. This might be attributed to the cultural and social differences when evaluating attractive face samples. The difference in the age of the subjects in the studies (adolescents in Sforza et al.33 vs. adults in our study) may also have caused the difference in esthetic facial preferences. Nevertheless, the results of other studies on the facial attractiveness of Caucasian groups have shown some similarities to our results, suggesting that attractiveness was associated with a larger eye and forehead and smaller chin.3637
In agreement with the findings of a study by Kim et al.,15 the total facial height of the MK group was greater than that of the GP group. However, the GP group in our study had a greater facial width than did the MK group, which was opposite to the results of Kim et al.15 In addition, the facial height as well as the intercanthal and interpupillary widths, which showed significant intergroup differences in the study of Kim et al.,15 showed no significant intergroup differences in our study. This might be attributed to the differences between the 2D and 3D nature of the studies and the associated difficulty in the identification of projected landmarks on 2D images.
Farkas28 proposed that the PIs might give a more accurate description of attractiveness than do measurements of facial features. Galantucci et al.,14 who evaluated the faces of the Miss Italy 2010 contestants, confirmed that attractiveness could be related to proportion, which could be a key factor in the perception of beauty. Therefore, in our study, 23 Farkas PIs were evaluated, and 8 of the 23 demonstrated significant differences on intergroup comparisons.
Our study showed that the MK group had longer and narrower faces with lesser lower-facial/facial widths and lower-lip-and-chin/facial heights than did the GP group. This suggests an inverted pear-shaped average face for the MK group and a more rounded average face for the GP group. However, these PIs were not significantly different between the attractive and non-attractive groups in a study on North American Caucasians, despite their agreement with our findings that the attractive group had a lesser facial width.28
Attractive Caucasian women had eyes of larger width and height, and a larger PI between the height and width, than did a group of women with below-average attractiveness.28 In our study, the MK group had larger eye width and height than did the GP group; however, no significant difference was observed in the PI between eye height and width. This may suggest that the geometrical shape of the eye has an effect on attractiveness in the Caucasian population, whereas the eye size alone affects attractiveness in the Korean population.
A previous study on the 3D images of the Miss Italy 2010 contestants showed that their facial width was 83.5 mm at the inter-exocanthus and 73.7 mm at the inter-gonion.38 However, in the MK group of our study, the corresponding facial widths were 95.7 mm and 119.1 mm, respectively. In addition, the total facial height in their study was 168.2 mm, while in our MK group, it was 186.0 mm. The nasal width in their study was 30.2 mm, whereas in our MK group, it was 36.3 mm. Nevertheless, their Miss Italy group had a similar mouth width to our MK group (45.5 mm). These differences could be partly attributed to the racial differences between the study groups.
Ferrario et al.,39 who compared the facial dimensions between Caucasian beauties and normal groups, found that the former group had greater forehead height than did the normal group, which was in agreement with our results. However, unlike our groups, their groups had lesser nasal height and greater lower-facial width. In addition, their groups had lesser facial height, greater inter-exocanthal width, and lesser nasal volume, but these variables were not significantly different between the groups in our study. Moreover, the authors demonstrated no significant differences between their groups in lower-facial height and lower-lip-and-chin volume, which were significantly lesser in our MK group. Their normal group showed more convex and narrower faces with greater upper and total facial heights, and hence, they had lesser facial-width-to-height ratios and lesser volume of the facial upper third than did the beauties group. However, in our study, the GP group showed wider faces and lesser total facial height than did the MK group, but without significant intergroup differences regarding the volume of the upper facial portion or the ratio between the facial width and height.
The MK group had a longer, narrower, and more protruded nose with lesser nasal width/height and upper lip/nasal heights than did the GP group. This was not consistent with the findings in the Caucasian population, which showed no significant differences in these variables between the attractive and unattractive groups.28
Moreover, compared to the unattractive group, the attractive Caucasian group had greater mouth/facial widths and lesser philtrum/mouth widths.28 In contrast, our study showed that the mouth/facial widths and philtrum/mouth widths were not significantly different between groups.
Several authors have studied the mathematical relationships, especially the golden ratio, between different parts of the human body and face.40 However, no consensus has been reached regarding relationship between this ratio and modern facial esthetics. A recent study proposed the utilization of this ratio in facial esthetics.23 However, Rossetti et al.,25 who evaluated 10 facial ratios obtained via 3D stereophotogrammetry from 60 attractive subjects, reported that 7 of these ratios were significantly different from the golden ratio.
Similarly, our results demonstrated that all ratios were significantly different from the golden ratio. In addition, when several classical canons were tested within each group independently, only the inter-endocanthus to nasal widths (in each group) and nasal to facial widths (in the MK group) showed no significant differences from the proposed values. This might be expected because these canons were proposed in a different era and for a different ethnic group. It also suggests the evolving nature of esthetic standards. Therefore, revisiting the application of such canons on contemporary facial esthetics might be important.
Asymmetries are commonly found between the right and left sides of the face.41 Faure et al.42 reported that symmetry has a negative effect on facial esthetics, while other studies have emphasized the importance of symmetry in the perception of faces.1143 Sforza et al.44 reported that the effect of symmetry on attractiveness changes as a function of age; the attractive children in their study were more symmetric than the control children, unlike young adults. Our results showed no significant asymmetry in either group. Therefore, drawing strong conclusions related to the effect of facial asymmetry on the esthetic standards is difficult. In our study, the limited number of paired variables might have impaired our ability to evaluate facial symmetry. Therefore, an additional evaluation of the general and local facial asymmetry in these groups might be recommended.
Previous studies have applied the palpation and marking method for identifying some facial landmarks.3439 However, in our study, the landmarks were placed directly on the 3D images without palpation. Considering the palpation method might be more accurate, a validation of our method compared to a gold standard might be warranted.
In addition, this analysis focused on the frontal and horizontal aspects, and the sagittal relationship was not included in order to decrease the complexity of this study. Therefore, further studies are necessary to investigate the anteroposterior relationships between the facial structures of the esthetically pleasing group and to compare them to the general population.
The MK group in our study also refused radiographic examination and would not answer whether they had undergone prior surgeries. This information was not relevant because the MK group represents the standards that the current society considers beautiful. A future study evaluating the skeletal dimensions and their relationship to the soft-tissue measurements of a sample of individuals with a preferred facial appearance by using cone beam computed tomography might be recommended. Despite these limitations, our results provide important information that may help in treatment planning and setting treatment goals for patients undergoing orthodontic treatment or orthognathic surgery for malocclusion or dentofacial deformity.
CONCLUSION
The MK group had longer faces, but lesser lower lip-and-chin height and lesser cheek and chin volumes, than did the general Korean population with mesocephalic faces.
The ratios between the facial dimensions in this study were not matching the golden ratio in either group. Therefore, the golden ratio and the neoclassical canons might not be of significant value for treatment planning in the Korean population according to the current esthetic preferences.
This 3D facial photogrammetric analysis provided useful information on facial dimensions that might be beneficial for treatment planning of orthognathic and plastic surgery as well as orthodontic treatment. The measurements obtained in the MK group might be used as indicators of the current esthetic standards for Korean patients. Moreover, the measurements of the general population with mesocephalic faces could also be applied in treatment planning if achieving the values of the MK group is difficult.


 XML Download