

 PDF
PDF ePub
ePub Citation
 Print
Print


INTRODUCTION
Conventional orthognathic surgery (CS) for patients with skeletal Class III malocclusion and facial asymmetry comprises three steps: presurgical orthodontic treatment, orthognathic surgery, and postsurgical orthodontic treatment.123 During presurgical orthodontic treatment, the patient's facial esthetics and functional occlusion deteriorate because of dental decompensation. Nagasaka et al.4 and Villegas et al.5 have recently proposed orthognathic surgery without presurgical orthodontic treatment, known as the surgery-first approach or preorthodontic orthognathic surgery (POGS).67 POGS has some advantages, including rapid improvement in facial esthetics and patient satisfaction because of the shorter presurgical orthodontic period.89 Moreover, previous studies1011 have reported a regional acceleratory phenomenon in which orthodontic tooth movement can be accelerated in the period immediately after surgery.
Many studies have compared skeletal and dental stability after surgery between the approaches with and without presurgical orthodontics.6121314 However, most studies have focused on anteroposterior skeletal and dental movements in the sagittal dimension using lateral cephalograms. Few studies have investigated transverse skeletal and dental stability after surgery without preorthodontic treatment. Wang et al.15 evaluated changes in the transverse dimension in patients with skeletal Class III malocclusion with and without presurgical orthodontic treatment using the posteroanterior (PA) cephalometric view and concluded that transverse dental changes were similar whether patients did or did not receive presurgical orthodontic treatment. Kim et al.16 evaluated the dental casts of patients with skeletal Class III malocclusion who underwent surgery with minimal orthodontic treatment and concluded that changes in the arch width had no association with horizontal and vertical relapses of the mandible. However, the buccolingual inclination of the molars cannot be precisely measured with dental casts. Assessment of the transverse dental axis with the PA view has several limitations because of rotation of the head and overlapping anatomic structures.1718 To our knowledge, few studies have evaluated POGS and CS for postoperative changes in the transverse dental axis in patients with asymmetry using three-dimensional computed tomography (3D-CT). In patients with facial asymmetry in particular, it is difficult to decompensate buccolingually tilted molars because the soft tissue is adapted to the skeletal discrepancy.19 If the skeletal discrepancy is first corrected, the newly formed soft tissue environment may help teeth to move more rapidly and easily. Therefore, there is a need to evaluate the postoperative changes in the transverse dental axis to verify the efficacy and improve the predictability of POGS when compared with CS.
The aim of this study was to use 3D-CT to evaluate transverse skeletal and dental changes, including those in the buccolingual dental axis, between patients with skeletal Class III malocclusion and facial asymmetry who had undergone two-jaw surgery with and without presurgical orthodontics. The hypothesis was that there would be no significant difference in the transverse dental axis in either arch between surgery with and without presurgical orthodontic treatment at 1 year postoperatively in patients with mandibular prognathism and facial asymmetry.
MATERIALS AND METHODS
Study design and subjects
This retrospective study included patients who were diagnosed with skeletal Class III malocclusion and facial asymmetry and had undergone two-jaw surgery from 2010 through 2015 at the Department of Oral and Maxillofacial Surgery at Yonsei Dental Hospital, Seoul, Korea. The inclusion criteria were that the patient had to (1) have skeletal Class III malocclusion with mandibular prognathism (angle of the lines connecting point A, the nasion, and point B [ANB] < 0°), (2) be an adult (i.e., aged > 18 years), (3) have menton deviation > 4 mm (i.e., the shortest distance from the midsagittal plane),6 and (4) have undergone two-jaw surgery with maxillary one-piece Le Fort I and mandibular bilateral intraoral vertical ramus osteotomy. Patients with a history of orthognathic surgery, facial trauma, cleft or syndromic deformity, or incomplete data were excluded. In addition, patients with a maxillomandibular transverse discrepancy 5 mm greater than the normal value were excluded from POGS.20
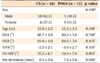
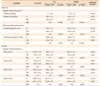
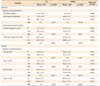
Twenty-nine patients fulfilled the inclusion criteria (CS group, n = 16, mean age 21.8 ± 2.2 years; POGS group, n = 13, mean age 21.2 ± 4.3 years; Table 1). For presurgical orthodontic treatment in the CS group, six patients underwent extraction of the two upper bicuspids, and the maxilla was expanded using a nonsurgical rapid palatal expansion appliance in four patients. The mean duration of presurgical orthodontic treatment was 12.6 ± 3.5 months. There were no cases of extraction in the POGS group. The mean total treatment time was 22.9 ± 6.3 months in the CS group and 14.3 ± 7.3 months in the POGS group. The sample size was calculated (G*Power 3, Düsseldorf, Germany) using a significance level of p < 0.05, a power of 80%, and an effect size of 1.0 to detect differences in skeletal and dental changes at each time point in each group using the paired t-test. The study followed the guidelines of the Declaration of Helsinki and was approved by the institutional review board of Yonsei Dental Hospital (Seoul, Korea; approval number 2-201500018).
Surgical and orthodontic treatments
In the POGS group, a stainless steel surgical arch wire measuring 0.016 × 0.022 inch or 0.017 × 0.025 inch was passively bonded directly onto the teeth after placement of bands on the first molars 1 month before surgery. The surgeries were performed by one surgeon and all orthodontic treatments were performed by one orthodontist.
After performing one-piece Le Fort I osteotomy, the maxilla was stabilized by rigid internal fixation with four L-shaped titanium plates. In the mandible, the osteotomy was performed without using any fixation system. The osteotomy line was vertically extended from the mandibular angle to the sigmoid notch. Ten days after surgery, the intermaxillary fixation was removed and physical therapy was provided for 6 weeks. Six to 8 weeks after surgery, the surgical arch wire was removed and postsurgical orthodontic treatment was initiated by bracket bonding and wire insertion.
Data acquisition
Computed tomography (CT) scans were obtained with a high-speed Advantage CT scanner (GE Healthcare, Milwaukee, WI, USA), which was used with a high-resolution bone algorithm (200 mA, 120 kV) at 1 second and with a 0.6 mm slice thickness and reconstruction matrix of 512 × 512 pixels. The axial images were saved as DICOM (digital imaging and communication in medicine) files and reconstructed using Invivo version 5.4 software (Anatomage, San Jose, CA, USA). For each patient, the CT data were acquired at the initial examination (T0), 1 month before surgery (T1), within the 7 days following surgery (T2), and 1 year after surgery (T3). Only 10 patients in the CS group had undergone CT at the initial examination; therefore, the data at T0 included CT images for only these 10 patients. The data at T0 and at T1 were the same in the POGS group because no orthodontic treatment was performed before the surgery.
Landmarks and measurements
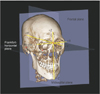
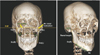
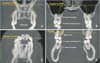
The CT images were reoriented using the Frankfort horizontal plane (FHP) passing through the right and left porion and the right orbitale and the midsagittal plane (i.e., the plane passing through the nasion and sella perpendicular to the FHP) and the frontal plane passing though the nasion and perpendicular to the FHP and midsagittal plane. The landmarks were digitized and coordinated with the nasion set as the zero point (i.e., 0, 0, 0). The shifted side of the menton in relation to the midsagittal plane was the deviated side and the opposite side was the nondeviated side (Figure 1). Skeletal variables such as maxillary canting, ramal inclination, ramal length, mandibular body length, and menton deviation (i.e., the distance from menton to the midsagittal plane), as well as dental variables such as the buccolingual inclination of the upper and lower canines and the first molars were measured at each time point (Figures 2 and 3).
Reliability
All variables for 20 randomly selected patients were measured by one author and repeated after a 2-week interval. The intraexaminer reproducibility was assessed by the intraclass correlation coefficient, which showed high reliability (range, 0.994–0.999).
Statistical analysis
The Shapiro-Wilk test was used to confirm the normality of the samples. The independent t-test was performed to detect significant differences between the CS and POGS groups, and the paired t-test was used to detect changes in the measurements over time and the difference in measurements between the deviated and nondeviated sides at each time point. All statistical analyses were performed using IBM SPSS Statistics version 20.0 software (IBM Co., Armonk, NY, USA). A p-value less than 0.05 was considered to be statistically significant.
RESULTS
At the initial examination, there were no significant differences in sex or age distribution or severity of Class III malocclusion between the CS and POGS groups (Table 1). There were also no significant differences in the skeletal measurements (including angle of the lines connecting the sella, the nasion, and point A [SNA]; angle of the lines connecting the sella, the nasion, and point B [SNB]; angle of the lines connecting point A, the nasion, and point B [ANB]; angle of the plane formed by the sella and the nasion to the mandibular plane formed by the gonion and the mention [SN-MP]; and menton deviation) between men and women.
Comparison of skeletal and dental measurements in the two groups at 1 month before surgery
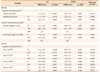
One month before surgery (i.e., T1), there were significant differences in the ramal inclination (p < 0.001) and mandibular body length (p < 0.001) between the deviated and nondeviated sides in both groups. At the time of presurgical orthodontic treatment, the upper canine on the deviated side (−2.8° ± 6.6°, p = 0.208), the first molar on the deviated side (−3.1° ± 6.7°, p = 0.179), and the lower canine on the nondeviated side (2.7° ± 4.9°, p = 0.111) inclined lingually; however, the lower canine on the deviated side (−2.1° ± 4.6°, p = 0.187) inclined labially. There was no significant difference in the change in buccolingual dental axis in either arch between T0 and T1 in the CS group (data not shown in Table 2). Even though the patients in the CS group underwent presurgical orthodontic treatment for approximately 12 months, there was no significant difference in the buccolingual inclination of the canines and molars in either arch between the CS and POGS groups at T1 (Table 2).
Surgical changes between the two groups at T1–T2
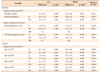
Immediately after surgery, the ramal length on the nondeviated side in both the CS group and the POGS group decreased significantly at −8.6 ± 3.6 mm and −8.5 ± 2.8 mm, respectively (p < 0.001; Table 3). The mandibular body length on the nondeviated side in the CS and POGS groups was also significantly decreased at −2.0 ± 2.6 mm and −3.1 ± 3.0 mm, respectively (p < 0.05). In both groups, the upper first molar on the deviated side (CS, −3.6° ± 2.8°; POGS, −2.9° ± 2.8°) and the lower first molar on the nondeviated side (CS, 2.6° ± 3.3°; POGS, 1.9° ± 3.1°) were significantly inclined lingually (p < 0.05), whereas the upper first molar on the nondeviated side (CS, 2.3° ± 3.7°; POGS, 2.8° ± 3.3°) and the lower first molar on the deviated side (CS, −3.2° ± 3.9°; POGS, −4.5° ± 3.9°) were significantly inclined buccally (p < 0.05). Only the change in the lower canine inclination on the nondeviated side in the CS group was significant (2.1° ± 2.4°, p < 0.01). However, there was no significant difference in the magnitude of change in the skeletal and dental variables due to surgical correction between the two groups (Table 3).
Postsurgical changes between the two groups at T2–T3
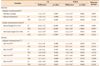
One year after surgery, the ramal length decreased by 1.8 ± 2.3 mm on the deviated side (p = 0.007) and the mandibular body length decreased by 1.3 ± 1.9 mm on the nondeviated side (p = 0.021) in the CS group (Table 4). The changes in the ramal and mandibular body lengths were greater in the CS group than in the POGS group; however, the differences were not significant between the two groups. One year after surgery, there was no significant dental change in the CS group. In the POGS group, the upper first molars on both sides inclined lingually (deviated side, –1.8° ± 2.8°, p = 0.044; nondeviated side, −3.7° ± 3.3°; p = 0.001). During postsurgical orthodontic treatment, the lower canine on the nondeviated side inclined lingually (4.0° ± 5.4°; p = 0.022, Table 4).
Comparison of total changes between the two groups at T0–T3
From T0 to T3, there was no significant difference in the total amount of change in the skeletal and dental variables, such as the buccolingual inclination of the upper and lower canines and the first molars, on either side between the CS and POGS groups (Table 5). At T3, there were no significant differences in the skeletal and dental variables between the two groups (Table 6).
DISCUSSION
This study evaluated progressive changes in the transverse dental axis with two different orthognathic surgery protocols, i.e., CS and POGS, and compared the changes between the two groups using 3D-CT. The hypothesis was that there would be no significant difference in the transverse dental axis of either arch with and without presurgical orthodontic treatment 1 year after surgery in patients with mandibular prognathism and facial asymmetry. This study demonstrated that, despite administering presurgical orthodontic treatment for approximately 12 months in the CS group, the total changes (i.e., from T0 to T3) in the buccolingual axes of the canine and first molars were not significantly different between the CS and POGS groups.
In the CS group, buccolingually inclined teeth became upright during presurgical orthodontic treatment. However, 1 month before surgery, there was no significant difference in the buccolingual inclination of the canines and first molars of either arch between the CS and POGS groups. Because of skeletal asymmetry, such as maxillary canting, ramal inclination, and ramal and mandibular body lengths, a significant difference remained in the buccolingual inclination between the deviated and nondeviated side in both groups (Table 2).
Immediately after surgery, all skeletal and dental variables improved in both groups. In particular, there were significant changes in the buccolingual inclination of the upper and lower first molars after surgical correction of the skeletal discrepancy (Table 3). The upper first molar on the deviated side and the lower first molar on the nondeviated side inclined lingually, whereas the lower first molar on the deviated side and the upper first molar on the nondeviated side inclined buccally, regardless of the type of surgery. Because of the “V” shape of the mandible, a smaller movement occurred in the anterior dentition when compared with the posterior dentition during surgery. This may have caused insignificant buccolingual changes in the canines, except for the lower canine on the nondeviated side in the CS group. In the POGS group, because the canine area came into premature contact on the nondeviated side, the amount of change in the canine axis was smaller in this group than in the CS group. However, there were no significant differences between the groups.
One year after surgery, the skeletal and dental measurements were not significantly different between the CS and POGS groups (Table 6). In addition, the total changes in the buccolingual dental axes of the mandibular molars in both groups were mostly corrected by surgical changes (Table 5) because correcting the transverse dental compensation of the mandibular molars is a difficult procedure to perform during presurgical and postsurgical orthodontic treatment.
However, in the POGS group, the buccolingual inclination of the upper and lower first molars was markedly different between the deviated and nondeviated sides. When planning POGS and fabricating a temporary surgical occlusion, it is difficult to predict the amount of transverse decompensation of the posterior teeth. As a consequence, clinicians may tend to fabricate a final wafer bite with more occlusal contacts to secure occlusal stability after surgery. This iatrogenic factor, which results from insufficient prediction of dental decompensation, may contribute to a difference in the dental axes between the deviated and nondeviated sides at 1 year after surgery.
The patients enrolled in this study underwent two-jaw surgery with Le Fort I and intraoral vertical ramus osteotomy. At 1 year after surgery, the ramal length on the deviated side and the mandibular body length on the nondeviated side were significantly decreased by approximately 1.3–1.8 mm in the CS group. This phenomenon may be associated with backward movement of the distal segments and remodeling of the mandibular angle area with rehabilitation using a pterygomandibular sling during the postoperative period. Backward movement of the distal segments can occur in patients undergoing CS or POGS. The postsurgical orthodontic treatment removed the premature posterior occlusal contacts, and therefore the distal segments moved counterclockwise; this action may have resulted in less shortening of the mandibular body and ramal length in the POGS group. This finding coincides with previous reports2122 and demonstrates that a major relapse pattern after intraoral vertical ramus osteotomy for mandibular setback is because of posterior movement of the distal segment.
Facial asymmetry can be affected by the degree of maxillary canting and any differences in the ramal and mandibular body lengths, ramal inclination, chin prominence, and chin height between the two sides.232425 Tyan et al.26 reported that the roll type of mandibular asymmetry (i.e., similar mandibular body length but different ramus length with maxillary canting) showed greater transverse compensation and vertical height difference in the maxillary molars when compared with the translation type of mandibular asymmetry (i.e., similar ramus length and mandibular body length but without maxillary canting). In the present study, we did not subdivide the asymmetry samples into more detailed types; however, ramal inclination and mandibular body length were significantly different between the deviated and nondeviated sides in the CS and POGS groups at the initial examination. Further studies involving subdivision of asymmetry are indicated.
Stable surgical occlusion with more occlusal contacts can improve the predictability of results after surgery. However, decompensating physiologically adapted and buccolingually tilted dentition against surrounding soft tissue is a time-consuming and challenging procedure, especially in patients with facial asymmetry.19 Based on the results of the present study, if the skeletal discrepancy is first corrected, teeth can be easily and rapidly moved to the target position for dental decompensation. There was also no significant difference in the postoperative transverse dental axis in either arch between the CS and POGS groups. With cautious case selection and precise treatment planning, POGS can be beneficial for reducing the total treatment time and improving satisfaction in patients with skeletal Class III malocclusion and facial asymmetry.
This study had a few limitations. Some patients in the POGS group had still not finished their orthodontic treatment at 1 year after surgery. Second, the sample size was too small for our results to be generalizable to a wider population. Further, this study was retrospective in nature and used medical CT data that had previously been produced for orthognathic surgery. Future prospective studies are necessary, and should include longer follow-up periods and larger sample sizes, and use data from cone-beam CT, which has the advantage of a low radiation dose.
CONCLUSION
At 1 year after surgery, the buccolingual dental axis in the POGS group was significantly changed by postsurgical orthodontic treatment; however, there was no significant difference in the transverse skeletal and dental measurements, including the buccolingual dental axis of either arch, between the CS and POGS groups. Therefore, POGS may be a clinically acceptable treatment modality for patients with skeletal Class III malocclusion and facial asymmetry.
 XML Download