

 PDF
PDF ePub
ePub Citation
 Print
Print


INTRODUCTION
Both genetic and environmental factors play important roles in determining craniofacial morphology. Muscle function is considered one of the most important epigenetic factors guiding facial bone growth.1 According to the “hard chewing hypothesis,” the distinctive shape of the Inuit skull is a result of vigorous chewing.2 Clinically, individuals with vigorous chewing habits have larger muscle attachments and mandibles than do individuals with delicate chewing habits.3
Surgical and non-surgical methods have been used to treat masseteric hypertrophy. However, surgical interventions, such as external/internal angle approaches, for masseteric reduction in patients with masseteric hypertrophy evidently entail many risks, including asymmetry, condyle fracture, and inferior alveolar nerve injury. More reversible and conservative non-surgical methods, such as muscle relaxants and occlusal splints, have been used to treat slight masseteric hypertrophy.
Botulinum toxin type A (BoNT-A) injection is an effective non-surgical treatment for masseteric hypertrophy. BoNT-A produced by Clostridium botulinum induces muscle paralysis and atrophy by blocking acetylcholine secretion in neuromuscular junctions,4 and is effective in striated muscles.5 BoNT-A injection is a noninvasive masseteric hypertrophy treatment option that is safer than the surgical treatment options. Kim et al.6 reported that inducing atrophy with a BoNT-A injection causes masseteric reduction in cases of masseteric hypertrophy. Another report suggested that BoNT-A injection reduced the masseter muscle, as indicated by ultrasonography and computed tomography (CT).7
The induction of localized masticatory muscle atrophy by BoNT-A injection is known to alter craniofacial growth and development.8 Accordingly, several studies have investigated the effect of BoNT-A injection on bony changes in adult animals.91011 Studies on adult rabbits have reported significant bony changes associated with muscle atrophy that lasted 12 weeks after the injection of BoNT-A.1011 Despite the differences in metabolic rates, anatomic structures, and the relative dose of BoNT-A between humans and animals, these animal studies suggest the possibility that the clinical use of BoNT-A in masseteric hypertrophy may also result in bony changes in humans.
To our knowledge, only one previous human study has investigated the effect of BoNT-A injection in the masseter muscle on bony changes.12 That study was a cross-sectional study performed on patients with temporomandibular joint disorder (TMD), in which cone-beam computed tomography (CBCT) was used to assess the effects of BoNT-A on condylar trabecular changes based on the subjective ratings of trabecular bone patterns provided by two oral and maxillofacial radiologists. However, because that study recruited patients with TMD who had received a variable number of BoNT-A injections, they could not adequately evaluate the effect of BoNT-A because of the lack of proper controls (pretreatment CBCT images). Therefore, the effect of BoNT-A injection in the masseter muscle on bony changes has not been fully investigated in healthy human adults.
In this study, we evaluated the effects of BoNT-A injection in the masseter muscles on muscular and bony changes in the mandibular angle area in healthy adult humans by using three-dimensional (3D) CBCT images. We compared the pretreatment and posttreatment images as well as the groups receiving either single or repeated injections of BoNT-A.
MATERIALS AND METHODS
Subjects
The study sample comprised 20 healthy volunteers who requested lower facial contouring at Yonsei Dental Hospital in Seoul, Korea. They were randomly assigned to one of two groups of 10 patients each. Patients in group I (4 men and 6 women; mean age, 28.5 years; range, 23–40 years) received a single BoNT-A injection, and those in group II (2 men and 8 women; mean age, 28.5 years; range, 22–48 years) received two sets of BoNT-A injections, with the second injection being administered 4 months after the first one. The exclusion criteria were the presence of notable facial asymmetry, severe malocclusion, pregnancy, a history of any serious medical illness or TMD, and drug allergy.
BoNT-A injection
BoNT-A in the form of a freeze-dried powder (Neuronox; Medytox Inc., Seoul, Korea) was reconstituted at a concentration of 50 IU/mL (100 IU in 2 mL of sterile saline), and used immediately after preparation. This BoNT-A preparation was injected into each masseter muscle (bilaterally) at a dose of 25 IU (0.5 mL) per muscle by using a 1-mL syringe with a 29G 1/2-inch needle. Injections were performed at two points, 1 cm apart at the center of the lower third of the masseter muscle.
3D-CBCT
CBCT scans (Alphard 3030; Asahi Roentgen Inc., Kyoto, Japan) were performed before and 6 months after the first injection in both groups. The CBCT scans were acquired from the maxillofacial region for 17 s at a field of view of 20.0 × 17.9 cm, tube voltage of 80 kVp, and tube current of 5 mA. Patients were instructed to sit in an upright position with maximum intercuspation. The CBCT data were converted into digital imaging and communication in medicine (DICOM) files at a 0.39-cm slice thickness and reconstructed into 3D images by using the InVivo Dental software program (version 5.2; Anatomage, San Jose, CA, USA). For the hard-tissue measurements, reconstructed images were visualized using a threshold value of 176 Hounsfield units. The images were edited to separate the mandible from the whole image, and to remove the teeth above the alveolar bone.
3D measurements
Masseter muscle thickness and cross-sectional area
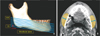
The mandibular CBCT images were digitally cut into 5.0-mm-thick sections parallel to the mandibular plane and were designated as C5, C10, C15, C20, C25, and C30 (Figure 1A). Maximum thicknesses and cross-sectional areas of the masseter muscles were calculated for each section of a CBCT image (Figure 1B).
Width of the mandibular angle area
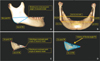
The reference points used to measure the widths of the mandibular angle area were the Go post (Gonion posterius: the most posterior point of the posterior border of the ramus) and Go inf (Gonion inferius: the most inferior point of the inferior border of the ramus). The widths of inter-Go post right-left (Rt-Lt) and inter-Go inf Rt-Lt were measured bilaterally (Figure 2A and 2B).
Volume of the mandibular angle area
The volume of the mandibular angle area was calculated along two planes: a plane connecting the Go inf, distobucco-occlusal point angle, and distolinguo-occlusal point angle of the second molar; and a plane connecting the Go post, distobucco-occlusal point angle, and distolinguo-occlusal point angle of the second molar. The volumes within the border were measured bilaterally (Figure 2C and 2D).
Statistical analysis
The data were analyzed using SAS (version 9.3; SAS Institute, Cary, NC, USA) and the cut-off for statistical significance was set at p<0.05. To evaluate the reproducibility of measurements, all landmarks were measured twice by the same person with a 2-week interval between measurements. The intraclass correlational coefficients ranged from 0.890 to 0.937, indicating excellent intraexaminer reliability. The Wilcoxon signed-rank sum test and Wilcoxon rank sum test were used to compare the measurements before and 6 months after the first injection within the two groups and between the two groups, respectively.
RESULTS
Soft-tissue changes: Masseter muscle thickness and cross-sectional area
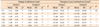
Masseter muscle thicknesses and cross-sectional areas differed statistically significantly before BoNT-A injection and 6 months after injection in both groups. At all section levels, group II exhibited a more substantial mean decrease than did group I (Table 1).
Hard-tissue changes: Width and volume of the mandibular angle area
No statistically significant differences in the width of the mandibular angle area were observed within either group, or between the two groups. However, the volume of the mandibular angle area decreased statistically significantly after BoNT-A injection in group II (Table 2).
DISCUSSION
BoNT-A is known to act specifically on muscles, and does not have any undesirable side effects. It blocks action potentials at neuromuscular junctions by inhibiting acetylcholine release. It does not damage the nerves or muscle structures, and muscle function is restored after the toxin is neutralized.13 BoNT-A rapidly (within hours) and irreversibly binds to presynaptic neurons at the neuromuscular junctions. After being internalized, it acts on a zinc-dependent endoprotease to disrupt some of the peptides necessary for acetylcholine release.14 This action may take up to 2 weeks to complete, and effectively destroys the affected neuromuscular junction, thereby causing muscular paralysis.5
We demonstrated that the mean masseter muscle thicknesses and cross-sectional areas decreased after BoNT-A injection; this finding is consistent with those of previous studies. Park et al.15 reported that the average decrease in muscle thickness was typically 18–20% of the preinjection thickness, as determined by ultrasonography and CT. Kim et al.16 reported that the volume of the masseter muscle decreased after the injection of BoNT-A on each side, as determined by CT.
Shim et al.17 reported that the associated reductions in volume and thickness in the lower facial contour were highest at 12 weeks after BoNT-A injection. After muscle paralysis, there is ongoing turnover at the neuromuscular junction, even though toxin exposure enhances this activity such that muscular function begins to return after several weeks and is usually complete by 6 months.5 Thus, muscle atrophy is a temporary event and new neuromuscular synapses can be resynthesized over a period of a few months.7 This means that additional injection of BoNT-A is required to sustain its effect in the lower facial contour. In the present study, we found that repeated injections of BoNT-A induced a greater reduction of masseter muscle thickness and cross-sectional area than did a single injection, as reported by Lee et al.18 This indicates that repeated injections of BoNT-A were more effective in improving masseteric hypertrophy, and suggests that repeated injections might induce more bony changes.
We observed no significant changes in the width of the mandibular angle area after BoNT-A injection in either group. However, we observed a significant change in the volume of the angle area in group II. This result implied there was no change in the shape of the mandible after a single set of bilateral BoNT-A injections, but repeated BoNT-A injections could affect the bone volume of the mandibular angle area. This finding is in agreement with the results of previous animal studies on Wistar rats and mice, which showed bone loss after BoNT-A injection into the muscles.1920 BoNT-A injection into the hind limb muscles of mice caused a decrease in bone mineral content and volume in the hind limb bone.20 However, we observed fewer bony changes in our subjects than was observed in the abovementioned study on mice.20 This difference in findings could be attributed to the dose of BoNT-A injected in the present study, which could not reduce the masseter muscle force enough to cause bony changes in the mandible. This was supported by the fact that we did not observe a change in group I in which the patients received a single BoNT-A injection. However, we observed a change in the volume of the angle area and additional reductions in muscle thickness and cross-sectional area among the patients in group II, which received an additional BoNT-A injection.
This study had several limitations. First, the sample size was too small to identify small changes in parameters such as the mandibular angle volume. Larger studies may find a more significant reduction in the mandibular angle volume in the single injection group. Nevertheless, we demonstrated that multiple injections of BoNT-A led to a greater reduction than did a single injection, and this might be an unwanted side effect of BoNT-A injection into the masseter muscle. Second, the present study only analyzed CT images captured 6 months after BoNT-A injection; changes in the mandibular angle area beyond this time-point were not investigated. Rafferty et al.11 investigated the short-term (4 weeks) and long-term (12 weeks) effects of BoNT-A injection into the masseter muscle of adult rabbits on the underlying bony changes. They reported a reduction of bone volume and functional parameters at 4 weeks, which partially recovered at 12 weeks after injection. Considering the difference in metabolic rates between humans and rabbits, the reduction of mandibular angle volume in the present study would be expected to increase gradually after 6 months.21 Future studies should investigate the effects of BoNT-A injection on bony changes beyond 6 months after injection, and whether increasing the number of BoNT-A injections leads to greater bone loss.
CONCLUSION
The results of this study demonstrated that repeated injections of BoNT-A into the masseter muscle decreased bone volume in the mandibular angle area in human adults. If multiple injections of BoNT-A into the masseter muscle are planned, the abovementioned unwanted side effect should be carefully monitored.

 XML Download