

 PDF
PDF ePub
ePub Citation
 Print
Print


INTRODUCTION
Mastication is the first step in the digestive process. During mastication, the food entering the mouth is physically ground, and this increases the food's surface area, thereby allowing efficient contact with digestive enzymes later in the digestive process.1 Masticatory efficiency is highly correlated to the quality of one's life, as it allows management of nutrition supply and health through food consumption. Thus, a decrease in masticatory efficiency can have a negative effect on the quality of life.2
Techniques for measuring masticatory efficiency have been in use since 1924; one of the techniques is fractional sieving, which involves separating the food after chewing for a given time period.3 Subsequently, simple and hygienic methods for assessing the size of food particles by using computerized image processing software were introduced.4 Recently, assessment methods using wax or gum have been introduced.56 Sato et al.5 suggested an easier and simpler method involving the use of a hexahedral paraffin wax cube with alternate layers of two different colors. The patient is allowed to masticate for a given time, after which masticatory efficiency is assessed by analyzing the chewed paraffin wax cube. The mixing ability index (MAI) is then calculated on the basis of the differences in the color mix and the area of the two differently colored wax cubes by using a computerized image analysis software.5
Several factors are known to affect masticatory efficiency, for example, the occlusal contact area,789 bite force,9101112 malocclusion,813141516 number of functional teeth,11 oral motor function,17 and temporomandibular dysfunction.8 Henrikson et al.8 and English et al.14 have reported that malocclusion negatively affects masticatory efficiency. Iwase et al.15 also reported that the masticatory efficiency of a patient with mandibular protrusion increased when malocclusion was improved after an orthognathic surgery. On the basis of their study on children and teenagers, Toro et al.13 reported no difference in the masticatory efficiency of patients with Class II malocclusion and normal occlusion. Previous studies on the effect of malocclusion on masticatory efficiency mostly investigated patients without stratifying them by age, for example, children and adult groups or children and teenager groups.81314 Considering the strong correlation between the occlusal contact, and near contact, areas of the second molar and mixing ability,7 studies investigating the masticatory efficiency of adult patients with malocclusions are necessary.
Therefore, the purpose of this study was to investigate differences in masticatory efficiency among adult patients with malocclusion classified according to Angle's method, which is the most universally accepted classification method17 using paraffin wax. The correlation between the occlusal contact area, one of the important factors affecting masticatory efficiency,71018 and masticatory efficiency was also assessed.
Go to : 
MATERIALS AND METHODS
Study subjects
In total, 61 patients (men, 27; women, 34; mean age, 24.0 years) who visited the Department of Orthodontics at Pusan National University Dental Hospital participated in this study. An initial screening, including cephalometric analysis and intraoral examination, was performed to ensure the participants met the following criteria:
Permanent dentition including the second molars with no missing teeth except for the third molars
No previous history of orthodontic treatment
No craniofacial deformity such as a cleft lip and palate, and no abnormality in tooth shape such as peg lateral and temporomandibular disorder
Consistency in anteroposterior skeletal and dental relationship (e.g., participants with skeletal Class II and Angle's Class I relationship due to mesial tilting of the mandibular molars were excluded).
All participants were divided into three groups according to Angle's classification of malocclusion corresponding with their anteroposterior skeletal relationship: Class I (n = 25), Class II (n = 15), and Class III (n = 21). Cephalometric measurements of sellanasion-A point (SNA), sella-nasion-B point (SNB) and A point-nasion-B point angles (ANB) were used to classify the groups according to the anteroposterior skeletal relationship. Mean and standard deviation of the measurements of skeletal Class I malocclusions were as follows: SNA (male, 82.86° ± 3.12°; female, 81.32° ± 2.76°), SNB (male, 80.26° ± 2.96°; female, 78.34° ± 2.68°), and ANB (male, 2.59° ± 1.05°; female, 2.98° ± 0.99°).19 Patients with higher SNA values or lower SNB values than those of Class I were categorized into the skeletal Class II malocclusion group. Patients with lower SNA values or higher SNB values than those of Class I were categorized into the skeletal Class III malocclusion group. Written and verbal consent was obtained from each participant. The study was reviewed and approved by the Institutional Review Board of Pusan National University Dental Hospital (PNUDH-2014-047).
Assessment of masticatory efficiency
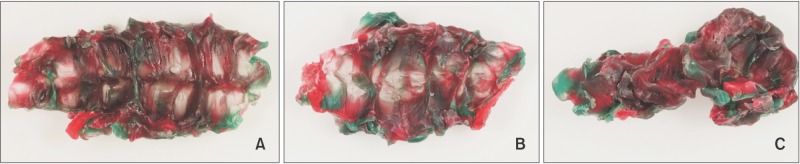
Masticatory efficiency was measured using the MAI developed by Sato et al.5 The MAI assesses masticatory efficiency based on the degree of mixture of colors after a participant chews a paraffin wax cube.5 The wax cube (12 × 12 × 12 mm) was prepared by alternately attaching three (2 × 2 × 12 mm) red and green hexahedron-shaped paraffin wax specimens (Dae Dong Industry Co., Daegu, Korea); six floors were stacked, and each specimen was rotated 90o after completing each floor. The wax cube was maintained at a room temperature and given to each participant, who was instructed to chew it ten times with their preferred side of molar areas (habitual chewing) and to spit it out.
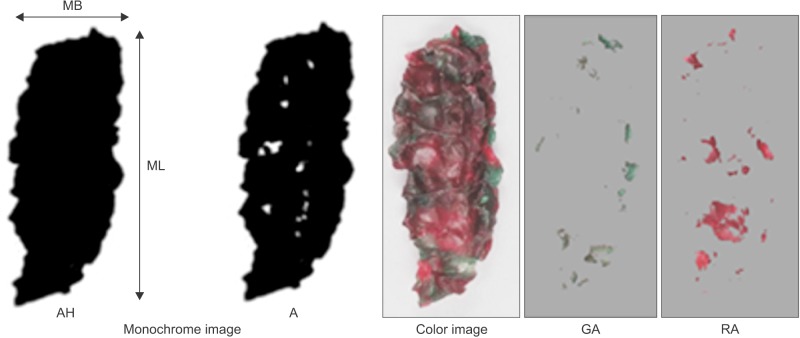
Two consecutive experiments were performed per participant. Once the wax specimens had completely dried after chewing, both sides of the specimens were photographed at a 30 cm distance and light source using a digital camera (D5300; Nikon Co., Tokyo, Japan). From one side of a sample, two kinds of digital images were acquired: a color image and a monochrome image. On the color images, the red area (RA) and the green area (GA) were measured using MATLAB (Mathworks Inc., Natick, MA, USA). On the monochrome images, the total projection area (AH), projection area above 50 µm in thickness (A), maximum length (ML), and maximum breadth (MB) were measured. For acquiring monochrome images, a view box was installed beneath the wax specimen, which was photographed in the same structure together with a 50-µm reference specimen by using view-box lighting (Figure 1). The photographs were converted to monochrome images by using PhotoScape 3.7 (MOOII Tech, Seoul, Korea), and the following values were calculated from the color and monochrome images by using MATLAB.
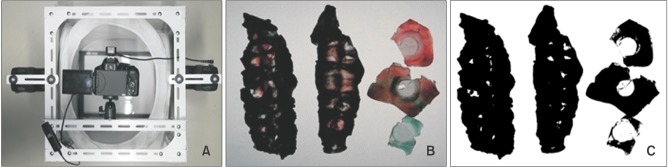 | Figure 1Measurements to determine the mixing ability index of patients with Angle's Class I, II, or III malocclusion. A, Imaging apparatus with a view box installed below for monochrome imaging. B, Photograph acquired using view-box lighting. C, Monochrome image converted using PhotoScape 3.7 (MOOII Tech, Seoul, Korea).
|
MAI = 1.360 × 10⁻¹ × MIX + 2.950 × 10⁻¹ × (TR) + 3.584 × 10⁻³ × (LB) − 2.032 × 10⁻³ × FF + 7.950 × 10⁻⁴ × (AH) −12.62
MIX: The ratio of the colored mixed area = 100 − (RA + GA)/A × 100
TR: The ratio of the area measuring more than 50 µm in thickness to the total projection area = 100 − A/AH × 100
LB: The ratio of the maximum length to the maximum breadth = ML/MB
FF: The shape factor showing the flatness of the sample = ML2 × π/4 × AH × 100
AH: The total projection area
A: The projection area measuring more than 50 µm in thickness
ML: The maximum length
MB: The maximum breadth
RA: The red area
GA: The green area
Measurement of the occlusal contact area
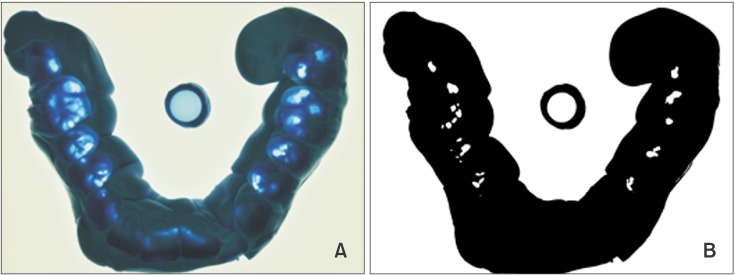
The occlusal contact area was defined as the area showing a thickness of less than 50 µm on a silicone interocclusal recording material (Perfect; Han Dae Chemical Co., Seoul, Korea) in maximum intercuspation. To measure the occlusal contact area with thickness less than 50 µm, a 50-µm reference specimen was photographed together with the actual specimen by using lighting from the view box installed under the specimen. The photographs were converted to monochrome images by using PhotoScape 3.7, and the converted images were used to measure the occlusal contact area by using MATLAB (Figure 3).
Statistical analysis
The MAIs and occlusal contact areas of Class I, Class II, and Class III malocclusions classified using Angle's classification showed a normal distribution (p > 0.05). One-way analysis of variance was performed to compare the MAIs and occlusal contact areas among the three groups. Tukey's tests were performed as posthoc tests. Pearson's correlation analysis was conducted to investigate the correlation between the occlusal contact area and MAI. All statistical analyses were performed at the 95% confidence level by using language R software (R Foundation for Statistical Computing, Vienna, Austria).
Go to :
RESULTS
Mixing ability index
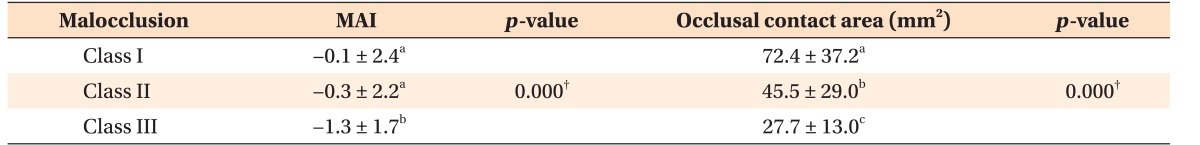
The mean MAI was −0.1 ± 2.4, −0.3 ± 2.2, and −1.3 ± 1.7 in the Class I, I, and III malocclusion groups, respectively (Table 1). The Class I malocclusion group showed the highest mean value, followed by the Class II and Class III malocclusion groups (Figure 4). No significant difference in the MAI was observed between the Class I and Class II malocclusion groups (p > 0.05), whereas a significant difference was observed between the Class I and Class III malocclusion groups (p < 0.01) and between the Class II and Class III malocclusion groups (p < 0.05; Table 1).
Occlusal contact area
The mean occlusal contact area was 72.4 ± 37.2, 45.5 ± 29.0, and 27.7 ± 13.0 mm2 in the Class I, II, and III malocclusion groups, respectively (Table 1). The Class I malocclusion group showed the highest average value, followed by the Class II and Class III malocclusion groups. Significant differences in the occlusal contact area were observed among the three groups (p < 0.01 for all; Table 1).
Correlation between the MAI and occlusal contact area A weak positive correlation was observed between the MAI and occlusal contact area (p < 0.01, r2 = 0.13).
Go to :
DISCUSSION
Masticatory efficiency is a measure of the ability to grind food.20 High masticatory efficiency implies that one can grind food into the maximum number of particles with the least effort.10 This parameter is strongly correlated to the quality of life, because it regulates nutrition supply and health through food consumption.2
In this study, we assessed the masticatory efficiency of adult patients with malocclusion according to Angle's classification by using a paraffin wax specimen of two different colors to calculate the MAI.5 Angle's method, which was developed a century ago, is the most universally accepted classification.17 However, Angle's classification system has some shortcomings.21 This method disregards the relationship of the teeth to the face (or facial profile).22 Although malocclusion is a three-dimensional (sagittal, transverse, and vertical) problem, Angle's system only considers anteroposterior deviation.22 Considering these limitations, we performed an initial screening with cephalometric analysis to exclude participants with different anteroposterior skeletal and dental relationships. For example, participants with skeletal Class II and Angle's Class I relationship due to mesial tilting of the mandibular molars were excluded. However, because this study was on masticatory efficiency according to Angle's classification, the applicability of its results are limited because of not having considered the transverse and vertical problems.
In the study by Sato et al.,5 the MAIs ranged from −5.0 to +3.0, and the MAIs of the three groups (namely, good, medium, and poor masticatory performance) were distributed in the following order: poor, medium, good on the study's scale. That is, the higher the MAI, the higher the masticatory efficiency.
We also measured the occlusal contact areas in the three groups of patients by using a silicone interocclusal recording material to investigate the correlation between masticatory efficiency and the occlusal contact area. The results revealed the highest mean MAI for the Class I malocclusion group, followed by the Class II and Class III malocclusion groups. Thus, masticatory efficiency was higher for patients with Class I malocclusions than for those with Class II malocclusions and was higher for patients with Class II malocclusions than for those with Class III malocclusions. This finding is consistent with those of other studies.914 While MAI showed no significant differences between the Class I and Class II malocclusion groups, a significant difference was observed between the Class I and Class III malocclusion groups and between the Class II and Class III malocclusion groups. Toro et al.13 also assessed the masticatory efficiency of children and teenagers with Class I and Class II malocclusions and concluded there was no significant difference between the two classes. However, van den Braber et al.23 reported differences between patients with Class I and Class II malocclusions. The different results in their study may be attributed to the fact that their patients with Class II malocclusions were scheduled to undergo orthognathic surgery.
Patients with Class III malocclusions showed the lowest masticatory efficiency in our study; this was consistent with the results of previous studies.1424 In particular, Iwase et al.15 reported that the masticatory efficiency of patients with Class III malocclusions scheduled to undergo orthognathic surgery was significantly lower than that of patients with normal occlusion, even though it gradually recovered after surgery and was close to that of patients with normal occlusion at 2 years. Subsequently, the masticatory efficiency of these patients improved through orthodontic or orthognathic treatment.
Several factors are known to affect masticatory efficiency, for example, the occlusal contact area,789 bite force,9101112 malocclusion,813141516 number of functional teeth,11 oral motor function,22 and temporomandibular dysfunction.8 English et al.14 have identified that occlusal contact and near contact areas affect masticatory efficiency. Julien et al.25 have mentioned the importance of the contact area of posterior dentition, body size, and bite force. Horie et al.7 have also reported that the occlusal contact near the second molar has a strong correlation with masticatory efficiency. In contrast, Wilding10 claimed that jaw movement and bite force, rather than occlusal contact, may have stronger impacts on masticatory efficiency.
The current study investigated the correlation between the occlusal contact area and masticatory efficiency. The occlusal contact area was defined as the area showing a thickness of less than 50 µm on a silicone interocclusal recording material. The mean occlusal contact area was the largest in the Class I malocclusion group, followed by the Class II and Class III malocclusion groups. This finding was consistent with that of the previous study, which reported that the occlusal contact area was the largest in patients with normal occlusion, followed by those with Class I, Class II, and Class III malocclusions.26 In our study, significant differences were observed among all three groups. However, Yoon et al.27 reported no significant difference in the occlusal contact area among their three Angle's classes by using a Dental Prescale® (Fuji Photo Film Co., Tokyo, Japan). However, they used a pressure-sensitive sheet with a thickness of 100 µm, which may have limited precise measurements.28
We observed a positive correlation between the occlusal contact area and masticatory efficiency, indicating that a larger occlusal contact area resulted in higher masticatory efficiency. This was consistent with the findings of previous studies.78112629 However, our result had a comparatively low level of explanation (r2 = 0.13). Several factors could affect masticatory efficiency.29 Among these, jaw exercise and masticatory ability have larger effects than do the occlusal contact area.10 Therefore, ascertaining a direct correlation between masticatory efficiency and the occlusal contact area was difficult. The small sample size may have been another limiting factor. Further studies with larger sample sizes are required to clarify this correlation. Moreover, long-term tracking of a patient's MAI through orthodontic treatment will aid in understanding the practical correlation between orthodontic treatment and masticatory efficiency.
Go to :
CONCLUSION
The results of our study revealed that masticatory efficiency was the highest among patients with Angle's Class I malocclusion, followed by those with Class II and Class III malocclusions. Similar results were obtained for the occlusal contact area. However, a weak positive correlation was observed between the occlusal contact area and masticatory efficiency.
Go to :
 XML Download