

 PDF
PDF ePub
ePub Citation
 Print
Print


INTRODUCTION
The presence of a narrow smile and dark buccal corridors has been the main area of interest when evaluating the esthetic outcome of orthodontic treatment.1234 Studies have demonstrated that orthodontists and laypeople rate smiles with relatively small buccal corridors more attractive than those with large buccal corridors.256 Additionally, extraction treatment has been claimed to constrict the dental arch and create wider buccal corridor ratios, which lead to subsequent deterioration of the smile.78 However, extracting teeth, mainly the four premolars, may be necessary to position the teeth ideally in their alveolar housing because of the physiological limits of the alveolus, periodontal structures, and soft tissues.
However, contemporary clinical research findings91011121314 are not in agreement with the claims of a link between extraction therapy and poor arch form and smile esthetics. Johnson and Smith9 stated that the dental arch is not a circle that shrinks in radius when teeth are removed. When comparing the treatment records of patients with and without extraction, the final arch form and, more importantly, the posttreatment arch location should not be overlooked. On the basis of a study utilizing standardized width measurements, Akyalcin et al.13 suggested that posttreatment and postretention changes in maxillary arch width, with or without premolar extractions, did not create any notable effect on smile esthetics. Additionally, studies have demonstrated that buccal corridors alone do not significantly affect the esthetic perception of the smile.31516
Smile is a complex human trait that can be influenced by various factors acting along three different spatial planes. The visualization and quantification of this dynamic feature at any given point may present challenges if the fourth dimension, i.e., time, is not taken into account. Therefore, orthodontists need to be cognizant of changes to the smile over time because of the aging process.1718 Current evidence suggests that premolar extractions may not necessarily narrow the maxillary arch widths or diminish the buccal corridor ratios. Nevertheless, we aimed to examine whether this holds true throughout life. Therefore, the purpose of this study was to analyze the long-term changes in maxillary arch widths and buccal corridor ratios in an orthodontic patient population treated with and without premolar extractions.
MATERIALS AND METHODS
This retrospective study was approved by the Committee for the Protection of Human Subjects in the University of Texas Health Science Center at Houston (UTHealth) under the exempt status (UTH-DB-14-0028). All patients were selected from a private orthodontic office that had long-term records of 297 patients. To be included in the study, individuals had to have a normal vertical growth pattern (26° < sella-nasion to mandibular plane [SN-MP] < 38°) and an acceptable mandibular incisor inclination (88° < incisor to mandibular plane angle [IMPA] < 100°) at the pretreatment period. Individuals who had skeletal anomalies and overjet greater than 5 mm or lower than 0 mm, craniofacial disorders, asymmetries, and missing teeth were excluded. Individuals who were previously treated with functional appliances, maxillary expansion devices, and surgical procedures were also excluded from the study sample. Of the 107 patients who met these criteria, we only selected 53 who had complete orthodontic records including pretreatment (T1), posttreatment (T2), and postretention (T3) study models, cephalometric radiographs, and frontal smiling photographs. Therefore, the final study sample comprised 28 patients who had undergone first premolar extraction (18 females and 10 males; extraction group) and 25 who had not undergone extraction (16 females and 9 males; nonextraction group). The extraction decision was based on the need for space to resolve crowding and to align the incisors ideally. The mean values of lower incisor irregularity in the extraction and nonextraction groups were 8.3 ± 2.2 and 6.7 ± 2 mm, respectively. The average age of the sample group was 12.8 ± 1.2 years. All orthodontic treatments were completed by two investigators (WGA and JMA) with 0.018 × 0.025-inch edgewise appliances (Alexander System, Ormco Corp., Orange, CA, USA).
The extraction group had a treatment time of 28.2 ± 4.2 months, whereas the nonextraction group had a treatment time of 27.3 ± 4 months. In both the extraction and nonextraction groups, retention was performed using an upper wrap-around Hawley retainer and a lower 3-3 bonded retainer for a mean duration of 4.6 years and 3.7 years, respectively. The T3 records were taken at a mean duration of 18.6 ± 6 years in the extraction group and 16.8 ± 5.8 years in the nonextraction group.
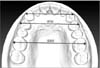
The maxillary and mandibular models of all three time periods (T1, T2, and T3) were scanned into digital stereolithographic (STL) files by using the Ortho Insight 3D Scanner (MotionView Software LLC, Hixson, TN, USA). Linear measurements were acquired for all time periods on the STL files by using the Motion View software (MotionView Software LLC). Maxillary canine, first premolar, and first molar widths were measured for all three time periods by using the facial axis (FA) points on the crowns (Table 1, Figure 1). In our study, the FA points were defined as the midpoint of the longitudinal axis on the facial aspect of the clinical crown corresponding to the most prominent part of the central lobe on each tooth except for the molars. For the first molars, the longitudinal axis of the crown was represented by the mesiobuccal groove. Premolar measurements were made at the level of the first premolars in the nonextraction group and for the T1 period in the extraction group. The second premolars were used for premolar width measurements for the T2 and T3 periods in the extraction group.
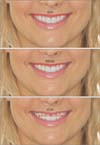
The frontal smiling photographs were digitized using a Perfection V700 photo scanner (Epson, Suwa, Japan). Images were opened in ImageJ software (version 1.47; NIH, Bethesda, MD, USA) and three buccal corridor ratios were calculated (Table 1, Figure 2). Dahlberg's formula19 was used to determine the reproducibility of the data. The method error was calculated using the following equation:  , where d is the difference between duplicated measurements and n is the number of replications. All measurements were repeated after 3 months for 10 randomly selected subjects.
, where d is the difference between duplicated measurements and n is the number of replications. All measurements were repeated after 3 months for 10 randomly selected subjects.IBM SPSS Statistics for Macintosh (version 21.0; IBM Corp., Armonk, NY, USA) was used for statistical analysis. The Shapiro-Wilk test showed that the data had a normal distribution (p > 0.05). Levene's test was used to verify that the group variances were equal (p > 0.05). One-way analysis of variance (ANOVA) was used to analyze the intragroup comparisons. Group × time interactions were computed using two-way repeated-measures ANOVA. The level of significance was set at p < 0.05. Post-hoc multiple comparisons were made using Bonferroni correction.
RESULTS
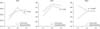
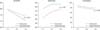
The method error varied between 0.13 and 0.61 mm. The means, standard deviations, and comparisons between the three time periods for the extraction group are presented in Table 2. Interpremolar width increased by 2.1 mm between T1 and T2 (p < 0.05). Accordingly, the interpremolar width between T1 and T3 also showed a significant difference (p < 0.05). All buccal corridor ratio measurements showed significant changes over time (p < 0.05). Significant differences in the intercanine width to smile width (ICW/SW) ratio were also observed between T1 and T3 (p < 0.05). Comparisons of the maximum dental width to SW (MDW/SW) ratio and the ICW to MDW (ICW/MDW) ratio revealed differences between T1 and T2 (p < 0.05), and between T1 and T3 (p < 0.05).
Descriptive statistics and comparisons between the three time periods for the nonextraction group are presented in Table 3. Similar to the change in the extraction group, the nonextraction group showed a significant increase in interpremolar width of 1.5 mm (p < 0.05) between T1 and T2. All buccal corridor measurements also showed significant changes over time (p < 0.05). Moreover, significant changes were observed for all measurements between all possible time-period pair comparisons (p < 0.05), except for the T2-T3 comparison of the MDW/SW ratio.
These results indicated that both soft-tissue extension and the amount of tooth exposure in the transverse dimension during smiling increased with age in both groups. As evident from the changes in the MDW/SW ratio, the buccal corridor space showed favorable decreases and remained virtually stable in the T3 period regardless of the treatment protocol.
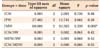
Findings of the two-way repeated-measures ANOVA are presented in Table 4. Intermolar width showed a significant group × time interaction because of its decrease in the extraction and increase in the nonextraction groups at T2 (Table 4, Figure 3; p < 0.05). Other than this observation, no significant group × time interaction was identified for any of the buccal corridor ratio measurements (Table 4, Figure 4). The lack of significant interactions meant that even though patients in the nonextraction group completed orthodontic treatment with slightly less buccal corridor space than did those in the extraction group, treatment type and time had a similar effect on changes in the buccal corridor.
DISCUSSION
With esthetic outcome being the foremost concern in current orthodontic practice, broad smiles and small buccal corridors have become a commonly desired treatment goal. Therefore, many clinicians have been advocating the use of nonextraction treatment. This attitude has originated from the perspective that transverse arch dimensions, buccal corridors, and smile esthetics are interlinked and that tooth removal will alter the dynamics between these factors.78
Gianelly11 challenged the assertion that premolar extractions narrow the dental arch by measuring the intercanine and intermolar widths in patients treated with and without premolar extractions. His findings showed that the only difference between the extraction and nonextraction groups was a slightly wider ICW in the nonextraction group. Kim and Gianelly10 and Akyalcin et al.13 confirmed that the use of fixed arch depths as a reference guide could prevent the narrowing seen in cases of extraction following orthodontic treatment. In another study, Yang et al.12 analyzed multiple factors related to buccal corridors and confirmed a negative correlation between the arch width (interpremolar) and buccal corridor area. However, the authors showed that the buccal corridor areas were not different between the extraction and nonextraction groups. Most recently, Meyer et al.14 reported that although arch widths increased more in their nonextraction group than in the extraction group, this did not result in any intergroup differences in the comparison of buccal corridor measurements. In agreement with previous studies, the current study did not demonstrate any significant decrease in arch width around the premolars. On the contrary, interpremolar width increased after treatment and remained virtually stable at the T3 period in both groups.
It appears that patients in the extraction and nonextraction groups may have slight differences in their arch width measurements. For instance, in our study, the extraction group initially had narrower arch widths. Previous studies have well documented that individuals who require extractions have more dental discrepancies than do those not requiring extractions.202122 This is partially due to the existence of a narrower dental arch base and crowded dentition that displaces the molars and premolars in a more palatal and mesial location in the patients requiring extraction. Although the interpremolar width was narrower in the extraction group than in the nonextraction group at T1, both groups showed increases in interpremolar width with treatment, and the changes were stable at T3. We also observed a tendency for the intermolar width to increase in the nonextraction group. However, the same trend was not present in the extraction group owing to the protraction of the molars into the extraction spaces. Nevertheless, changes to the arch width caused by treatment were remarkably stable in both groups as evidenced by the lack of significant differences between the T2 and T3 periods in the current study.
The current body of evidence has suggested no difference in the transverse smile characteristics of patients with or without extraction. Therefore, we were interested in investigating whether long-term stability could be assured in the transverse maxillary arch width measurements and buccal corridor ratios since relapse occurs along three spatial planes and soft tissues undergo a tremendous amount of change over time. To our knowledge, this is the first study to measure buccal corridor ratios directly using postretention records in addition to performing comparisons with pretreatment and posttreatment records. In both our treatment groups, the ICW/SW ratio decreased. This finding indicated an increase in lip extension over time. Although the ICW/SW ratio showed significant changes, the clinical relevance of this change might not pertain to the dark spaces between the teeth and the corners of the lips. ICW/MDW also showed a significant decrease in both groups, indicating that the visibility of teeth increased according to the increase in lip extension in both groups. As a result, both groups had a significant increase in the MDW/SW ratio, indicating that an improvement in the transverse dimension of the smile was achieved and maintained over time regardless of premolar extractions.
In a group of orthodontically treated and untreated individuals, most demonstrated a buccal corridor ratio of 89%.23 Studies that focused on the acceptable threshold of this variable indicated a significant decrease in the esthetic score when buccal corridor ratios were altered more than 10%.136 Additionally, Martin et al.2 reported that individuals who were perceived by laypeople to have the most attractive smiles had buccal corridor ratios of around 96%. In our study, at the end of the T3 period, patients in the extraction and nonextraction groups had buccal corridor ratios (MDW/SW) of 94.8% and 97.2%, respectively. This finding supported the fact that treatment and time had virtually similar effects on the buccal corridor spaces of the individuals included in our study sample.
A possible limitation of our study is that it analyzed static images from three different time periods acquired at a single angle. Since the variables measured using the photographs were based on ratios, strict calibration was not required. While this measurement technique can help us better understand the transverse dimension of the smile, it has inherent limitations. The real-life perception of a smile and its changes over time could be affected by many factors, including multiple soft-tissue components, lighting, and the vertical position of the teeth and gingiva. Future studies should focus on three-dimensional quantification and long-term evaluation of transverse smile characteristics in orthodontic patient populations.
CONCLUSION
1. Treatment involving premolar extractions did not have any adverse effects on the transverse dimension of the maxillary dentition.
2. Maxillary arch width measurements were virtually stable in the long term.
3. Buccal corridor ratios were not negatively affected by extraction treatment as compared to nonextraction treatment.
4. Long-term changes in buccal corridor ratios were comparable in both groups.


 XML Download